

Abstract
The pathogen Bacillus cereus causes diarrheal disease in humans. In the small intestine, B. cereus has to deal with anaerobiosis, low oxidoreduction potential, and carbohydrate limitation conditions. To gain insight into the virulence potential of low density B. cereus cells in such an environment, we cultured bacteria in low and high oxidoreduction potential anoxic conditions and in fully oxic conditions and compared their full secretomes. A unique pattern of proteins assigned to virulence factors was revealed. Among the 57 virulence-related factors, 31 were found for the first time in the B. cereus secretome. The putative fourth component of hemolysin BL (HblB′), enterotoxin FM, hemolysin II, and three new putative conserved enterotoxins were uncovered. Cross-comparison of the relative abundance of secreted proteins reveals that a restricted set comprising 19 proteins showed significant changes in response to redox condition changes. We complemented these results with transcriptomics data and confirmed the cytotoxicity of the B. cereus secretome toward Caco-2 human epithelial cells. Our data suggest that (i) the redox-dependent regulatory pathway may modulate the expression of a subset of virulence factors to ensure an appropriate response in a specific redox environment, and (ii) an early growth phase-dependent pathway could regulate the expression of several virulence factors, allowing B. cereus to infect a host whatever the redox conditions. This early growth phase-dependent pathway may function, at least partially, independently of the pleiotropic virulence gene regulator PlcR and may therefore be more specific to the B. cereus group.
Bacterial exoproteins are involved in many diverse and essential cell functions, such as growth, development, defense responses, cell-cell interaction, and intercellular communication. In addition to core exoproteins, pathogenic bacteria secrete the so-called virulence factors that improve virulence and survival. These are involved in colonization and subversion of host cells and thus in cytotoxicity. The Bacillus cereus phylogenetic group includes six Bacillus species: Bacillus mycoides, Bacillus pseudomycoides, Bacillus weihenstephanensis, Bacillus thuringiensis, Bacillus anthracis, and B. cereus sensu stricto (1). These bacteria are known to secrete a variety of virulence factors. Expression of most of them is activated by the pleiotropic transcriptional regulator PlcR (phospholipase C regulator) except in B. anthracis (2). In B. cereus sensu stricto and B. thuringiensis, PlcR activity peaks at the onset of the stationary growth phase and is dependent on the presence of PapR, a small signaling peptide that acts as a quorum-sensing effector (3). PapR is exported by bacterial cells and then reimported into the cell as a processed heptapeptide where it interacts with PlcR to facilitate binding to a palindromic sequence (named PlcR box) located upstream of its target genes (4). Altogether, 28 functional PlcR boxes have been identified in the genome of B. cereus sensu stricto type strain (ATCC 14579) (5), forming a PlcR regulon of at least 45 genes (6).
The PlcR regulon includes genes encoding the most extensively studied diarrheal enterotoxins: hemolysin BL (Hbl)1 (7), non-hemolytic enterotoxin (Nhe) (8), and cytotoxin K (CytK) (9). Hbl is composed of three distinct protein components, L2, L1, and B, which are all required to obtain full enterotoxigenic activity (7). The x-ray crystal structure of the B component has recently been elucidated, indicating that this toxin may form a pore similar to other soluble channel-forming proteins (10). The tripartite Hbl complex is encoded by genes clustered into a polycistronic operon with the transcriptional order hblC, hblD, and hblA (11). An ORF, named hblB, is located immediately downstream of hblCDA in the B. cereus ATCC 14579 genome (12). Based on sequence analysis, hblB appears to have been generated by duplication of hblA (13). Based on transcriptional analysis, it is considered a pseudogene (14). Nhe is also a three-component enterotoxin. The three components, NheA, NheB, and NheC, differ from those of Hbl (8, 15). All Nhe components are required for its cytotoxic activity (16). The nheABC gene cluster is also transcribed as an operon (15). However, an inverted repeat located between nheB and nheC has been suggested to mediate transcriptional repression of nheC, resulting in lower expression of nheC than nheA and nheB (15, 17). Unlike Hbl and Nhe, CytK is a single component protein that belongs to the β-barrel pore-forming toxins (18). Hbl, Nhe, and CytK are currently considered as the etiological agents of B. cereus sensu stricto diarrheal food-borne disease (19). However, several other proteins may contribute to the pathogenicity of B. cereus in diarrheal diseases, including hemolysin I (9), enterotoxin FM (20), InhA2 (21), phospholipases (22), proteins favoring bacterium-cell interactions (23, 24), and flagella proteins (25). Diarrheal virulence factors are thought to be produced in the small intestine of the human host. The human intestinal environment is pH-regulated, oxygen-deprived (26, 27), highly reduced (ORP ∼ −150mV) (28), and carbohydrate-limited (29, 30). To grow in such conditions, B. cereus may need to adapt its fermentative metabolism and express virulence factors through signal transduction pathways involving the two-component ResDE system (31, 32) and the redox regulator Fnr (33–35).
The genomic sequences established for numerous B. cereus sensu lacto strains paved the way to high throughput genomics, transcriptomics, and proteomics analyses. Four proteomics investigations have been conducted to characterize the B. cereus ATCC 14579 secretome at the early stationary phase from rich medium aerobically grown cells (6, 36–38). These investigations were carried out via a traditional two-dimensional electrophoresis approach, and isolated protein spots were identified by matrix-assisted laser desorption ionization mass spectrometry. Nowadays, more in-depth catalogs of proteins can be established by shotgun strategies using reverse-phase chromatography and high resolution tandem mass spectrometry (39). In addition, the same data set can be used to perform a semirelative protein quantitation by correlating the number of tandem mass spectra obtained for each protein, or “spectral count,” with its abundance in a mixture (40).
Here, we compare B. cereus ATCC 14579 secretomes established for cells grown under low ORP anoxic conditions (considered to mimic those encountered in the small human intestine), high ORP anoxic conditions, and fully oxic conditions. To better simulate intestinal conditions, bacteria were grown in pH-regulated cultures using glucose as the sole and limited carbon source. We focused here on the analysis of protein secretion at the early exponential growth phase. We report the secretion of an extensive set of 133 polypeptides. A total of 57 secreted proteins are related-virulence factors. Their presence suggests that B. cereus exhibits a virulence profile at early exponential growth whatever the pO2 status and redox conditions. Thirty-one new putative factors were uncovered in this study. They are highly conserved in the whole B. cereus group and could thus contribute to the pathogenic potential of B. cereus sensu lato.
EXPERIMENTAL PROCEDURES
Growth Conditions
B. cereus ATCC 14579 cells (5) were grown in 1.3 liters of MOD medium (41) supplemented with 30 mm glucose as carbon source in a 2-liter Discovery 100 bioreactor (Inceltech). Temperature and agitation speed were kept at a constant 37 °C and 300 rpm, respectively. pH was regulated at 7.2 by automatic addition of 2 m KOH. The bioreactor was equipped with a polarographic oxygen electrode (Mettler Toledo) coupled with a monitor to check the set point dissolved oxygen tension value (pO2). Sparging the bioreactor with air alone at 50 ml/h set a pO2 value of 100%. A 0% pO2 value was obtained by continuously flushing the medium at 50 ml/h with either pure nitrogen gas previously passed through a Hungate column or with pure hydrogen gas. The ORP was measured using a redox-combined electrode (AgCl, Mettler Toledo). ORP values were corrected according to the reference electrode value at 37 °C (+200 mV). Each bioreactor was inoculated with a subculture grown for 10 h (exponential growth phase) under anaerobiosis on glucose-containing MOD medium. Cells from the inocula were harvested by centrifugation (7,000 × g for 5 min at room temperature), washed in fresh medium, and then diluted 1:50 to achieve an initial optical density of the culture at 560 nm of 0.02. Two independent batches were cultured for each condition, i.e. full aerobiosis (pO2 = 100%, ORP = +140 mV), N2 anaerobiosis (pO2 = 0%, high ORP = −10 mV), and H2 anaerobiosis (pO2 = 0%, low ORP = −410 mV). The specific growth rate (μ) was determined using the modified Gompertz equation (42). Cultures were stopped at the early exponential growth phase, i.e. 1.5 h after peak growth rate (when μ = 80 ± 10% μmax). Cells and extracellular media were separated by centrifugation at 10,000 × g for 10 min at 4 °C. Cell pellets were immediately frozen at −80 °C until analysis.
Analytical Procedures
After culture, the extracellular media were first filtered through a low adsorption cellulose acetate membrane filter (Sartorius) with 45-μm pore size and then through a 20-μm pore size filter. Filtered fractions (40 ml) were then quickly frozen and kept at −20 °C until use. Cell dry weight was measured on cell pellets obtained from 500-ml culture aliquots as described previously (43). For RT-PCR assays, total RNA was isolated from cells obtained from 200 ml of culture using an RNeasy minikit (Qiagen) according to the manufacturer's instructions. Two additional DNase I digestion runs were performed to eliminate genomic DNA contamination.
Productions of enterotoxins Hbl and Nhe were quantified from culture supernatants as described previously (41). The amounts of Hbl produced were determined from the titer, which was defined as the reciprocal of the highest dilution of crude supernatant that gave an Hbl-dependent agglutination signal. The amounts of Nhe were estimated by measuring optical density at 420 nm (1 unit was defined as 1 optical unit at 420 nm). Specific enterotoxin production was defined as the amount produced per gram of cell dry mass (units·g−1).
Protein Precipitation and Biochemical Assays
Proteins were extracted twice from different extracellular fractions to get two technical replicates for each biological replicate. Fractions of 40 ml of B. cereus supernatants were thawed on ice and then precipitated using the deoxycholate/trichloroacetic acid method (44). After centrifugation at 13,000 × g for 10 min at 4 °C, extracellular proteins were dissolved in 100 μl of lithium dodecyl sulfate 1× sample buffer (Invitrogen). Samples were sonicated for 10 min in a transonic 780H sonicator and boiled for 5 min at 95 °C. Sonication and boiling were repeated twice. Extracellular proteins (30 μl) were then resolved by SDS-PAGE with a short migration of 10 min at 150 V on 4–12% gradient 10-well NuPAGE (Invitrogen) gels run with MES buffer (Invitrogen). Gels were stained with Coomassie Blue Safe stain (Invitrogen). After overnight destaining, the whole protein content from each well was extracted as a sole band. The bands were processed as described earlier for further destaining and iodoacetamide treatment (45). The samples were then proteolyzed with trypsin using proteasMAX surfactant (Promega) as recommended by the supplier. The resulting peptide mixtures were diluted 1:20 in 0.1% trifluoroacetic acid. Protein concentrations in B. cereus supernatants were determined using the Reagent Compatible Detergent Compatible (RCDC) protein assay (Bio-Rad) following the supplier's instructions.
Nano-LC-MS/MS Analysis
Two analytical nano-LC-MS/MS replicates were performed for each technical replicate on an LTQ-Orbitrap XL hybrid mass spectrometer (ThermoFisher) coupled to an UltiMate 3000 LC system (Dionex-LC Packings). This system was operated as described previously (46). Peptide mixtures (5 μl) were loaded and desalted on line on a reverse-phase precolumn, C18 PepMap 100 column (LC Packings), and then resolved on a nanoscale C18 PepMap 100TM capillary column (LC Packings) at a flow rate of 0.3 μl/min with a gradient of CH3CN, 0.1% formic acid prior to injection into the ion trap mass spectrometer. Peptides were separated using a 90-min gradient from 5 to 60% solvent B (0.1% HCOOH, 80% CH3CN). Solvent A was 0.1% HCOOH, 100% H2O. Full-scan mass spectra were measured from m/z 300 to 1,700 with the LTQ-Orbitrap XL mass spectrometer in data-dependent mode using the TOP7 strategy. In brief, a scan cycle was initiated with a full scan of high mass accuracy in the Orbitrap followed by MS/MS scans in the linear ion trap on the seven most abundant precursor ions with dynamic exclusion of previously selected ions.
Database Mining
Peak lists were generated with the MASCOT DAEMON software (version 2.2.2) from Matrix Science using the extract_msn.exe data import filter (ThermoFisher) from the Xcalibur FT package (version 2.0.7) from ThermoFisher. Data import filter options were set as follows: minimum mass, 400 m/z; maximum mass, 5,000 m/z; grouping tolerance, 0; intermediate scans, 0; and threshold, 1,000. Using the MASCOT search engine (version 2.2.04) from Matrix Science, we searched all MS/MS spectra against an in-house polypeptide sequence database containing the sequences of all annotated proteins coded by B. cereus ATCC 14579 chromosome (NC_004722) and plasmid pBClin15 (NC_004721). This database comprises 5,255 polypeptide sequences, totalling 1,455,982 amino acids. Searches for tryptic peptides were performed with the following parameters: full trypsin specificity, a mass tolerance of 10 ppm on the parent ion and 0.6 Da on the MS/MS, static modifications of carboxyamidomethylated Cys (+57.0215), and dynamic modifications of oxidized Met (+15.9949). The maximum number of missed cleavages was set at 2. All peptide matches with a peptide score below a p value of 0.001 were filtered by the IRMa 1.21.0 parser (47). A protein was considered validated when at least two different peptides were detected in the same experiment. The false-positive rate for protein identification was estimated using the appropriate decoy database as below 0.1% with these parameters. Mass spectrometry data (consisting of the assigned spectra for all the peptides mentioned in supplemental Table 2) were deposited in the PRIDE PRoteomics IDEntifications database (48) under accession numbers 11339–11362 and are freely available at http://www.ebi.ac.uk/pride.
Spectral Count-based Protein Quantification and Statistical Analysis
The number of MS/MS spectra per protein was determined in the eight different nano-LC-MS/MS analyses for each growth condition. Proteins were further considered for comparison only if peptides were seen in at least half of the nano-LC-MS/MS experiments for a specific growth condition. The 24 resulting data sets were normalized, taking into account cell dry weight measurements. Outlier data points were not removed. The data from each growth condition were compared by a TFold method using PatternLab software 2.0.0.13 (49). The -fold and p value cutoffs were set at 1.5 and 0.01, respectively. The false discovery rate with these settings was below 13%.
Detection of hblB Monocistronic Expression by RT-PCR
Portions of hblC, hblA, hblB, and the hblAB intergenic region were amplified by RT-PCR using the Titan One Tube RT-PCR system following the manufacturer's protocol (Roche Applied Science). The primer pairs used were 5′-CTTCATCAGGTCATACTCTT-3′ (forward) and 5′-ATACGCAACGGCAAATCAAT-3′ (reverse), 5′-CAAGGTGCAGATGTTGATGC-3′ (forward) and 5′-GCCACTGCGTGGACATATAA-3′ (reverse), and 5′-AGGCTGACCAAAAGCGTCTA-3′ (forward) and 5′-TCCTCCCATTGCGTAGACAT-3′ (reverse) for hblC, hblA, and hblB amplification, respectively. The primer pair used for RT-PCR through the hblAB intergenic region was 5′-TTCTCAATATTCGGGCGTTC-3′ (forward) and 5′-GCAAATAAACCAGCATCTTGC-3′ (reverse). To check whether contaminant genomic DNA was present, each sample was tested in a control reaction that did not contain reverse transcriptase. The efficiency of each primer pair was tested by amplifying subgenomic DNA.
Mapping Transcriptional Start Site
The 5′-end of hblB mRNA was mapped from a 5′ rapid amplification of cDNA ends (RACE) PCR product obtained with the 3′/5′ RACE kit (Roche Applied Science). Briefly, the first strand cDNA was synthesized from total RNA with hblB-specific primer SP1 (5′-AACAGCATGTGCTCTTGCAT-3′), avian myeloblastosis virus reverse transcriptase, and the deoxynucleotide mixture of the 3′/5′ RACE kit following the manufacturer's instructions. After purification and dA tailing of the cDNA, a PCR with the dT anchor oligonucleotide primer and the specific hblB SP2 primer (5′-AACCAGCATCTTGCAAAGCT-3′) followed by a nested PCR with SP3 primer (5′-TCGTTTGTTCAATTTCAATTGC-3′) led to a PCR product of ∼250 bp as revealed by 2% agarose gel electrophoresis. This PCR product was purified and sequenced.
Relative Quantification of Gene Expression Using SYBR Green Real Time PCR
Real time RT-PCR was performed using SYBR Green technology on a LightCycler Instrument (Roche Applied Science) as described previously (32). Sequences specifically used in the present study are given in supplemental Table 1. The data sets were normalized, taking into account cell dry weight measurements, which were 82.4 ± 0.4, 132.4 ± 4.0, and 187.8 ± 1.8 mg·liter−1 in low ORP anoxic, high ORP anoxic, and fully oxic conditions, respectively.
Growth Inhibition Tests with Human Caco-2 Cells
Human colon adenocarcinoma Caco-2 cells were purchased from the European Collection of Animal Cell Culture (ECACC, Salisbury, UK). They were cultured in 75-cm2 Falcon flasks in high glucose Dulbecco's modified Eagle's medium (DMEM) supplemented with 10% heat-inactivated fetal bovine serum (FBS), 100 units/ml penicillin, 100 mg/ml streptomycin, and 1% nonessential amino acids (Invitrogen). Cells were incubated at 37 °C in a humidified atmosphere with 5% CO2 and subcultured to preconfluence after trypsinization (0.5% trypsin, 2.6 mm EDTA). For growth inhibition tests, cells were seeded at 4.5 × 10⁴ cells/well in 96-well plates with DMEM supplemented with 3% FBS, 5 mg/ml transferrin, 5 ng/ml selenium, and 10 mg/ml insulin (Invitrogen). Sterile supernatants from oxic, high ORP anoxic, and low ORP anoxic conditions were diluted with DMEM supplemented with 3% FBS culture medium to reach a final protein concentration of 1.6 mg/ml. Caco-2 cell growth was tested as follows. At 24 h after seeding, cells were exposed to these modified media and incubated for 0, 48, and 96 h. The media were renewed every 48 h. At each time point, Caco-2 cell proteins were precipitated with 50 μl of trichloroacetic acid (50%, v/v) and stained with 200 μl of sulforhodamine B at 0.4% (w/v) (Sigma-Aldrich) diluted in 1% acetic acid. Cells were rinsed three times with 1% acetic acid. Then, 200 μl of 10 mm Tris-HCl (pH 10.5) was added to each well. Absorbance was measured at 490 nm with a FLUOstar spectrometer (BMG Labtech). The relationship between cell number and absorbance was linear from 0 to 200,000 cells/well. To verify that the inhibition effect of bacterial supernatants on Caco-2 cell growth was due to protein content rather than the bacterial growth medium, supernatant samples were filtered through Microcon ultrafiltration units (Millipore) with a protein cutoff at 3,000 Da by centrifugation at 10,000 × g for 30 min at 4 °C and assayed in the same conditions. These supernatants did not exhibit any inhibitory effect on Caco-2 cell growth curves.
RESULTS
Shotgun Proteomics Analysis of Early Growth B. cereus Cells
The early secretomes of B. cereus ATCC 14579 grown in pH-regulated batch cultures on glucose-containing MOD medium were analyzed in duplicate under low ORP anaerobiosis (ORP = −410 mV, pO2 = 0%), high ORP anaerobiosis (ORP = −10 mV, pO2 = 0%), and full aerobiosis (ORP = +140 mV, pO2 = 100%). For each of the six biological samples, the extracellular proteins were extracted twice to validate our technical procedure. For each technical duplicate, we performed two analytical nano-LC-MS/MS analyses. The full recorded data set for the resulting 24 nano-LC-MS/MS runs corresponds to 107,090 MS/MS spectra. One-third of these spectra were assigned to specific B. cereus peptides. A total of 1,018 different peptides were confidently listed (see supplemental Table 2). They made it possible to validate the presence of 133 proteins (see supplemental Table 3). The number of MS/MS spectra assigned to each polypeptide detected in the 24 nano-LC-MS/MS runs and normalized using the dry weight of considered biological replicates is reported in supplemental Table 3. We evaluated the analytical, technical, and biological variances in our data. The total numbers of proteins detected per nano-LC-MS/MS are quite similar. Standard deviations and mean coefficients of variation were determined for all replicates. Mean coefficient of variation values were below 0.18, 0.18, and 0.32 for analytical, technical, and biological replicates, respectively. The detected proteins were cataloged into five groups according to function: 1) toxins or putative toxins, 2) degradative enzymes and adhesins, 3) flagella components, 4) metabolism, and 5) others (see supplemental Table 3). Fig. 1 shows the distribution of proteins among the five functional groups in the three different growth conditions, taking into account their quantities. The results indicate that potential virulence factors, including toxins, degradative enzymes and adhesins, and flagella components (groups 1–3), represented 85.7 ± 6.1, 91.5 ± 3.6, and 87.3 ± 1.7% of extracellular proteins under fully oxic, high ORP anoxic, and low ORP anoxic conditions, respectively. For fully oxic, high ORP anoxic, and low ORP anoxic conditions, respectively, 33.4 ± 1.3, 38.8 ± 2.8, and 32.4 ± 4.8% of MS/MS spectra were assigned to toxins and putative toxins, but the level of toxins that accumulated in the supernatant was slightly higher in high ORP anaerobic conditions. These results indicate that early growth B. cereus cells show a toxinogenic profile independently of the oxygenation and redox status of the extracellular medium when cultivated in pH-regulated, carbohydrate-limited medium.
Fig. 1.
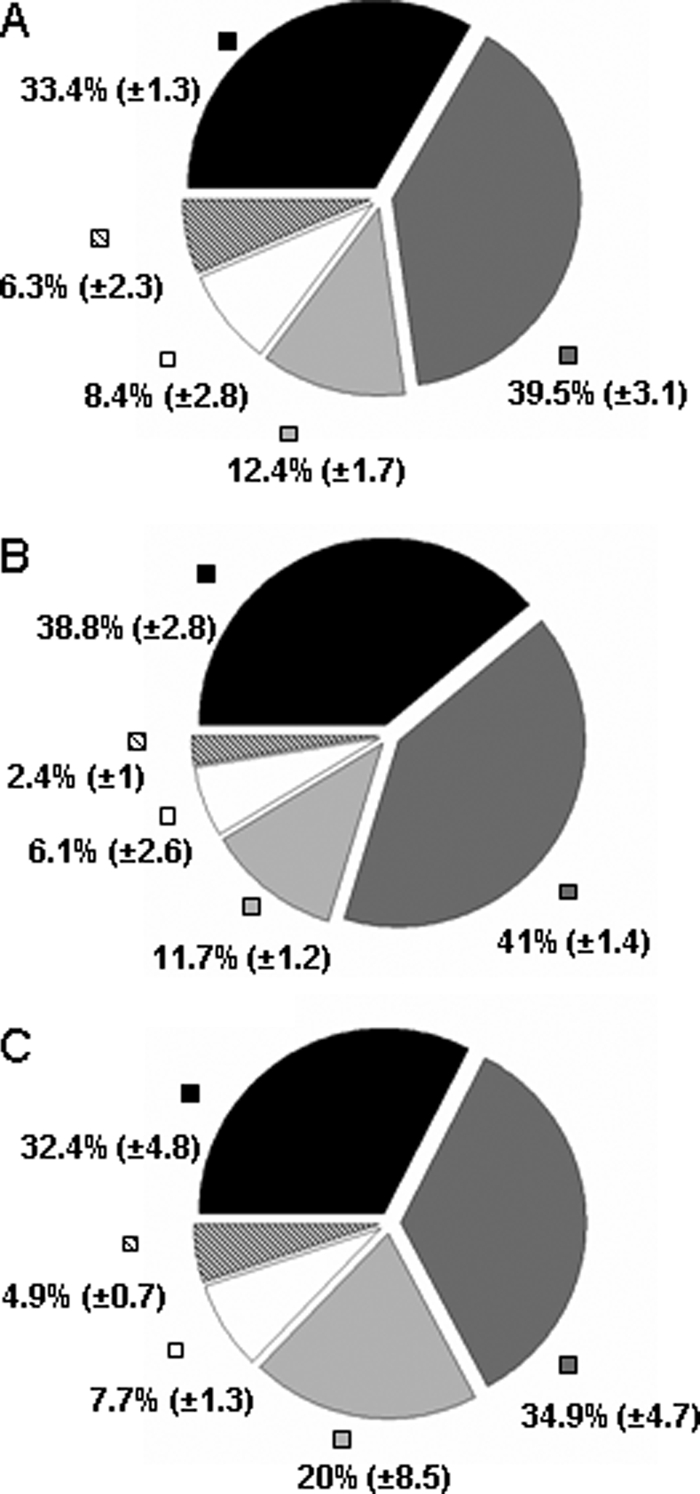
Functional distribution of proteins identified in B. cereus secretome. A, ORP = −410 mV, pO2 = 0%. B, ORP = −10 mV, pO2 = 0%. C, ORP = +140 mV, pO2 = 100%. The diagrams represent the average proportion of each functional protein group based on total spectral counts (see supplemental Table 3). Black, toxins or hypothetical toxins; dark gray, degradative enzymes and adhesins; gray, flagella components; white, metabolism enzymes; hatched, others. Standard deviations are indicated in parentheses.
Composition of B. cereus Secretome
Enterotoxin Multicomponent Complexes
Under the various conditions used in this study, we uncovered 57 ORF products that may contribute to B. cereus ATCC 14579 virulence. Table I lists their main characteristics. A total of 35 secreted polypeptides are degradative enzymes and adhesins, whereas 14 are toxins or putative toxins. This suggests that B. cereus secretes a large variety of proteins that may be important for its virulence. Among the 57 ORF products, 31 proteins have never been detected in previous studies of the B. cereus ATCC 14579 secretome. They are labeled “novel” in Table II. The third component of Nhe (NheC) clearly illustrates this novelty with seven specific peptides detected and a high number of redundant MS/MS spectra (230). NheC presence is consistent with the concomitant detection of NheA (nine proteotypic peptides) and NheB (10 proteotypic peptides) components (see supplemental Table 2). Among the new toxins identified, we found the hblB gene product (HblB′, GI: 30021213). Fig. 2A shows that the hblB gene is located 376 bp downstream of the hblCDA cistrons encoding the three components of Hbl (L2, L1, and B). Sequence analysis indicated that HblB′ comprises a “Bacillus_Hbl superfamily” domain consisting of the three well known components of Hbl. Fig. 2D shows the sequence coverage for this polypeptide, taking into account all the peptides identified in our proteomics data (see supplemental Table 2). This polypeptide comprises a predicted signal peptide of 23 amino acids. A total of 14 different peptides were detected covering 23% of the theoretical sequence. These data definitively proved the presence of this polypeptide in the secretome of B. cereus whatever the oxygenation and redox growth conditions. Normalized spectral counts for this component are 14.7 ± 2.9, 11.8 ± 1.4, and 9.7 ± 1.2 under fully oxic, high ORP anoxic, and low ORP anoxic conditions, respectively. Although semiquantification of the four components cannot be directly compared by spectral count, it is probable that HblB′ accumulates in B. cereus supernatants in lower amounts than HblL1, -L2, and -B (with normalized spectral counts of 88.9 ± 16.0, 54.5 ± 12.7, and 70.4 ± 10.3% for low ORP anoxic conditions). To test whether hblB is transcribed independently of hblCDA, RT-PCR experiments were performed on total RNA isolated from ATCC 14579 cells grown under the three tested conditions. Fig. 2A indicates the location of the primer pairs used for the detection of hblC, hblA, hblB as well as the intergenic region between hblA and hblB whose nucleotide sequence is given in Fig. 2C. Fig. 2B shows that RT-PCR amplification-generated products are of the expected size for all tested genes, whereas for the intergenic region, no PCR amplification could be obtained. Transcript amounts were quantified using real time PCR. We found that under both conditions, hblB mRNAs were significantly 3-fold less abundant than hblC and hblA mRNAs, indicating that hblB may be expressed as a single transcript. A transcriptional start site (T) for this short transcript was located by 5′ RACE-PCR at 125 bp from the translational initiation codon start (Fig. 2C). Upstream of this transcriptional start site, we identified a potential housekeeping σA type −10 sequence TTAAAT (underlining indicates deviations from −10 σA consensus for Bacillus subtilis). This sequence is preceded by a poorly conserved −35 signal (TTGTAG), suggesting the involvement of a transcriptional activator. Furthermore, the hblB locus is preceded and followed by inverted repeats (ΔG0 = −16 and −19.9 kcal/mol, respectively) that may be transcriptional terminators (Fig. 2A). Taken together, our data indicate that the hblB gene from B. cereus ATCC 14579 may be transcribed as a single unit, leading to secretion of HblB′ at early stage exponential growth whatever the oxygenation and redox conditions.
Table I. Putative virulence factors among B. cereus-secreted proteins detected in this study.
ACP, acyl carrier protein.
| Proteina | Functional annotation and designation | Accession no. (GI) | MMb | Secretion signals and/or functional domainc | Previously detected in B. cereus proteomics studies (Refs.)d | PlcRe |
|---|---|---|---|---|---|---|
| Toxins or putative toxins | ||||||
| HblL2 | Enterotoxin Hbl component L2 | 30021216 | 49 | S | 36, 37, 38 | • |
| HblL1 | Enterotoxin Hbl component L1 | 30021215 | 44 | S | 36 | • |
| HblB | Enterotoxin Hbl component B | 30021214 | 42 | S | 36, 38 | • |
| HblB′ | Enterotoxin Hbl component B′ | 30021213 | 52 | S | Novel | |
| NheA | Enterotoxin Nhe component A | 30019951 | 44 | S | 36–38 | • |
| NheB | Enterotoxin Nhe component B | 30019952 | 43 | S | 36–38 | • |
| NheC | Enterotoxin Nhe component C | 30019953 | 40 | S | Novel | • |
| CytK | Hemolysin, cytotoxin | 30019265 | 37 | S | 36, 37 | • |
| HlyI | Hemolysin, cereolysin | 30023138 | 57 | S | 36, 37 | • |
| HlyII | Hemolysin | 30021625 | 46 | S | Novel | |
| EntFM | Enterotoxin | 30020092 | 45 | S, SH3 × 3, NlpC/P60 | Novel | |
| EntA | Enterotoxin-like | 30023271 | 31 | S, SH3 × 2, 3D | Novel | |
| EntB | Enterotoxin-like | 30021068 | 55 | S, SH3 × 2, 3D | Novel | |
| EntC | Enterotoxin-like | 30018972 | 46 | S, TM, SH3 × 2, 3D | Novel | |
| Degradative enzymes and adhesins | ||||||
| ColC | Protease, collagenase | 30018742 | 109 | S, PKD | Novel | • |
| ColA | Protease, collagenase | 30021271 | 110 | S, PKD | 36, 37 | • |
| Sfp | Protease, subtilase family protease | 30021855 | 67 | S | 36, 37 | • |
| CnaA | Collagen adhesion protein | 30019042 | 144 | S, TM | Novel | |
| CnaB | Collagen adhesion protein | 30021628 | 121 | S, TM | Novel | |
| CnaC | Collagen adhesion protein | 30023387 | 38 | S, TM | Novel (67) | |
| NprP2 | Neutral protease | 30020857 | 63 | S | 36, 37 | • |
| NprC | Neutral protease | 30021487 | 62 | S | 36 | • |
| NprB | Neutral protease | 30023381 | 65 | S | 36, 37 | • |
| CwpA | Cell wall endopeptidase | 30018899 | 42 | S, 2xSH3 | Novel | |
| CwpB | Cell wall endopeptidase | 30019580 | 47 | S, TM | Novel | |
| ChbA | Chitin-binding protein | 30020919 | 50 | S, TM, FN3 | 36 | |
| ChbB | Chitin-binding protein | 30020946 | 24 | S, TM, FN3 | Novel | |
| VanY1 | d-alanyl-d-alanine carboxypeptidase | 30021128 | 48 | S | Novel | |
| VanY2 | d-Alanyl-d-alanine carboxypeptidase | 30018287 | 42 | S | Novel | |
| VanY3 | d-Alanyl-d-alanine carboxypeptidase | 30022592 | 29 | S | Novel (67) | |
| FabZ | (3R)-Hydroxymyristoyl-ACP dehydratase | 30023312 | 16 | S, TM | Novel | |
| PlcA | Phospholipase | 30021854 | 38 | S | 36, 37 | • |
| UshA | 5′-Nucleotidase | 30021232 | 58 | S | 36 | |
| Tgc | Protease, transglutaminase | 30020129 | 44 | S | 38 | |
| PlcB | Phospholipase | 30018852 | 32 | S | 36, 37 | • |
| HhoA | Protease | 30021701 | 44 | S, TM | Novel | |
| SipA | Signal peptidase I | 30021185 | 21 | S, TM | Novel | |
| InhA1 | Zinc metalloprotease | 30019435 | 86 | S | 36, 38 | |
| InhA2 | Zinc metalloprotease | 30018848 | 88 | S | 36, 38 | • |
| Sph | Sphingomyelinase | 30018853 | 37 | S | 36, 38 | • |
| MpbE | Metalloprotease, enhancin | 30021488 | 84 | Novel | • | |
| Smc | Cell wall peptidase | 30018861 | 47 | S, TM, 3D, Smc | Novel | |
| SlpA | S-layer protein A, autolysin | 30019146 | 65 | S, SLH | Novel | • |
| CwlC | N-Acetylmuramoyl-l-alanine amidase | 30023266 | 61 | S, 5xSH3, NlpC/P60 | Novel | |
| CwlD | N-Acetylmuramoyl-l-alanine amidase | 30023229 | 48 | S, Cluap1, NlpC/P60 | Novel | |
| CwlE | Peptidoglycan endo-β-N-acetylglucosaminidase | 30019051 | 70 | S, 2xSLH | Novel | |
| CwlB | N-Acetylmuramoyl-l-alanine amidase | 30019057 | 59 | S, 3xSLH | 36 | |
| CwlA | N-Acetylmuramoyl-l-alanine amidase | 30019043 | 38 | S, PGRP, 2xSLH | 36 | |
| CwlF | Endolysin/N-acetylmuramoyl-l-alanine amidase | 29899132 | 26 | GH25_PlyB-like | Novel | |
| Flagella components | ||||||
| FlaC | Flagellin | 30019803 | 29 | 36, 37 | ||
| FlaB | Flagellin | 30019804 | 29 | 36, 37 | ||
| FlaA | Flagellin | 30019805 | 27 | 36, 37 | ||
| FlgE | Flagellar hook-associated protein | 30019797 | 46 | Novel | ||
| FlgG | Flagellar basal body rod protein | 30019815 | 28 | Novel | ||
| FlgK | Flagellar hook-associated protein | 30019783 | 48 | Novel | ||
| FlgL | Flagellar hook-associated protein | 30019784 | 32 | Novel | ||
| FliD | Flagellar capping protein | 30019785 | 51 | Novel |
a In some cases, the abbreviated names of proteins are inferred from those used for the respective orthologs from other Bacillus strains.
b Domains that are inherently related to the functional annotation of the proteins are not indicated. S, export signal peptide; TM, transmembrane domain; FN3, fibronectin type III domain; 3D, extracellular cell wall-binding domain; NLP/P60, cell wall peptidase family domain; PKD, polycystic kidney disease domain; PGRP, homologous domain to proteins involved in peptidoglycan recognition; SLH, S-layer homology domain; Cluap1, homology domain to clusterin-associated protein-1; GH25_PlyB-like, glycosylhydrolase family 25 catalytic domain found in PlyB bacteriophage.
c Molecular mass (MM) is given in kDa.
d Proteins reported for the first time in the B. cereus sensu lato secretome are marked in bold characters as novel. Proteins reported for the first time in the B. cereus ATCC 14579 secretome are marked in normal characters as novel.
e Proteins whose gene expressions are PlcR-controlled (6) are indicated by a bullet.
Table II. Specific levels of proteins classified as virulence factors in low ORP anoxic (pO2 = 0%, ORP = −410 mV) and fully oxic (pO2 = 100%, ORP = +140 mV) extracellular media relative to high ORP anoxic (pO2 = 0%, ORP = −10 mV) extracellular medium.
Early secreted proteins were collected from pH-regulated batch cultures performed under low ORP anoxic (pO2 = 0%, ORP = −410 mV), high ORP anoxic (pO2 = 0%, ORP = −10 mV), and fully oxic conditions (pO2 = 100%, ORP = +140 mV). Only changes satisfying statistical and -fold change criteria (p value ≤0.01 and n-fold ≤−1.5 or ≥1.5) at least in one condition are shown.
| Protein name | -Fold difference and significance |
|||
|---|---|---|---|---|
|
pO2 = 0%, ORP = −410 mV |
pO2 = 100%, ORP = +140 mV |
|||
| p value | n-Folda | p value | n-Folda | |
| Toxins | ||||
| HlyII | 0.00 | −14.96 | 0.00 | +1.83 |
| EntC | 0.36 | −1.05 | 0.00 | −1.53 |
| Degradative enzymes and adhesins | ||||
| ChbA | 0.00 | +1.31 | 0.00 | −4.75 |
| InhA1 | 0.25 | −1.14 | 0.00 | +3.09 |
| InhA2 | 0.03 | +1.29 | 0.00 | +1.97 |
| CwlF | 0.38 | +1.09 | 0.00 | +2.97 |
| CwpA | 0.24 | +1.10 | 0.00 | −2.52 |
| VanY1 | 0.01 | −1.73 | 0.00 | −2.62 |
| Sfp | 0.27 | −1.13 | 0.00 | +1.89 |
| PlcB | 0.44 | −1.02 | 0.00 | -1.62 |
| NprC | 0.00 | −1.62 | 0.00 | +1.75 |
| SlpA | 0.09 | −1.35 | 0.01 | +2.23 |
| VanY3 | 0.00 | −2.07 | 0.00 | −1.55 |
| Smc | 0.00 | +1.61 | 0.00 | +1.60 |
| ChbB | 0.01 | −1.55 | 0.04 | +1.45 |
| CwlE | 0.01 | −2.95 | 0.10 | −1.63 |
| MpbE | 0.00 | −1.64 | 0.15 | +1.22 |
| Flagella components | ||||
| FlaA | 0.33 | +1.14 | 0.01 | +3.11 |
| FlaC | 0.06 | −1.26 | 0.00 | +1.80 |
a Each -fold change value represents the mean protein level of the low anoxic or fully oxic sample in relation to the high anoxic sample. The relative amount of each protein was determined using PatternLab software. Plus and minus symbols indicate up- and down-secretion of the proteins, respectively. Numbers in bold indicate data that satisfied both n-fold (≤−1.5 or ≥1.5) and statistical criteria (p value ≤0.01).
Fig. 2.

Proteomics and transcriptomics validation of hblB expression in B. cereus ATCC 14579. A, gene organization of the B. cereus chromosome locus encompassing hblCDA and hblB. Arrowheads indicate σA putative promoters and show the direction of transcription. The stem-loop-type structures point to ρ-independent transcriptional terminators. The small arrows show the position and direction of the gene-specific primers used in RT-PCR and PCR. Lower case labels a, b, c and d show RT-PCR and PCR-generated products. B, RT-PCR and PCR analyses for detecting hblC, hblA, and hblB transcripts and DNA, respectively, and the intergenic (IG) region between hblA and hblB in strain ATCC 14579. Numbers on the left indicate the size of the amplified fragments in base pairs. C, nucleotide sequence of the intergenic region between hblA and hblB. The sequence of the putative hblCDA terminator is underlined, the transcriptional start site (+1) of hblB and the putative −35 and −10 motifs are boxed. D, amino acid sequence of hblB product (HblB′). Peptides detected by LC-MS/MS are boldfaced. The signal peptide identified using Signal P software is underlined.
Novel Single Component Enterotoxins
As shown in Table I, the enterotoxin EntFM (GI: 30020092) was detected for the first time in the B. cereus secretome. This protein exhibits three SH3 domains known to be involved in protein-protein interactions together with an NlpC/P60 domain that shares similarities with cell wall peptidases and that could contribute to its cytotoxic activity (20). Three new proteins (GI: 30018972, GI: 30021068, and GI: 30023271) also sharing similarities with SH3 domain-containing enterotoxins were detected in our proteomics data set. These three proteins are hitherto annotated as “enterotoxin/cell wall-binding protein” because they possess, in addition to the SH3 domains, putative cell wall peptidase domains named 3D domains (Fig. 3). A set of 13 (GI: 30018972), 13 (GI: 30021068), and eight (GI: 30023271) proteotypic peptides were confidently detected. Their sequence coverages are 35, 32, and 34%, respectively. Using RT-PCR, we investigated the expression of the three corresponding genes in aerobically, high ORP, and low ORP anaerobically grown B. cereus cells. Transcripts were detected for each of the three genes whatever the growth condition (Table III) in agreement with the proteomics results. Based on these experimental data, we propose to name these putative enterotoxins EntA, EntB, and EntC, respectively. Interestingly, none of the single putative enterotoxins newly identified in the present study have been previously listed as potential members of the PlcR regulon.
Fig. 3.

Sequence alignment of three novel enterotoxins, EntA, EntB, and EntC. Sequence alignment was performed using ClustalW software. Conserved domains are colored gray: the SH3 domains are located at the N terminus, and the 3D domains are located at the C terminus. The PRK13914 multidomain is boxed. * means that the residues in that column are identical in all sequences in the alignment. : means that conserved substitutions have been observed. . means that semi-conserved substitution are observed.
Table III. n-Fold change in specific expression levels of toxins or putative toxins in low ORP anoxic (pO2 = 0%, ORP = −410 mV) and fully oxic (pO2 = 100%, ORP = +140 mV) extracellular media relative to high ORP anoxic (pO2 = 0%, ORP = −10 mV) extracellular medium.
Each change (n-fold) represents the mean specific mRNA level of the low ORP anoxic (pO2 = 100%, ORP = −410 mV) or fully oxic sample (pO2 = 100%, ORP = −410 mV) relative to the high ORP anoxic sample (pO2 = 0%, ORP = −10mV). Mean values were obtained from two measures for two independent cultures. Only ratios expressed at above 2.0 (absolute values) are significant according to the precision of the method. These ratios are indicated in bold. Plus and minus symbols indicate gene up- and down-regulation, respectively.
| Genes | pO2 = 0%, ORP = −410 mV | pO2 = 100%, ORP = +140mV |
|---|---|---|
| hblC | +1.1 | +1.1 |
| hblB | −1.5 | +1.7 |
| nheA | +1.4 | +1.1 |
| hlyII | −3.4 | +2.2 |
| entA | −1.3 | −1.4 |
| entB | −2.3 | −2.1 |
| entC | −1.3 | +2.4 |
Cytotoxicity of Secreted Virulence-related Factors toward Caco-2 Cells
We checked that fully aerobic, high ORP anaerobic, and low ORP anaerobic culture filtrate supernatants had inhibitory effects on the cellular growth of human colon epithelial cells (Caco-2 cells). Fig. 4 shows the growth inhibition observed when Caco-2 cells were exposed to the three bacterial filtrate supernatants. We noted that Caco-2 cells were more sensitive to bacterial aerobic and anaerobic high ORP filtrate supernatants (less than 25% cell survival at 48 and 96 h) than to bacterial anaerobic low ORP filtrate supernatant (more than 50% cell survival at 48 and 96 h). We thus assume that B. cereus ATCC 14579 produces biologically active virulence-related proteins in early growth phase whatever the pO2 status and ORP conditions. However, the cytotoxic potential of early growth B. cereus cells may be lower in the low ORP anoxic condition than in other conditions.
Fig. 4.

Effects of bacterial supernatants on human Caco-2 cell growth. Caco-2 cells were exposed to bacterial filtrate supernatants prepared from low ORP anaerobic (pO2 = 0%, ORP = −410 mV), high ORP anaerobic (pO2 = 0%, ORP = −10 mV), and fully aerobic (pO2 = 100%, ORP = +140 mV) B. cereus cultures. The growth curve of Caco-2 cells was measured via the sulforhodamine B method (66). Data are the means of eight different values. Error bars represent S.E. Gray line and open diamond, control; full black line and open circle, aerobic supernatant; dashed black line and closed triangle, low ORP anaerobic supernatant; dotted black line and closed circle, high ORP anaerobic supernatant. All three supernatants contained 1.6 ± 0.1 μg/ml proteins.
Differential Accumulation of Secreted Proteins
Using spectral counts, we investigated the effects of O2 availability and O2-independent ORP on protein accumulation in the extracellular medium. We found that (i) 20 proteins accumulated significantly differently under low ORP (−410 mV) compared with high ORP (−10 mV), and (ii) 41 proteins accumulated significantly differently under fully oxic conditions compared with high ORP conditions (see supplemental Table 4). In most cases, the -fold change values were between 1.5 and 2. These results indicate that ORP and pO2 have only low impacts on the global composition of the B. cereus secretome at the early stage of growth. Table II lists the virulence-related proteins that showed significant variations at least in one condition. Surprisingly, Hbl and Nhe components were not present, indicating that their ORP-dependent variations were not as marked as we reported with the B. cereus F4430/73 strain (32). We further quantified HblL2 and NheA components in B. cereus ATCC 14579 supernatants using immunological tests and measuring mRNA levels by RT-PCR. We found 7.0 ± 0.7, 9.6 ± 0.6, and 6.1 ± 0.3 units·g−1 NheA in low ORP anoxic, high ORP anoxic, and fully oxic conditions, respectively. The concentration of HblL2 was roughly the same whatever the ORP condition (9 ± 4 units·g−1). However, because the oxoid test loses accuracy as serial dilutions are performed, we cannot exclude the existence of more significant variations. Analysis of mRNA levels did not show any significant changes (Table III). Taken together, these data confirmed our proteomics results and suggest that the ORP-dependent effect could be strain-specific. EntC and HlyII are the only toxins listed in Table II. Although HlyII was not detected in the low ORP anoxic condition (see supplemental Table 3), it strongly accumulated in high ORP anoxic and fully oxic conditions. The fully oxic condition favored slightly more secretion of HlyII than the high anoxic condition. The variation of hlyII mRNA level was consistent with the proteomics data (Table III). This indicates that redox-dependent regulation of HlyII secretion may mainly occur at the transcriptional level. The small increase of the EntC level in the fully oxic condition compared with anoxic conditions was not correlated with mRNA level variation. A total of 15 degradative enzymes and adhesins are listed in Table II. Seven of them showed higher specific levels in aerobiosis than in anaerobiosis, and only one accumulated preferentially in the low ORP anoxic condition. This indicates that the low ORP anoxic condition may disfavor degradative enzyme secretion. Finally, the data indicate that virulence-related secretomes of early growth B. cereus cells are strikingly similar under anoxic and oxic conditions and differ only in terms of abundances for some of the proteins.
DISCUSSION
In this report, we present a proteomics study of B. cereus ATCC 14579 analyzing the influence of oxygen and/or extracellular ORP on the composition of the early growing cell secretome in pH-regulated minimal medium. This study considerably expands on the current database of B. cereus sensu stricto secreted proteins by complementing the proteomics analyses reported by Gohar and co-workers (6, 36–38) and by identifying new putative PlcR-independent virulence factors.
The cytotoxicity of B. cereus is thought to be caused by secretion of virulence factors in host media. Our study shows that whatever the pO2 status and ORP conditions the majority of proteins secreted by early growing B. cereus cells are putative virulence factors (Fig. 1). In bacteria, virulence factors are often expressed in a coordinated fashion during the growth cycle. The best characterized regulator of B. cereus virulence factor is the pleiotropic transcriptional regulator PlcR (2, 6). Focusing on the early growth phase studied here, the detection of numerous B. cereus putative virulence factors strongly suggests that regulatory pathways other than the quorum-sensing effector-dependent PlcR regulon are active for their secretion. This hypothesis was also reported for B. anthracis where the PlcR regulon is silenced (2), suggesting that major PlcR-independent regulation of virulence factors may exist in the B. cereus group (50). Of the 57 ORF products identified as potential drivers of B. cereus virulence, 31 were not detected in previous studies based on profiling early stationary phase secretome from LB-grown cells (6, 36–38). Two factors may explain why they were not previously detected: (i) the growth conditions as cells in this study experienced nutrient stress at early growth and not at late growth and (ii) the high resolution mass spectrometer used and the shotgun strategy we developed, which most probably favored the detection of poorly accumulating proteins.
Unlike previous studies, all three components of Nhe cytotoxin were detected in the secretome of B. cereus ATCC 14579. Our spectral count-based semiquantification indicates that NheC probably accumulates in the supernatants in much lower concentrations than NheA and NheB. This is in agreement with literature data reporting that NheC may be more weakly produced than NheA and NheB (14).
Until now, hblB was considered a pseudogene (2, 12). Our results demonstrate that hblB is transcribed, translated, and exported at detectable levels in the early secretome. The fact that (i) hblB is transcribed as a monocistronic gene independently of the PlcR-regulated hblCDA polycistron (6) and (ii) HblB′ could have basically the same function as HblB (encoded by hblA) suggest that HblB′ could complement or reinforce HblB function in a specific stage of growth and/or specific growth conditions. Interestingly, all B. cereus food poisoning strains that contain an hblB-homologous gene contain the hblCDA cistrons, but not all hblCDA-containing strains systematically contain an hblB homolog gene (51). It has yet to be determined whether the hblB product is only an accessory protein or whether it is actively involved in the virulence potential of B. cereus strains.
Our study reports for the first time the presence of EntFM and HlyII in the secretome of B. cereus ATCC 14579. Interestingly, although EntFM was detected in all three conditions tested, HlyII was not detected in low reducing anoxic conditions. This suggests that its expression could be ORP-dependent in anoxic conditions. From a structural point of view, HlyII and EntFM are different. HlyII is a member of the oligomeric β-barrel pore-forming toxin family (which includes CytK (18) and other cytolysins produced by pathogenic bacteria, such as Staphylococcus aureus (52)). EntFM exhibits an NlpC/P60 domain also observed in peptidases with a role in bacterial cell wall maintenance (20). It should be underlined that the gene encoding EntFM is more conserved (∼60% occurrence) than the gene encoding HlyII (∼30% occurrence) whatever the genome studied (pathogenic and nonpathogenic species of B. cereus group), suggesting EntFM may be a more common virulence factor than HlyII.
Three putative enterotoxins, which we propose to name EntA, EntB, and EntC, respectively, were also found secreted by early growth cells cultivated in minimal medium. These three proteins differed in size but shared common domains: two SH3 domains (pfam08239) at their N termini and a 3D domain (pfam06725) at their C termini (Fig. 3). The SH3 domains represent bacterial versions of eukaryotic motifs encountered in many signal transduction proteins (53) and have been found in bacterial enterotoxins, such as the cytotoxic protein EntFM (20). In addition, SH3-containing proteins were shown to be involved in the virulence of several pathogens, such as the peptidoglycan degradative enzyme MltA of Escherichia coli (54), the invasion protein InlB of Listeria monocytogenes (55), and the diphtheria toxin repressor DtxR of Corynebacterium diphtheria (56). The 3D domain contains positively charged residues (with three highly conserved aspartate residues, hence its name). This domain may be responsible for protein anchorage to the cell wall as reported for many surface proteins of Gram-positive bacteria (57). EntA, EntB, and EntC contain a peculiar multidomain named PRK13914. This multidomain was shown to be crucial for L. monocytogenes autolysins in host colonization (58). Interestingly, the genes encoding EntA, EntB, and EntC are highly conserved in the genome of B. cereus group species (occurrence above 90%), including all the currently sequenced B. anthracis strains. Genes encoding these putative enterotoxins do not exhibit PlcR-responsive DNA motifs, suggesting a PlcR-independent regulation of their expression. It is thus tempting to speculate that these toxins could also contribute to the virulence of B. anthracis, which has been reported to be strictly dependent on total abolishment of the expression of PlcR target. These putative enterotoxins constitute new virulence factor candidates that could be crucial in triggering pathogenesis whatever the B. cereus species.
Surprisingly, the pattern of expression of many proteins secreted by early growing cells differs slightly in response to anoxic ORP change and pO2 change (Table II). This result indicates that secretion of most virulence factors is not predominantly regulated in response to redox status and thus by the regulatory pathway involving Fnr and ResDE (31–34). However, expression of hlyII is almost certainly dependent on the redox state of the extracellular medium because we showed that (i) its transcription was ORP-dependent, and (ii) a low ORP medium nearly abolished the secretion of the protein. HlyII has been shown to be negatively regulated by the transcriptional regulator HlyIIR, which is encoded in a locus downstream of HlyII (61, 62). This suggests that specific redox regulation of hlyII expression could be HlyIIR-dependent. However, we can exclude a possible role of the ferric uptake regulator Fur, which was predicted to regulate the production of HlyII but not the other toxins (63). Our results also indicate that secretion of HlyII may increase the cytotoxic potential of B. cereus because (i) HlyII was the sole virulence-related protein secreted in high ORP anoxic and fully oxic conditions but not in the low ORP anoxic condition (see supplemental Table 3), (ii) Caco-2 cells were more sensitive to high anoxic and fully oxic extracellular media than to low anoxic extracellular medium (Fig. 4), and (iii) HlyII has a proven cytotoxic activity (64). Finally, a B. cereus strain carrying hlyII may thus possess a greater virulence potential than a strain lacking this gene. However, if we consider that the low ORP anoxic condition used in this study better mimics the intestinal environment, it appears that HlyII may not be a virulence factor involved in gastrointestinal diseases. This is in agreement with the observation that HlyII has never been implicated as the toxin responsible for an outbreak of food-borne disease (14).
In conclusion, our results bring strong new evidence that B. cereus can produce many virulence factors through low density cells when grown in an environment that is nutrient- and oxygen-limited and pH-regulated, such as that encountered in the human intestine. By comparing three redox conditions, we evidenced that early growth phase-dependent regulation could be predominant in controlling the expression of the most conserved virulence factors, whereas alternative but not mutually exclusive pathways could exert major control over the expression of strain-specific factors. In addition, we bring new evidence that neither the quorum-sensing effector-dependent activation of PlcR nor PlcR itself is sufficient to account for the virulence of B. cereus sensu stricto. Finally, our report shows that B. cereus, like other pathogens (65), can trigger infection from only a small number of cells. This may be critical for intestinal colonization.
Supplementary Material
Acknowledgments
We thank P. Guérin (CEA-Marcoule) for help with mass spectrometry analysis, C. Bruley (CEA-Grenoble) for kindly providing the IRMa 1.21.0 parser, and P. C. Carvalho (COPPE, Rio de Janeiro, Brazil) for the PatternLab software.
 This article contains supplemental Tables 1–4.
1 The abbreviations used are:
- Hbl
- hemolysin BL
- Nhe
- non-hemolytic enterotoxin
- CytK
- cytotoxin K
- ORP
- oxidoreduction potential
- RACE
- rapid amplification of cDNA ends
- DMEM
- Dulbecco's modified Eagle's medium
- FBS
- fetal bovine serum
- SH3
- Src homology 3.
REFERENCES
- 1.Guinebretière M. H., Thompson F. L., Sorokin A., Normand P., Dawyndt P., Ehling-Schulz M., Svensson B., Sanchis V., Nguyen-The C., Heyndrickx M., De Vos P. (2008) Ecological diversification in the Bacillus cereus group. Environ. Microbiol. 10, 851–865 [DOI] [PubMed] [Google Scholar]
- 2.Agaisse H., Gominet M., Okstad O. A., Kolstø A. B., Lereclus D. (1999) PlcR is a pleiotropic regulator of extracellular virulence factor gene expression in Bacillus thuringiensis. Mol. Microbiol. 32, 1043–1053 [DOI] [PubMed] [Google Scholar]
- 3.Slamti L., Lereclus D. (2002) A cell-cell signaling peptide activates the PlcR virulence regulon in bacteria of the Bacillus cereus group. EMBO J. 21, 4550–4559 [DOI] [PMC free article] [PubMed] [Google Scholar]
- 4.Bouillaut L., Perchat S., Arold S., Zorrilla S., Slamti L., Henry C., Gohar M., Declerck N., Lereclus D. (2008) Molecular basis for group-specific activation of the virulence regulator PlcR by PapR heptapeptides. Nucleic Acids Res. 36, 3791–3801 [DOI] [PMC free article] [PubMed] [Google Scholar]
- 5.Ivanova N., Sorokin A., Anderson I., Galleron N., Candelon B., Kapatral V., Bhattacharyya A., Reznik G., Mikhailova N., Lapidus A., Chu L., Mazur M., Goltsman E., Larsen N., D'Souza M., Walunas T., Grechkin Y., Pusch G., Haselkorn R., Fonstein M., Ehrlich S. D., Overbeek R., Kyrpides N. (2003) Genome sequence of Bacillus cereus and comparative analysis with Bacillus anthracis. Nature 423, 87–91 [DOI] [PubMed] [Google Scholar]
- 6.Gohar M., Faegri K., Perchat S., Ravnum S., Økstad O. A., Gominet M., Kolstø A. B., Lereclus D. (2008) The PlcR virulence regulon of Bacillus cereus. PLoS One 3, e2793. [DOI] [PMC free article] [PubMed] [Google Scholar]
- 7.Beecher D. J., Macmillan J. D. (1991) Characterization of the components of hemolysin BL from Bacillus cereus. Infect. Immun. 59, 1778–1784 [DOI] [PMC free article] [PubMed] [Google Scholar]
- 8.Lund T., Granum P. E. (1996) Characterisation of a non-haemolytic enterotoxin complex from Bacillus cereus isolated after a foodborne outbreak. FEMS Microbiol. Lett. 141, 151–156 [DOI] [PubMed] [Google Scholar]
- 9.Lund T., De Buyser M. L., Granum P. E. (2000) A new cytotoxin from Bacillus cereus that may cause necrotic enteritis. Mol. Microbiol. 38, 254–261 [DOI] [PubMed] [Google Scholar]
- 10.Madegowda M., Eswaramoorthy S., Burley S. K., Swaminathan S. (2008) X-ray crystal structure of the B component of Hemolysin BL from Bacillus cereus. Proteins 71, 534–540 [DOI] [PMC free article] [PubMed] [Google Scholar]
- 11.Ryan P. A., Macmillan J. D., Zilinskas B. A. (1997) Molecular cloning and characterization of the genes encoding the L1 and L2 components of hemolysin BL from Bacillus cereus. J. Bacteriol. 179, 2551–2556 [DOI] [PMC free article] [PubMed] [Google Scholar]
- 12.Lindbäck T., Okstad O. A., Rishovd A. L., Kolstø A. B. (1999) Insertional inactivation of hblC encoding the L2 component of Bacillus cereus ATCC 14579 haemolysin BL strongly reduces enterotoxigenic activity, but not the haemolytic activity against human erythrocytes. Microbiology 145, 3139–3146 [DOI] [PubMed] [Google Scholar]
- 13.Okstad O. A., Gominet M., Purnelle B., Rose M., Lereclus D., Kolstø A. B. (1999) Sequence analysis of three Bacillus cereus loci carrying PlcR-regulated genes encoding degradative enzymes and enterotoxin. Microbiology 145, 3129–3138 [DOI] [PubMed] [Google Scholar]
- 14.Stenfors Arnesen L. P., Fagerlund A., Granum P. E. (2008) From soil to gut, Bacillus cereus and its food poisoning toxins. FEMS Microbiol. Rev. 32, 579–606 [DOI] [PubMed] [Google Scholar]
- 15.Lindbäck T., Fagerlund A., Rødland M. S., Granum P. E. (2004) Characterization of the Bacillus cereus Nhe enterotoxin. Microbiology 150, 3959–3967 [DOI] [PubMed] [Google Scholar]
- 16.Fagerlund A., Lindbäck T., Storset A. K., Granum P. E., Hardy S. P. (2008) Bacillus cereus Nhe is a pore-forming toxin with structural and functional properties similar to the ClyA (HlyE, SheA) family of haemolysins, able to induce osmotic lysis in epithelia. Microbiology 154, 693–704 [DOI] [PubMed] [Google Scholar]
- 17.Granum P. E., O'Sullivan K., Lund T. (1999) The sequence of the non-haemolytic enterotoxin operon from Bacillus cereus. FEMS Microbiol. Lett. 177, 225–229 [DOI] [PubMed] [Google Scholar]
- 18.Fagerlund A., Ween O., Lund T., Hardy S. P., Granum P. E. (2004) Genetic and functional analysis of the cytK family of genes in Bacillus cereus. Microbiology 150, 2689–2697 [DOI] [PubMed] [Google Scholar]
- 19.Kreft J., Berger H., Härtlein M., Müller B., Weidinger G., Goebel W. (1983) Cloning and expression in Escherichia coli and Bacillus subtilis of the hemolysin (cereolysin) determinant from Bacillus cereus. J. Bacteriol. 155, 681–689 [DOI] [PMC free article] [PubMed] [Google Scholar]
- 20.Boonchai N., Asano S. I., Bando H., Wiwat C. (2008) Study on cytotoxicity and nucleotide sequences of enterotoxin FM of Bacillus cereus isolated from various food sources. J. Med. Assoc. Thai. 91, 1425–1432 [PubMed] [Google Scholar]
- 21.Fedhila S., Gohar M., Slamti L., Nel P., Lereclus D. (2003) The Bacillus thuringiensis PlcR-regulated gene inhA2 is necessary, but not sufficient, for virulence. J. Bacteriol. 185, 2820–2825 [DOI] [PMC free article] [PubMed] [Google Scholar]
- 22.Kuppe A., Evans L. M., McMillen D. A., Griffith O. H. (1989) Phosphatidylinositol-specific phospholipase C of Bacillus cereus, cloning, sequencing, and relationship to other phospholipases. J. Bacteriol. 171, 6077–6083 [DOI] [PMC free article] [PubMed] [Google Scholar]
- 23.Minnaard J., Lievin-Le Moal V., Coconnier M. H., Servin A. L., Pérez P. F. (2004) Disassembly of F-actin cytoskeleton after interaction of Bacillus cereus with fully differentiated human intestinal Caco-2 cells. Infect. Immun. 72, 3106–3112 [DOI] [PMC free article] [PubMed] [Google Scholar]
- 24.Minnaard J., Delfederico L., Vasseur V., Hollmann A., Rolny I., Semorile L., Pérez P. F. (2007) Virulence of Bacillus cereus, a multivariate analysis. Int. J. Food Microbiol. 116, 197–206 [DOI] [PubMed] [Google Scholar]
- 25.Ghelardi E., Celandroni F., Salvetti S., Beecher D. J., Gominet M., Lereclus D., Wong A. C., Senesi S. (2002) Requirement of flhA for swarming differentiation, flagellin export, and secretion of virulence-associated proteins in Bacillus thuringiensis. J. Bacteriol. 184, 6424–6433 [DOI] [PMC free article] [PubMed] [Google Scholar]
- 26.Deleted in proof
- 27.Guyton A. C. (1977) Basic human physiology, in Normal Function and Mechanisms of Diseases, pp. 408–423, W. B. Saunders Co., Philadelphia [Google Scholar]
- 28.Moriarty-Craige S. E., Jones D. P. (2004) Extracellular thiols and thiol/disulfide redox in metabolism. Annu. Rev. Nutr. 24, 481–509 [DOI] [PubMed] [Google Scholar]
- 29.Fabich A. J., Jones S. A., Chowdhury F. Z., Cernosek A., Anderson A., Smalley D., McHargue J. W., Hightower G. A., Smith J. T., Autieri S. M., Leatham M. P., Lins J. J., Allen R. L., Laux D. C., Cohen P. S., Conway T. (2008) Comparison of carbon nutrition for pathogenic and commensal Escherichia coli strains in the mouse intestine. Infect. Immun. 76, 1143–1152 [DOI] [PMC free article] [PubMed] [Google Scholar]
- 30.Maier R. J. (2003) Availability and use of molecular hydrogen as an energy substrate for Helicobacter species. Microbes Infect. 5, 1159–1163 [DOI] [PubMed] [Google Scholar]
- 31.Zigha A., Rosenfeld E., Schmitt P., Duport C. (2007) The redox regulator Fnr is required for fermentative growth and enterotoxin synthesis in Bacillus cereus F4430/73. J. Bacteriol. 189, 2813–2824 [DOI] [PMC free article] [PubMed] [Google Scholar]
- 32.Duport C., Zigha A., Rosenfeld E., Schmitt P. (2006) Control of enterotoxin gene expression in Bacillus cereus F4430/73 involves the redox-sensitive ResDE signal transduction system. J. Bacteriol. 188, 6640–6651 [DOI] [PMC free article] [PubMed] [Google Scholar]
- 33.Esbelin J., Armengaud J., Zigha A., Duport C. (2009) ResDE-dependent regulation of enterotoxin gene expression in Bacillus cereus, evidence for multiple modes of binding for ResD and interaction with Fnr. J. Bacteriol. 191, 4419–4426 [DOI] [PMC free article] [PubMed] [Google Scholar]
- 34.Esbelin J., Jouanneau Y., Armengaud J., Duport C. (2008) ApoFnr binds as a monomer to promoters regulating the expression of enterotoxin genes of Bacillus cereus. J. Bacteriol. 190, 4242–4251 [DOI] [PMC free article] [PubMed] [Google Scholar]
- 35.Messaoudi K., Clavel T., Schmitt P., Duport C. (2010) Fnr mediates carbohydrate-dependent regulation of catabolic and enterotoxin genes in Bacillus cereus F4430/73. Res. Microbiol. 161, 30–39 [DOI] [PubMed] [Google Scholar]
- 36.Gohar M., Gilois N., Graveline R., Garreau C., Sanchis V., Lereclus D. (2005) A comparative study of Bacillus cereus, Bacillus thuringiensis and Bacillus anthracis extracellular proteomes. Proteomics 5, 3696–3711 [DOI] [PubMed] [Google Scholar]
- 37.Gohar M., Økstad O. A., Gilois N., Sanchis V., Kolstø A. B., Lereclus D. (2002) Two-dimensional electrophoresis analysis of the extracellular proteome of Bacillus cereus reveals the importance of the PlcR regulon. Proteomics 2, 784–791 [DOI] [PubMed] [Google Scholar]
- 38.Gilois N., Ramarao N., Bouillaut L., Perchat S., Aymerich S., Nielsen-Leroux C., Lereclus D., Gohar M. (2007) Growth-related variations in the Bacillus cereus secretome. Proteomics 7, 1719–1728 [DOI] [PubMed] [Google Scholar]
- 39.Armengaud J. (2009) A perfect genome annotation is within reach with the proteomics and genomics alliance. Curr. Opin. Microbiol. 12, 292–300 [DOI] [PubMed] [Google Scholar]
- 40.Liu H., Sadygov R. G., Yates J. R., 3rd (2004) A model for random sampling and estimation of relative protein abundance in shotgun proteomics. Anal. Chem. 76, 4193–4201 [DOI] [PubMed] [Google Scholar]
- 41.Zigha A., Rosenfeld E., Schmitt P., Duport C. (2006) Anaerobic cells of Bacillus cereus F4430/73 respond to low oxidoreduction potential by metabolic readjustments and activation of enterotoxin expression. Arch. Microbiol. 185, 222–233 [DOI] [PubMed] [Google Scholar]
- 42.Zwietering M. H., Jongenburger I., Rombouts F. M., van 't Riet K. (1990) Modeling of the bacterial growth curve. Appl. Environ. Microbiol. 56, 1875–1881 [DOI] [PMC free article] [PubMed] [Google Scholar]
- 43.Duport C., Thomassin S., Bourel G., Schmitt P. (2004) Anaerobiosis and low specific growth rates enhance hemolysin BL production by Bacillus cereus F4430/73. Arch. Microbiol. 182, 90–95 [DOI] [PubMed] [Google Scholar]
- 44.Peterson G. L. (1983) Determination of total protein. Methods Enzymol. 91, 95–119 [DOI] [PubMed] [Google Scholar]
- 45.de Groot A., Dulermo R., Ortet P., Blanchard L., Guérin P., Fernandez B., Vacherie B., Dossat C., Jolivet E., Siguier P., Chandler M., Barakat M., Dedieu A., Barbe V., Heulin T., Sommer S., Achouak W., Armengaud J. (2009) Alliance of Proteomics and Genomics to Unravel the Specificities of Sahara Bacterium Deinococcus deserti. PLoS Genet. 5, e1000434. [DOI] [PMC free article] [PubMed] [Google Scholar]
- 46.Zivanovic Y., Armengaud J., Lagorce A., Leplat C., Guérin P., Dutertre M., Anthouard V., Forterre P., Wincker P., Confalonieri F. (2009) Genome analysis and genome-wide proteomics of Thermococcus gammatolerans, the most radioresistant organism known amongst the Archaea. Genome Biol. 10, R70. [DOI] [PMC free article] [PubMed] [Google Scholar]
- 47.Dupierris V., Masselon C., Court M., Kieffer-Jaquinod S., Bruley C. (2009) A toolbox for validation of mass spectrometry peptides identification and generation of database, IRMa. Bioinformatics 25, 1980–1981 [DOI] [PubMed] [Google Scholar]
- 48.Vizcaíno J. A., Côté R., Reisinger F., Barsnes H., Foster J. M., Rameseder J., Hermjakob H., Martens L. (2010) The proteomics identifications database, 2010 update. Nucleic Acids Res. 38, D736–D742 [DOI] [PMC free article] [PubMed] [Google Scholar]
- 49.Carvalho P. C., Fischer J. S., Chen E. I., Yates J. R., 3rd, Barbosa V. C. (2008) PatternLab for proteomics, a tool for differential shotgun proteomics. BMC Bioinformatics 9, 316. [DOI] [PMC free article] [PubMed] [Google Scholar]
- 50.Walz A., Mujer C. V., Connolly J. P., Alefantis T., Chafin R., Dake C., Whittington J, Kumar S. P., Khan A. S., DelVecchio V. G. (2007) Bacillus anthracis secretome time course under host-simulated conditions and identification of immunogenic proteins. Proteome Sci. 5, 11. [DOI] [PMC free article] [PubMed] [Google Scholar]
- 51.Guinebretière M. H., Broussolle V., Nguyen-The C. (2002) Enterotoxigenic profiles of food-poisoning and food-borne Bacillus cereus strains. J. Clin. Microbiol. 40, 3053–3056 [DOI] [PMC free article] [PubMed] [Google Scholar]
- 52.Gouaux E. (1998) Alpha-Hemolysin from Staphylococcus aureus, an archetype of beta-barrel, channel-forming toxins. J. Struct. Biol. 121, 110–122 [DOI] [PubMed] [Google Scholar]
- 53.Feller S. M., Ren R., Hanafusa H., Baltimore D. (1994) SH2 and SH3 domains as molecular adhesives, the interactions of Crk and Abl. Trends Biochem. Sci. 19, 453–458 [DOI] [PubMed] [Google Scholar]
- 54.van Straaten K. E., Barends T. R., Dijkstra B. W., Thunnissen A. M. (2007) Structure of Escherichia coli Lytic transglycosylase MltA with bound chitohexaose, implications for peptidoglycan binding and cleavage. J. Biol. Chem. 282, 21197–21205 [DOI] [PubMed] [Google Scholar]
- 55.Marino M., Banerjee M., Jonquières R., Cossart P., Ghosh P. (2002) GW domains of the Listeria monocytogenes invasion protein InlB are SH3-like and mediate binding to host ligands. EMBO J. 21, 5623–5634 [DOI] [PMC free article] [PubMed] [Google Scholar]
- 56.Wylie G. P., Rangachari V., Bienkiewicz E. A., Marin V., Bhattacharya N., Love J. F., Murphy J. R., Logan T. M. (2005) Prolylpeptide binding by the prokaryotic SH3-like domain of the diphtheria toxin repressor, a regulatory switch. Biochemistry 44, 40–51 [DOI] [PubMed] [Google Scholar]
- 57.Schneewind O., Fowler A., Faull K. F. (1995) Structure of the cell wall anchor of surface proteins in Staphylococcus aureus. Science 268, 103–106 [DOI] [PubMed] [Google Scholar]
- 58.Lenz L. L., Mohammadi S., Geissler A., Portnoy D. A. (2003) SecA2-dependent secretion of autolytic enzymes promotes Listeria monocytogenes pathogenesis. Proc. Natl. Acad. Sci. U.S.A. 100, 12432–12437 [DOI] [PMC free article] [PubMed] [Google Scholar]
- 59.Mignot T., Mesnage S., Couture-Tosi E., Mock M., Fouet A. (2002) Developmental switch of S-layer protein synthesis in Bacillus anthracis. Mol. Microbiol. 43, 1615–1627 [DOI] [PubMed] [Google Scholar]
- 60.Mignot T., Mock M., Robichon D., Landier A., Lereclus D, Fouet A. (2001) The incompatibility between the PlcR- and AtxA-controlled regulons may have selected a nonsense mutation in Bacillus anthracis. Mol. Microbiol. 42, 1189–1198 [DOI] [PubMed] [Google Scholar]
- 61.Budarina Z. I., Nikitin D. V., Zenkin N., Zakharova M., Semenova E., Shlyapnikov M. G., Rodikova E. A., Masyukova S., Ogarkov O., Baida G. E., Solonin A. S., Severinov K. (2004) A new Bacillus cereus DNA-binding protein, HlyIIR, negatively regulates expression of B. cereus haemolysin II. Microbiology 150, 3691–3701 [DOI] [PubMed] [Google Scholar]
- 62.Ramos J. L., Martínez-Bueno M., Molina-Henares A. J., Terán W., Watanabe K., Zhang X., Gallegos M. T., Brennan R, Tobes R. (2005) The TetR family of transcriptional repressors. Microbiol. Mol. Biol. Rev. 69, 326–356 [DOI] [PMC free article] [PubMed] [Google Scholar]
- 63.Harvie D. R., Ellar D. J. (2005) A ferric dicitrate uptake system is required for the full virulence of Bacillus cereus. Curr. Microbiol. 50, 246–250 [DOI] [PubMed] [Google Scholar]
- 64.Andreeva Z. I., Nesterenko V. F., Yurkov I. S., Budarina Z. I., Sineva E. V., Solonin A. S. (2006) Purification and cytotoxic properties of Bacillus cereus hemolysin II. Protein Expr. Purif. 47, 186–193 [DOI] [PubMed] [Google Scholar]
- 65.Schmid-Hempel P., Frank S. A. (2007) Pathogenesis, virulence, and infective dose. PLoS Pathog. 3, 1372–1373 [DOI] [PMC free article] [PubMed] [Google Scholar]
- 66.Skehan P., Storeng R., Scudiero D., Monks A., McMahon J., Vistica D., Warren J. T., Bokesch H., Kenney S., Boyd M. R. (1990) New colorimetric cytotoxicity assay for anticancer-drug screening. J. Natl. Cancer Inst. 82, 1107–1112 [DOI] [PubMed] [Google Scholar]
- 67.Chitlaru T., Gat O., Gozlan Y., Ariel N., Shafferman A. (2006) Differential proteomic analysis of the Bacillus anthracis secretome, distinct plasmid and chromosome CO2-dependent cross talk mechanisms modulate extracellular proteolytic activities. J. Bacteriol. 188, 3551–3571 [DOI] [PMC free article] [PubMed] [Google Scholar]
Associated Data
This section collects any data citations, data availability statements, or supplementary materials included in this article.