

Abstract
Bioactive proanthocyanidins have been reported to have several beneficial effects on health in relation to metabolic syndrome, type 2 diabetes, and cardiovascular disease. We studied the effect of grape seed proanthocyanidin extract (GSPE) in rats fed a high fat diet (HFD). This is the first study of the effects of flavonoids on the liver proteome of rats suffering from metabolic syndrome. Three groups of rats were fed over a period of 13 weeks either a chow diet (control), an HFD, or a high fat diet supplemented for the last 10 days with GSPE (HFD + GSPE). The liver proteome was fractionated, using a Triton X-114-based two-phase separation, into soluble and membrane protein fractions so that total proteome coverage was considerably improved. The data from isobaric tag for relative and absolute quantitation (iTRAQ)-based nano-LC-MS/MS analysis revealed 90 proteins with a significant (p < 0.05) minimal expression difference of 20% due to metabolic syndrome (HFD versus control) and 75 proteins due to GSPE treatment (HFD + GSPE versus HFD). The same animals have previously been studied (Quesada, H., del Bas, J. M., Pajuelo, D., Díaz, S., Fernandez-Larrea, J., Pinent, M., Arola, L., Salvadó, M. J., and Bladé, C. (2009) Grape seed proanthocyanidins correct dyslipidemia associated with a high-fat diet in rats and repress genes controlling lipogenesis and VLDL assembling in liver. Int. J. Obes. 33, 1007–1012), and GSPE was shown to correct dyslipidemia observed in HFD-fed rats probably through the repression of hepatic lipogenesis. Our data corroborate those findings with an extensive list of proteins describing the induction of hepatic glycogenesis, glycolysis, and fatty acid and triglyceride synthesis in HFD, whereas the opposite pattern was observed to a large extent in GSPE-treated animals. GSPE was shown to have a wider effect than previously thought, and putative targets of GSPE involved in the reversal of the symptoms of metabolic syndrome were revealed. Some of these novel candidate proteins such as GFPT1, CD36, PLAA (phospholipase A2-activating protein), METTL7B, SLC30A1, several G signaling proteins, and the sulfide-metabolizing ETHE1 and SQRDL (sulfide-quinone reductase-like) might be considered as drug targets for the treatment of metabolic syndrome.
An increase in high calorie diets and a sedentary lifestyle are considered the key factors in explaining the epidemic rise in obesity in developed countries (1). Obese patients, especially those with abdominal obesity due to visceral adipose tissue accumulation, run a higher risk of impaired glucose tolerance, which frequently evolves into insulin resistance (2). Obesity and insulin resistance are frequently associated with hypertension, proatherogenic dyslipidemia, chronic inflammation, a prothrombotic state, and recently also fatty liver (3), conditions that together make up what is known as metabolic syndrome and lead to an increased risk of developing cardiovascular disease (CVD)1 and type 2 diabetes (4). Conversely, some dietary patterns and specific food components have been associated with a lower prevalence of obesity, type 2 diabetes, and CVD. In this sense, the traditional Mediterranean diet (characterized by a high fiber content, low glycemic index carbohydrates, unsaturated fats, vitamins, and antioxidant polyphenols) has been linked to a lower incidence of CVD, obesity, and type 2 diabetes (5–8). Moreover, the French population presents a very low prevalence of death due to CVD despite consuming a diet rich in saturated fats and cholesterol. This phenomenon, known as “the French paradox” (9), has been ascribed to the moderate consumption of red wine and specifically to its content of polyphenols (10–12).
Polyphenols include flavonoids of which flavan-3-ols and their oligomeric forms (proanthocyanidins) have been reported to exhibit several beneficial health effects by acting as antioxidant, anticarcinogen, cardioprotective, antimicrobial, antiviral, and neuroprotective agents (for a review, see Ref. 13). Specifically, grape and wine proanthocyanidins have a cardioprotective effect through increasing plasma high density lipoprotein cholesterol, decreasing low density lipoprotein-derived atherosclerotic foam cell lesions, attenuating oxidant formation by quenching harmful radicals, increasing endothelium-dependent vasorelaxation, etc. (13). In this context, our group has been working for years on the effect of a grape seed proanthocyanidin extract (GSPE) (containing monomers and oligomers of flavan-3-ols) in relation to metabolic syndrome. In previous works, we have found that GSPE prevents oxidative injury (14), has an insulinomimetic effect on adipocytes and adipose tissue (15), modulates glucose homeostasis (16), decreases plasma levels of triglycerides (TGs) and apolipoprotein B in normolipidemic rats (17), and acts as an in vitro (18, 19) and in vivo (20) anti-inflammatory. We have also shown that GSPE decreases postprandial plasma TG and apolipoprotein B in mice through a hepatic induction of a farnesoid X receptor (FXR) and the small heterodimer partner (SHP) that in turn down-regulates SREBP1c and other lipogenic genes in the liver (21, 22). Furthermore, we have demonstrated that the molecules responsible for the reduced TG synthesis in HepG2 cells treated with GSPE are the sum of a proanthocyanidins trimer and a dimer gallate because they reproduce the GSPE effect (23).
The effect of GSPE on metabolic syndrome has been studied in our laboratory by feeding rats a “cafeteria diet.” This diet is an experimental model of a western high sugar and high fat diet extensively used to produce obesity in rats because its palatability induces the animals to increase their energy intake (24). In a recent study conducted by our group (25) as well as this study, the rats were fed a high fat diet (HFD) (cafeteria diet) for 13 weeks, and one group of the animals was treated with a daily dose of GSPE (25 mg/kg of body weight) for the last 10 days (HFD + GSPE). In that study, HFD was shown to cause the animals to be overweight and to suffer from fatty liver, dyslipidemia, and hepatic overexpression of key genes involved in lipogenesis and VLDL assembly, whereas GSPE treatment corrected dyslipidemia and down-regulated some of the genes up-regulated by HFD (25).
To better investigate the mechanism behind the changes observed in HFD- and HFD + GSPE-fed rats, we analyzed protein expression in the liver. Because GSPE treatment and obesity have multiple effects, a proteome-wide approach is needed to map proteins from different pathways. Proteomics studies related to obesity, metabolic syndrome, fatty liver, or insulin resistance have previously been performed on the liver (26–32). Two such studies looked into the effects of flavonoids in mouse livers (33, 34), but to our knowledge, this is the first hepatic proteome analysis of the effect of flavonoids in rats suffering from metabolic syndrome. To improve the proteome coverage of the complex liver samples, we performed a proteome fractionation according to protein solubility using a two-phase detergent protocol (35). This strategy was advantageous because it captured membrane proteins that otherwise would have been difficult to detect. The resulting soluble and membrane protein fractions were digested, iTRAQ-labeled, fractionated according to isoelectric point, and analyzed by nano-LC-MS/MS. The proteomics study presented here reports a differential expression due to HFD or HFD + GSPE for approximately 140 proteins, indicating that both conditions were potent modifiers of the liver proteome. We have focused on the sugar and lipid metabolism data, which confirmed the repression of hepatic lipogenesis in HFD + GSPE rats. Additionally, new proteins have been revealed as putative GSPE targets.
EXPERIMENTAL PROCEDURES
Animal Treatment
Wistar female rats weighing about 150 g were purchased from Charles River Laboratories (Barcelona, Spain) and housed in animal quarters at 22 °C with a 12-h light/dark cycle. All rats were fed a standard chow diet (Panlab A03, Cornellà, Spain) for 1 week and then separated into three groups. Six control (C) rats continued to receive a standard chow diet and water, whereas 12 animals also had ad libitum access to fresh daily renewed cafeteria diet as an HFD model. The cafeteria diet had 13.6% fat, 21% carbohydrates, 9% protein, 51.3% water, and 5.1% others (36) and consisted of bacon, sweets, biscuits with foie gras, cheese, muffins, carrots, and milk with sugar. After 13 weeks of metabolic syndrome induction, the 12 rats on the HFD were divided into two groups of six rats. One group (HFD + GSPE) received an oral daily dose of 25 mg of GSPE/kg of body weight dissolved in condensed milk as a vehicle, whereas the other group (HFD) received only the equivalent amount of vehicle. GSPE contains monomers and oligomers of flavan-3-ols. After 10 days of treatment, C, HFD, and HFD + GSPE rats were sacrificed. On the day of sacrifice, the rats received the daily dose of the vehicle (HFD group) or GSPE (HFD + GSPE group) and had access to fresh cafeteria diet for 2 h. Afterward, food was withdrawn from all three groups, and after 3 h of fasting, the animals were sacrificed by beheading. The livers were excised, frozen immediately in liquid nitrogen, and stored at −80 °C until analysis. All the procedures were approved by the Experimental Animals Ethics Committee of the Rovira i Virgili University.
Proteome Fractionation
A new protocol based on Moebius et al. (37) was tried with test rat liver samples to set up the proteome fractionation procedure into soluble and membrane protein fractions. Once the protocol was established, each of the 18 experimental samples was processed separately. Rat liver tissue was homogenized with a Potter-Elvehjem grinder, sonicated three times for 10 s, and briefly centrifuged to remove tissue particles and cell debris. The supernatant was ultracentrifuged (120,000 × g, 60 min, 4 °C) to separate the membranes from the new supernatant (soluble proteins (S)). The membrane pellet was washed in sodium carbonate buffer according to Fujiki et al. (38) to remove contaminant soluble proteins and ultracentrifuged again. The new membrane pellet was further purified by dissolving it in Triton X-114 buffer and separating the proteins into two phases according to Bordier (35). The detergent phase mostly contained membrane proteins (M) and was further analyzed.
Protein Digestion
The proteins in S and M fractions were precipitated with trichloroacetic acid and acetone, respectively, to concentrate and purify the protein sample. The pellet was resuspended in dissolution buffer (0.5 m triethylammonium bicarbonate, pH 8.5 and 0.1% SDS) or dissolution buffer plus 0.1% Triton X-100 for S and M pellets, respectively. Disulfide bridges in proteins were reduced, cysteine residues were blocked, and proteins were digested overnight with trypsin following the manufacturer's instructions included with the iTRAQ reagent kit (Applied Biosystems, Foster City, CA).
Peptide Labeling and Fractionation
The labeling procedure was performed three times corresponding to biological triplicates for each S and M fraction. Two samples of each group were pooled (50 μg of peptides each), and each of the resulting 100-μg peptide samples was labeled with a different iTRAQ reagent in accordance with the manufacturer's instructions (Applied Biosystems). The subsequent analytical steps were essentially performed as described previously (39). Briefly, labeled peptides were mixed and purified through a strong cation exchange chromatography column followed by elution with a volatile buffer containing 5% ammonia and 30% methanol. Pure peptides were dried and resuspended in denaturing buffer. The peptides were separated on an Immobiline DryStrip gel (GE Healthcare) using isoelectric focusing on a Multiphor II unit (GE Healthcare). The pH range was 3.5–4.5 for S peptides and 3–10 for M peptides because initial experiments showed that these ranges give somewhat increased numbers of detected proteins in the respective samples. The gel strip was cut into 12 pieces, and the peptides were extracted from the gel in two steps with 0.5% TFA in 5% ACN. Peptides were vacuum-dried and redissolved in 0.5% TFA in 5% ACN. Peptides were purified on PepClean C18 spin columns (Pierce) according to the manufacturer's protocol prior to nano-LC analysis.
Nano-LC and MS Analysis
The peptide mixtures were analyzed by liquid chromatography (Easy nLC from Proxeon, Odense, Denmark) coupled to mass spectrometry (LTQ-Orbitrap, Thermo Fisher Scientific, Waltham, MA) through a nanoelectrospray source with a stainless steel emitter (Proxeon). The peptides were separated on a 75-μm reverse phase column packed with 3.5-μm Kromasil C18 particles (Eka Chemicals, Bohus, Sweden) using a 100-min gradient of ACN in 0.4% acetic acid, starting with 5% and ending with 35% ACN. The mass spectrometry detection constituted a full scan (m/z 400–2000) with Orbitrap detection at resolution R = 60,000 (at m/z 400) followed by up to four data-dependent MS/MS scans with LTQ detection of the most intense ions. Dynamic exclusion of 25 s was used as well as rejection of charge state 1+. Pulsed Q dissociation fragmentation was performed with an ion accumulation time of 140 ms, a target value of automatic gain control of 40,000, one microscan, an activation time of 0.1 s, an activation Q of 0.7, and a normalized collision energy of 33.
Database Searches and Statistics
The raw data files containing the MS spectra were processed using extract_msn.exe from February 15, 2005 (Thermo Fischer Scientific) to generate peak lists of the tandem spectra. The processed data were searched with Mascot, version 2.2.04 (Matrix Science, London, UK), which was used for protein identification and iTRAQ reporter quantification. The raw files in each study from the 12 different fractions of peptides analyzed in duplicate by nano-LC-MS/MS were merged together and searched against the NCBI non-redundant database for the taxonomy Rattus containing 68,505 sequences (released September 11, 2008) using the Mascot multidimensional protein identification technology (MudPIT) scoring algorithm. Full-scan tolerance was 5 ppm, MS/MS tolerance was 0.75 Da, and up to two missed trypsin cleavages were accepted. Protein modifications were taken from the iTRAQ protocol of the manufacturer: 1) fixed modifications were iTRAQ label on lysine and the N terminus and methylthio modification of cysteines, and 2) variable modifications were oxidation of methionine and iTRAQ label on tyrosine. The threshold of protein identification significance was set to 0.001, which resulted in a false discovery frequency of 0.0009 when searched against a decoy database generated in Mascot. iTRAQ values were reported for proteins with four or more measured iTRAQ values where each peptide should have an expectation value of 0.02 or below. When identification of a protein in an analysis yielded several possible protein isoforms, all of them were considered for quantification. In the quantitative calculations, only protein isoforms with iTRAQ values in all three analyses were included. For each protein, the relative expression levels were calculated as a ratio between the sample and the average of all three samples in the same analysis. Mean and S.E. values of the three biological replicates were calculated. A two-tailed student's t test for equal variance data was applied with the criterion of p < 0.05. In addition, a threshold test was applied, requiring at least 20% difference (corresponding to ∼2× median global standard error), to filter out alterations with a putative low biological impact and to further reduce the risk of false positives.
Mapping of gene name and Swiss-Prot codes from NCBI gi identifiers was done through the protein cross-reference file for International Protein Index rat release 3.61 and the protein knowledgebase (UniProtKB) ID mapping tool. The classification of differentially expressed proteins was performed manually according to the protein information in the protein knowledgebase (UniProtKB) and literature searches. Gene ontology (GO) data were retrieved from the downloaded Gene Association File for Rat (released October 8, 2009).
Hierarchical clustering of protein expression data to investigate overall similarities of the proteome samples was performed in Cluster 3.0 (40). Proteins that were statistically significant in at least one of the pairwise comparisons, HFD versus HFD + GSPE, HFD versus C, or C versus HFD + GSPE, were included. The data on a logarithmic scale were clustered using the similarity metric “correlation uncentered” and the clustering method “average linkage.” The clusters were viewed in Java Treeview (40, 41).
RESULTS
Analysis of Rat Liver Proteome Fractionated According to Hydrophobicity
The aim of this study was to gain insight into the proteome in relation to the liver, including sugar and lipid metabolism as well as various membrane-associated transport and signaling pathways. Protein extracts from rat liver cells were therefore fractionated into two fractions: the M fraction containing hydrophobic proteins associated with the various membranes in the cell and the S fraction containing water-soluble proteins. This sample fractionation was used to prevent low abundance proteins from being masked by high abundance proteins. The fractionation strategy was performed using a combination of ultracentrifugation of membranes and two-phase separation based on the detergent Triton X-114. The effect of fractionation on the number of proteins detected was assessed in an initial study. The sum of the number of proteins from the two fractionated samples was more than 2 times higher than the number of proteins from the unfractionated sample (data not shown). Of the additional proteins detected as a result of fractionation, ∼35% originated from the S fraction, and 65% originated from the M fraction, emphasizing the value of isolating the M fraction in particular. Furthermore, the solubility problem of membrane proteins was minimized by cleaving the proteins into peptides, which were subsequently analyzed by nano-LC-MS/MS for identification and relative quantification. Using this proteomics approach, more than 1850 protein hits, with high quality quantification data, were obtained. All the quantified proteins are listed in supplemental Table S1, whereas proteomics data, including peptide data, from the two fractions can be found at the Proteomics Identifications database, PRIDE (42) (http://www.ebi.ac.uk/pride/, accession numbers 11674 and 11675). To further assess the fractionation efficiency, we looked at the overlap of the S and M fractions. When not taking protein isoforms into account, a total of 1131 gene products were detected: 607 from S and 449 from M fractions and only 75 detected in both fractions. That means that only 11% of proteins in the S fraction and 14% of proteins in the M fraction were also present in the other fraction, showing that the fractionation method used was efficient.
To further evaluate the fractionation of membrane proteins, we compared the percentage of known membrane proteins in the two protein fractions. Proteins assigned with the GO term “integral membrane protein” (GO:0016021) were found to be highly enriched in the membrane fraction with 34% of all annotated proteins compared with the soluble fraction with less than 1%. Thus, the applied strategy using ultracentrifugation, washing of the pellet, and two-phase separation followed by peptide-based proteomics proved to be suitable for the isolation and detection of membrane proteins, which due to low abundance and solubility problems are otherwise hard to detect.
Differential Protein Expression
A high fat diet and treatment by GSPE strongly influence obesity-related changes of the liver function. To study their effects on the liver proteome, we applied proteomics on three groups of rats: a C group fed a standard chow diet, rats fed an HFD, and rats fed a high fat diet combined with GSPE treatment (HFD + GSPE). Protein abundance data from the two proteome fractions were analyzed to filter out proteins with statistically significant (p < 0.05) altered levels as a function of metabolic syndrome (HFD versus C) and GSPE treatment (HFD versus HFD + GSPE). More than 140 of these proteins exhibited differences in abundance exceeding 20% in at least one of the comparisons. These proteins were manually classified according to similar involvement in metabolism or biological process and are presented in supplemental Table S2 under the following categories: sugar metabolism, lipid metabolism, nitrogen metabolism, detoxification and oxidative stress protection, cytoskeletal proteins, G protein signaling and cell dynamics, transporters, nucleic acid binding, protein binding or modification, miscellaneous, and uncharacterized proteins. Table I contains proteins classified into the categories of sugar and lipid metabolisms, which are of particular interest in this study on metabolic syndrome in rats, and Fig. 1 graphically shows the expression changes of most of these proteins. Table II contains proteins from other categories exhibiting statistical alterations of a higher magnitude (>50%). These proteins contribute to providing the full spectrum of physiological effects, and some of them are novel putative hallmarks of the effects of obesity and GSPE. The effects of HFD and GSPE treatment are described in the following sections.
Table I. Proteins of sugar and lipid metabolism with altered expression due to HFD and/or HFD + GSPE.
Shown is the list of proteins involved in sugar and lipid metabolism with a significant (t test; p < 0.05) 20% or more difference in relative abundance between C rats and rats that consumed an HFD and/or between HFD rats and treated rats (HFD + GSPE) that consumed a high fat diet plus 25 mg of GSPE/kg of body weight for 10 days. The protein relative abundance ratios, HFD/C and HFD/(HFD + GSPE), were calculated from the averages of three biological replicates (each from a pool of two animals) from each sample group. Only proteins with quantitative signal from four of more MS scans were included. HFD/C and HFD/(HFD + GSPE) ratios are shown for a better comparison of the correction effect of GSPE; i.e. similar values in the two columns indicate similarity between C and GSPE-treated samples.
| gi number | UniProt code | Gene name | S/M fraction | Function or biological process | HFD/C | HFD/HFD + GSPE | |
|---|---|---|---|---|---|---|---|
| Sugar metabolism | |||||||
| UDP-glucose pyrophosphorylase 2 | gi|67078526 | Q4V8I9 | Ugp2 | S | Glycogen synthesis | 1.28a | 1.25 |
| Glucan (1,4-α-), branching enzyme 1 | gi|109492774 | ENSRNOP00000039448 | Gbe1 | S | Glycogen synthesis | 1.21a | 0.95 |
| Galactokinase 1 | gi|56605662 | Q5RKH2 | Galk1 | S | Sugar metabolism | 1.57a | 0.98 |
| Glucokinase regulatory protein | gi|6978884 | Q07071 | Gckr | S | Sugar metabolism | 1.29a | 0.99 |
| Pyruvate kinase | gi|185134818 | B1WBN9 | Pklr | S | Glycolysis | 1.42a | 1.34a |
| Phosphoenolpyruvate carboxykinase 2 (mitochondrial) | gi|189163483 | B2RYG2 | Pck2 | S | Gluconeogenesis | 0.66 | 0.64a |
| Glutamic-pyruvate transaminase | gi|13591961 | P25409 | Gpt | S | Gluconeogenesis, amino acid degradation | 0.47a | 0.99 |
| Lactate dehydrogenase A | gi|8393706 | P04642 | Ldha | S | Anaerobic glycolysis | 1.26a | 1.05 |
| Glutamine fructose-6-phosphate transaminase 1 | gi|54400724 | P82808 | Gfpt1 | S | Hexosamine pathway and protein glycosylation | 0.51a | 0.63a |
| Mitochondrial protein 18 kDa | gi|55741522 | Q5XIG9 | Mtp18 | M | Carbon utilization | 0.93 | 1.61a |
| Cytochrome c oxidase subunit II | gi|110189718 | Q8SEZ5 | mt-Co3 | M | Respiratory chain | 1.26a | 1.03 |
| Cytochrome c-type heme-lyase | gi|109510612 | ENSRNOP00000034552 | Hccs | M | Respiratory chain | 2.15a | 2.54 |
| Lipid metabolism | |||||||
| ATP-citrate lyase isoform 1 | gi|162287306 | P16638 | Acly | S | Lipid synthesis | 1.41a | 1.74a |
| Acetyl-coenzyme A carboxylase α | gi|11559962 | P11497 | Acaca | S | Lipid synthesis | 1.15 | 1.35a |
| Fatty-acid synthase | gi|2506136 | P12785 | Fasn | S | Lipid synthesis | 1.50a | 1.75a |
| Glycerol-3-phosphate dehydrogenase 1 | gi|109484025 | Gpd1l | S | Lipid synthesis | 1.51a | 1.48a | |
| Malic enzyme 1 | gi|158341689 | ENSRNOP00000013244 | Me1 | S | Lipid synthesis | 1.19 | 1.67a |
| Glucose-6-phosphate dehydrogenase | gi|8393381 | P05370 | G6pd | S | Pentose phosphate pathway | 1.07 | 1.44a |
| Transaldolase 1 | gi|42476292 | Q9EQS0 | Taldo1 | S | Pentose phosphate pathway | 1.53a | 1.37 |
| 6-Phosphogluconate dehydrogenase, decarboxylating | gi|149024656 | P85968 | Pgd | S | Pentose phosphate pathway | 1.08 | 1.45a |
| Butyryl-coenzyme A synthetase 1 protein | gi|197245828 | B5DFA3 | Bucs1 | S | Fatty acid activation | 1.34a | 1.22a |
| Acyl-coenzyme A thioesterase 2, mitochondrial | gi|6166586 | O55171 | Acot2 | S | Acyl-CoA metabolic process | 1.34a | 1.39a |
| Carnitine palmitoyltransferase 2 | gi|134104110 | Cpt2 | S | FA oxidation | 1.38 | 1.68a | |
| Acyl-coenzyme A dehydrogenase, short chain | gi|11968090 | P15651 | Acads | S | Mitochondrial FA β-oxidation | 1.17 | 1.28a |
| Acyl-coenzyme A dehydrogenase, long chain | gi|6978431 | P15650 | Acadl | S | Mitochondrial FA β-oxidation | 0.91 | 0.75a |
| 2,4-Dienoyl-CoA reductase 1, mitochondrial | gi|17105350 | Q64591 | Decr1 | M | Mitochondrial FA β-oxidation | 1.16 | 1.36a |
| Acyl-coenzyme A oxidase 1, palmitoyl | gi|8394149 | P07872-1 | Acox1 | S | Peroxisomal FA β-oxidation. | 0.45a | 0.77 |
| Mannose-6-phosphate protein p76 | gi|158341628 | Q4QQW8 | Plbd2 | S | Lipid degradation | 0.68a | 0.56 |
| CD36 antigen | gi|146345388 | Q07969 | Cd36 | M | Multiple functions including FA oxidation and transport | 0.87 | 1.21a |
| START domain-containing 10 | gi|149068738 | Q5BJN1 | Stard10 | S | Lipid metabolism | 1.05 | 1.62a |
| FABP-II (fatty acid-binding protein) | gi|404382 | M | Intracellular lipid transport | 0.71 | 0.68a | ||
| Carboxylesterase | gi|5732982 | P16303 | Ces3 | S | Lipid metabolism | 1.95a | 1.24 |
| Methyltransferase-like 7B | gi|66730429 | Q562C4 | Mettl7b | M | Found in fatty liver | 1.05 | 1.53a |
| Transmembrane 7 superfamily member 2 | gi|61556857 | Q5BK21 | Tm7sf2 | M | Cholesterol synthesis | 0.80 | 1.66a |
a A value with a statistically significant difference (p < 0.05), of at least a factor of 1.2, between HFD and C abundance or between HFD and HFD + GSPE abundance values.
Fig. 1.

Altered expression of proteins related to sugar and lipid metabolism in liver of HFD- and HFD + GSPE-fed rats. A shows changes in the expression of proteins involved in sugar and lipid metabolisms in the livers of rats fed an HFD versus control rats. B shows changes in rats fed HFD + GSPE (10 days of 25 mg of GSPE/kg of body weight) versus HFD-fed rats. Black circles mean up-regulation and white circles mean down-regulation of protein expression. GALK1, galactokinase 1; LC, long chain; SMC, short and medium chain; P, phosphate.
Table II. Proteins with at least 50% altered expression due to HFD and/or HFD + GSPE.
Shown is the list of proteins with a significant (t test; p < 0.05) and at least 50% altered abundance in the comparison of HFD versus C and/or of HFD versus HFD + GSPE. For sample descriptions, see Table I. Proteins have been grouped according to their involvement in similar metabolism or biological process. Sugar and lipid metabolism-related proteins are not included. MHC, major histocompatibility complex.
| gi number | UniProt code | Gene name | S/M fraction | Function or biological process | HFD/C | HFD/HFD + GSPE | |
|---|---|---|---|---|---|---|---|
| Nitrogen metabolism | |||||||
| Solute carrier family 38, member 3 | gi|21955257 | Q9JHZ9 | Slc38a3 | M | Sodium-dependent amino acid/proton antiport | 0.56a | 0.68a |
| Detoxification and oxidative stress protection | |||||||
| Sulfide-quinone reductase-like (yeast) | gi|149023155 | B0BMT9 | Sqrdl | M | Sulfur metabolism | 0.65a | 0.53 |
| Ethylmalonic encephalopathy 1 | gi|157819563 | B0BNJ4 | Ethe1 | S | Sulfur metabolism | 0.62a | 0.83 |
| S-Glutathiolated carbonic anhydrase III | gi|157875870 | P14141 | Ca3 | S | Hydration of carbon dioxide, response to oxidative stress | 0.94 | 0.62a |
| Cytoskeletal proteins | S | ||||||
| Myosin light chain, regulatory B | gi|8393781 | P18666 | Myl12b | S | Motor protein | 1.63a | 1.52a |
| Destrin | gi|75991707 | Q7M0E3 | Dstn | S | Actin depolymerization | 1.51a | 1.10 |
| Coronin, actin-binding protein, 1B | gi|149061951 | O89046 | Coro1b | S | Actin binding | 1.08 | 1.57a |
| Regulator of microtubule dynamics protein 2 | gi|81295355 | Q498D5 | Fam82a | M | Interaction with microtubules | 1.92a | 1.32a |
| Bifunctional and Golgi-associated formiminotransferase cyclodeaminase octamer | gi|71041625 | M | Cytoskeleton | 1.10 | 1.61a | ||
| Integrin α1 | gi|149059384 | P18614 | Itga1 | M | Receptor for laminin and collagen | 0.82 | 0.65a |
| G protein signaling and cell dynamics | |||||||
| RAB2B | gi|83415090 | Q3B7V5 | Rab2b | M | Signaling, membrane traffic, protein transport | 1.89a | 1.29 |
| RhoA | gi|2225894 | O35791 | Rhoa | S | Signaling, cytoskeleton | 1.40 | 2.49a |
| Ras homolog gene family, member B (Homo sapiens) | gi|4757764 | P62745 or B2R692 | RHOB | S | Angiogenesis, apoptosis, cell adhesion, differentiation, protein transport | 1.38 | 2.56a |
| Synembryn-A | gi|97181289 | Q80ZG1 | Ric8a | S | Signaling, mitosis | 1.45 | 1.67a |
| RAB21 | gi|51948448 | Q6AXT5 | Rab21 | M | Cell adhesion and migration | 0.73 | 0.66a |
| Transporters | |||||||
| Solute carrier organic anion transporter family, member 1a4 | gi|18777755 | O35913 | Slco1a4 | M | Organic anion transport | 0.56a | 0.92 |
| Solute carrier family 30, member 1 | gi|12408302 | Q62720 | Slc30a1 | M | Zinc transport | 1.06 | 1.54a |
| Translocase of inner mitochondrial membrane 44 | gi|8394449 | O35094 | Timm44 | S | Mitochondrial protein translocation | 0.69 | 0.64a |
| Ribosome-binding protein 1 | gi|109468922 | XP_230637 | Rrbp1 | S | Protein translocation | 0.66 | 0.65a |
| Nucleic acid binding | |||||||
| Heterogeneous nuclear ribonucleoprotein K isoform a (H. sapiens) | gi|14165437 | P61978 or Q6IBN1 | HNRNPK or HNRPK | S | Host-virus interaction, mRNA processing | 1.53a | 1.12 |
| Heterogeneous nuclear ribonucleoprotein A2 | gi|157059859 | A7VJC2 | Hnrnpa2b1 | S | mRNA processing | 0.58a | 0.70a |
| Ribosomal protein L32 (H. sapiens) | gi|4506635 | P62910 or B2R4Q3 | RPL32 | M | Translation | 1.87a | 1.24 |
| Ribosomal protein L10 | gi|62664113 | M | Translation, transcription regulation | 1.62a | 1.24 | ||
| 3-Hydroxyacyl-CoA dehydrogenase type 2 | gi|7387724 | O70351 | Hsd17b10 | M | Mitochondrial tRNA maturation | 1.43a | 1.85a |
| Carbamyl-phosphatate synthetase 2 | gi|149050765 | cad | S | Pyrimidine biosynthesis | 0.52a | 0.76 | |
| Protein binding or modification | |||||||
| Protein kinase C substrate 80K-H | gi|157818781 | B1WC34_RAT | Prkcsh | S | Protein binding | 1.62a | 0.94 |
| Protein phosphatase 2 | gi|149041647 | Q4QQT4 | Ppp2r1b | S | Protein phosphatase | 1.51a | 0.99 |
| Alanyl (membrane) aminopeptidase | gi|149057276 | P15684 | Anpep | M | Proteolysis, angiogenesis, differentiation | 0.73a | 0.63 |
| Miscellaneous | |||||||
| Ab2-079 | gi|33086530 | Q7TP70 | M | Carotene metabolic process | 1.16 | 1.62a | |
| Haloacid dehalogenase-like hydrolase | gi|157824168 | B2RYT7 | Hdhd3 | S | 0.58a | 0.72 | |
| Dihydroxyacetone kinase 2 homolog | gi|84781664 | Q4KLZ6 | Dak | S | Glycerol metabolic process, splitting of ribonucleoside diphosphate-X compounds | 1.56a | 1.41a |
| β-Globin minor | gi|164448680 | P11517 | Hbb2 | S | Oxygen transport | 0.59a | 0.86 |
| Hemoglobin subunit β-2 | gi|55825 | P11517 | Hbb2 | S | Oxygen transport | 0.56a | 0.82 |
| Zero β-globin | gi|802111 | Q63011 | MGC72973 | S | Oxygen transport | 0.51a | 0.68 |
| Hemoglobin α1 chain | gi|6981010 | P01946 | Hba1 | M | Oxygen transport | 0.65a | 0.60a |
| Hemoglobin α2 chain | gi|60678292 | P01946 | Hba1 | M | Oxygen transport | 0.67a | 0.55a |
| MHC class Ib antigen | gi|27805185 | Q861J1 | RT1-CE5 | M | Antigen presentation | 1.19 | 1.65a |
| Complement component 9 | gi|16924006 | Q62930 | C9 | S | Complement pathway | 1.51a | 0.82 |
| Uncharacterized proteins | |||||||
| rCG62519 | gi|149048094 | S | Predicted from sequence, “trans-isoprenyl diphosphate synthases” | 0.65a | 0.94 | ||
| rCG59263 | gi|149017560 | M | Predicted from sequence, “synthesis of cytochrome c oxidase family” | 0.58a | 0.69 |
a A value with a statistically significant difference (p < 0.05), of at least a factor of 1.2, between HFD and C abundance or between HFD and HFD + GSPE abundance values.
Effects of High Fat Diet on Rat Liver Proteome
A high fat diet changed the expression of 90 proteins, with at least 20% change and p < 0.05, versus the control group (supplemental Table S2). As shown in Table I and Fig. 1A, several proteins involved in sugar metabolism were altered in HFD-fed rats. Two proteins involved in glycogen synthesis were up-regulated, UDP-glucose pyrophosphorylase 2 (UGP2) and glucan (1,4-α-), branching enzyme 1 (GBE1), which along with the increase in one of the glycolysis regulatory enzymes, pyruvate kinase (PKLR), point to surplus sugar metabolism. Glycolysis induction in HFD-fed rats was consistent with the observed down-regulation, although not significant, of one of the gluconeogenesis-regulating proteins, phosphoenolpyruvate carboxykinase 2 (PCK2). In support of this repression, the gluconeogenic enzyme responsible for the transformation of alanine into pyruvate, glutamic-pyruvate transaminase, was repressed more than 2-fold in HFD-fed rats. Two proteins related to the respiratory chain were induced in HFD-fed rats: the component of the respiratory chain that catalyzes the reduction of oxygen to water, cytochrome c oxidase subunit II (MT-CO3), and the protein that catalyzes the covalent attachment of heme to apocytochrome c and c1, cytochrome c-type heme-lyase (HCCS). Taken together, these results suggest that HFD induces glycogenesis, glycolysis, and the respiratory chain in the liver (Fig. 1A).
As expected, the levels of proteins involved in lipid metabolism were found to be altered in HFD-fed rats (Table I and Fig. 1A). Two of the enzymes involved in de novo FA synthesis, ATP-citrate lyase isoform 1 (ACLY) and fatty-acid synthase (FASN), increased more than 40% together with a 53% increase in one enzyme of the pentose phosphate pathway that generates NADPH for lipogenesis, transaldolase 1 (TALDO1). Furthermore, glycerol-3-phosphate dehydrogenase 1 (GPD1L), which, in addition to transferring reducing equivalents from cytosolic NADH to mitochondrial FADH2, provides activated glycerol backbone for TG synthesis, was up-regulated by 51%. We also detected a 34% significant induction in HFD-fed rats of two enzymes involved in the control of acyl-CoAs in the cell: mitochondrial acyl-CoA thioesterase 2 (ACOT2) and butyryl-CoA synthetase 1 protein (BUCS1). ACOT2 catalyzes the hydrolysis of acyl-CoAs to the free FA and CoA (43), whereas BUCS1 is a mitochondrial medium chain acyl-CoA synthetase that activates 4–12-carbon atom FAs, adding CoA to them (for a review, see Ref. 44). On the other hand, two proteins related to lipid degradation were down-regulated in HFD-fed rats: the enzyme that desaturates very long chain acyl-CoAs in peroxisomal FA β-oxidation, palmitoyl acyl-CoA oxidase 1 (ACOX1), and a putative phospholipase B involved in lysosomal lipid degradation, mannose 6-phosphate protein p76 (PLBD2), showed a clear repression due to HFD (more than a 2- and 1.5-fold change, respectively). Carboxylesterase (CES3), which is involved in the metabolism of xenobiotics but also catalyzes several lipid metabolism reactions such as monoacylglycerol and triglycerol hydrolysis (45, 46), showed an almost doubled induction in HFD. These results suggest an increased lipogenesis and decreased lipid catabolism in HFD-fed rats (Fig. 1A).
In addition to proteins related to sugar and lipid metabolisms, other processes were also clearly altered by HFD (Table II). Some cytoskeletal proteins such as myosin light chain regulatory B (MYL12B), destrin, and regulator of microtubule dynamics protein 2 (FAM82A) were strongly up-regulated by HFD (between a 1.5- and 2-fold increase). Interestingly, two enzymes involved in hydrogen sulfide (H2S) detoxification, sulfide-quinone reductase-like (SQRDL) and ethylmalonic encephalopathy 1 (ETHE1) (47, 48), were down-regulated more than 50% in HFD-fed rats with possible effects on cardiovascular health due to H2S properties as an antioxidant and vasodilative (for a review, see Ref. 49). An enzyme related to inflammation (50), phospholipase A2-activating protein (PLAA), was also affected by HFD, showing a slight induction (29%). Moreover, the expression of two other proteins with reported involvement in cardiovascular disease changed slightly: cytochrome P450 family 2 subfamily e polypeptide 1 (CYP2E1) (51) was up-regulated by 21%, and betaine-homocysteine S-methyltransferase 1 (BHMT) (52) was down-regulated by 24% (supplemental Table S2).
Effects of GSPE Treatment on Liver Proteome of HFD-fed Rats
In this study, we detected 75 proteins whose expression was altered by GSPE in the livers of HFD-fed rats (supplemental Table S2). Of the proteins with a significant differential abundance of over 20% in HFD versus C or in HFD versus HFD + GSPE, Fig. 2 shows the 21 proteins changed in both comparisons. Curiously, these proteins exhibited similar expression in the HFD + GSPE and C groups, meaning that GSPE was able to correct HFD effects on rat livers and did not in any case worsen the situation, which would suggest some putative targets for the treatment of metabolic syndrome. Some of these proteins are related to lipid metabolism and were already mentioned in the previous section (PKLR, ACLY, FASN, GPD1L, ACOT2, and BUCS1). Additionally, other proteins were altered by the GSPE treatment although not significantly changed by HFD (Table I), but when looking at other members of the pathway, it seems as though the pathway was indeed affected by HFD and corrected by GSPE (Fig. 1). For example, the lower abundance of acetyl-CoA carboxylase α (ACACA) in HFD + GSPE-fed rats fits the higher expression of the other FA synthesis-involved enzymes, ACLY and FASN, in HFD-fed rats. Likewise, PCK2 induction due to GSPE is consistent with PKLR induction in HFD-fed rats. Moreover, three proteins involved in supplying NADPH for FA synthesis, glucose-6-phosphate dehydrogenase (G6PD), 6-phosphogluconate dehydrogenase, decarboxylating (PGD), and malic enzyme 1 (ME1), were also corrected (down-regulated) by GSPE, whereas TALDO1 of the same pathway was up-regulated in HFD-fed rats (Fig. 1). Two proteins of fatty acid β-oxidation also seemed to support each other, long chain acyl-CoA dehydrogenase (ACADL) and the peroxisomal ACOX1, taking part in the β-oxidation of long and very long chain acyl-CoAs, respectively. Together, they indicate an increase in long chain fatty acid β-oxidation due to GSPE treatment (Table I). However, other parts of β-oxidation seemed to decrease as a result of GSPE treatment as demonstrated by three proteins: the inner mitochondrial membrane protein of the carnitine shuttle, carnitine palmitoyltransferase 2 (CPT-II); the enzyme catalyzing the first step of FA β-oxidation, short chain acyl-CoA dehydrogenase (ACADS); and the enzyme participating in the mitochondrial β-oxidation of unsaturated FA, 2,4-dienoyl-CoA reductase 1 mitochondrial (DECR1). Other proteins involved in lipid metabolism whose expression was only significantly altered in HFD + GSPE-fed rats (Table I) were the fatty-acid translocase CD36 antigen (CD36) (53); a protein associated with lipid droplets in fatty liver, methyltransferase-like 7B (METTL7B) (54); a lipid transfer protein capable of shuttling phosphatidylcholine and phosphatidylethanolamine between membranes, START domain-containing 10, found to be overexpressed in breast cancer but also present in the liver (55); and transmembrane 7 superfamily member 2, an endoplasmic reticulum 3β-hydroxysterol Δ14-reductase acting on Δ14-unsaturated sterol intermediates during the conversion of lanosterol to cholesterol (56). GSPE also affected the fatty acid-binding protein (FABP-II), increasing its expression by 50%. Taken together, these results show the clear impact of GSPE on proteins related to lipid metabolism.
Fig. 2.

Correction of HFD-altered protein expression by GSPE. Relative abundance of proteins in rats fed for 13 weeks with a chow diet (C), HFD, or high fat diet plus an oral dose of 25 mg of GSPE/kg of body weight for the last 10 days (HFD + GSPE) is shown. C, light gray; HFD, black; and HFD + GSPE, dark gray. The values are the average of three biological replicates and error bars represent Standard Error of the Mean. For each protein, the three values were normalized to get a C value of 1.0. All proteins showed a significant (p < 0.05) difference above 20% between C and HFD and between HFD and HFD + GSPE groups, indicating proteins for which the GSPE treatment reversed the effect of HFD back to the C level.
GSPE also corrected (down-regulated) the expression of other proteins involved in various other processes (Fig. 2): dihydroxyacetone kinase, an enzyme that catalyzes both the phosphorylation of dihydroxyacetone and the splitting of ribonucleoside diphosphate-X compounds; ubiquitin-conjugating enzyme E2-25K, which may mediate foam cell formation by the suppression of apoptosis of lipid-bearing macrophages through ubiquitination and subsequence degradation of p53; PLAA, which is related to inflammation; MYL12B, which plays an important role in the regulation of cell contractile activity and is implicated in cytokinesis, receptor capping, and cell locomotion; several tropomyosins that bind actin filaments and have been recently found in the wall of blood vessels in a portal area of liver (57); a protein that interacts with microtubules (FAM82A); and 3-hydroxyacyl-CoA dehydrogenase type 2, a mitochondrial multifunctional enzyme implicated in steroid and isoleucine metabolism (58) among other processes. Two more proteins, rCG50422 and rCG53940, were also up-regulated in HFD-fed rats and corrected in HFD + GSPE-fed rats. For these two proteins, no protein annotation is accessible yet, but sequence motifs (from NCBI data) indicate endonuclease and lactate dehydrogenase activities, respectively. Of interest, a number of cytoskeletal, G protein signaling, and cell dynamics proteins showed the same tendency; that is, HFD up-regulated their expression, and GSPE treatment acted in the opposite sense with more than 2-fold change in some cases (Table II and supplemental Table S2). Moreover, the zinc transporter solute carrier family 30 member 1 (SLC30A1), that has a putative effect on signaling and other zinc mediated processes in the liver, was also decreased by GSPE.
GSPE also significantly relieved the suppressed level of several proteins in HFD-fed rats (Fig. 2): glutamine fructose-6-phosphate transaminase 1 (GFPT1), which controls the flux of glucose into the hexosamine pathway; the sodium-dependent amino acid/proton antiporter solute carrier family 38 member 3, which may play a role in nitrogen metabolism and synaptic transmission; the heterogeneous nuclear ribonucleoprotein A2, which is involved with pre-mRNA processing; the signal peptidase complex catalytic subunit SEC11A, which removes signal peptides from nascent proteins, and finally hemoglobin.
The potential of GSPE to correct HFD-induced changes was further demonstrated by the comparison of the overall protein profiles between the three groups of rats. Hierarchical clustering was carried out on proteins that were statistically significant in at least one of the pairwise comparisons: HFD versus HFD + GSPE, HFD versus C, or C versus HFD + GSPE. As shown in Fig. 3, the C and HFD + GSPE samples resembled each other to a high degree, indicating the potential of GSPE treatment to normalize protein levels. Notably, this effect of the treatment was observed even if the diet was the same in the HFD + GSPE and HFD group and despite the short duration of the treatment. This led us to expect that the GSPE treatment of metabolic diseases would produce a general beneficial effect on the liver.
Fig. 3.
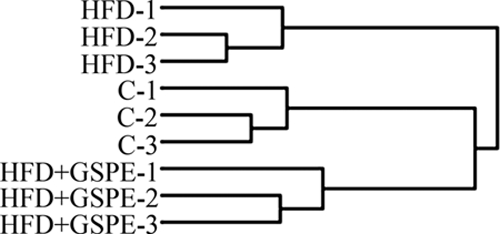
Clustering of experimental replicates according to protein expression. Hierarchical clustering of protein quantity values of the various replicates shows the degree of similarity between the replicates as well as between the experimental groups.
DISCUSSION
In this study, we detected proteins modulated by GSPE treatment in the liver of a rat model of metabolic syndrome. More than 1000 proteins were detected, aided by fractionation of the proteome into soluble and membrane proteins, enabling mapping of the major metabolic pathways of the liver. Metabolic syndrome was induced by offering the animals a very tasty HFD that they could eat ad libitum. Other studies by our research group on the same animals, whose liver proteome has been studied here, have shown that HFD-fed rats suffer from metabolic syndrome symptoms such as obesity, fatty liver due to hepatic TG and cholesterol accumulation, dyslipidemia caused by high plasma TG and low density lipoprotein cholesterol (25), hyperinsulinemia (16), and inflammation (88). All these symptoms were slightly reduced in the group of HFD-fed rats treated with GSPE for 10 days (HFD + GSPE group) except dyslipidemia, which was completely corrected. Our results show that sugar and lipid metabolisms were particularly altered, describing the extensive effects of metabolic syndrome and its reversal by treatment with GSPE.
The animals were sacrificed 3 h after their respective diets were removed. This must be considered a postprandial state in which insulin promotes glucose transformation into glycogen and FA in the liver. Because HFD is also a sugar-rich diet, a higher sugar concentration is expected to reach the liver through the portal vein. In this study, we found two enzymes involved in glycogen synthesis (UGP2 and GBE1) up-regulated in HFD-fed rats (Fig. 1A). The expression of gluconeogenesis- and glycolysis-controlling enzymes (PCK2 and PKLR, respectively) indicates induction of gluconeogenesis in rats treated with GSPE and high glycolytic activity in HFD-fed rats. During glycolysis, NADH is produced, and we found an increase of GPD1L, an enzyme of one of the two shuttles that transfer the cytosolic reducing equivalents of NADH to the mitochondrion where it enters the respiratory chain to produce ATP, in response to HFD. Pyruvate, another product of glycolysis, can enter mitochondria and be converted to citrate, which in turn either 1) is oxidized in the Krebs cycle or 2) serves as an acetyl-CoA precursor necessary for de novo FA synthesis outside mitochondria. Actually, our results indicate that both pathways were activated in HFD-fed rats. First, MT-CO3 and HCCS, two enzymes related to the respiratory chain, were up-regulated in HFD-fed rats and tended to decrease with GSPE treatment. Second, ACLY, which converts citrate into acetyl-CoA, was found to be both induced in HFD- and repressed in HFD + GSPE-fed rats. Acetyl-CoA is one of the substrates of the FA synthesis regulatory enzyme ACACA, which has been shown to have higher gene expression as a result of a cafeteria diet (59). According to our results, ACACA expression was reduced in response to GSPE, suggesting a reduction of FA synthesis, but not altered by HFD. The last enzyme in the FA biosynthetic pathway, FASN, was found to be 1.5-fold induced in HFD-fed rats. This cytosolic enzyme catalyzes the formation of long chain fatty acids from acetyl-CoA, malonyl-CoA, and NADPH. Other authors also found that high carbohydrate (60) and cafeteria diets (high fat and high sucrose diet) (59) induced FASN expression at the mRNA level in rats. Patients suffering from non-alcoholic fatty liver disease also show an increase of expression of FASN (61) consistent with the increased FASN expression and fatty liver found in HFD-fed rats. FASN is believed to be a determinant of the maximal capacity of a tissue to synthesize long chain fatty acids by de novo lipogenesis, and FASN inhibitors have been studied as a treatment for obesity because they mediate profound weight loss in animals (62). The results of this study suggest that GSPE may be a good candidate for FASN regulation because FASN expression was greatly down-regulated (even below control levels) in HFD + GSPE-fed rats. Similarly, other studies have shown a decreased expression of FASN due to different flavonoids in HFD-fed animals (63, 64). In addition, several other studies also describe flavonoids that inhibit FASN activity (65–72). Specifically, Kweon et al. (73) also found that the activity of FASN in rat liver was lowered by half by treatment with a grape seed extract.
NADPH is the other substrate needed for FA synthesis, and it is provided either in a reaction catalyzed by malic enzyme or via the pentose phosphate pathway. TALDO1, an enzyme of the pentose phosphate pathway, was induced in HFD-fed rats. The opposite phenomenon was observed in the HFD + GSPE group: a decrease in the expression of ME1, PGD, and G6PD. The latter, a key enzyme in the pathway, has previously been reported to be decreased by other flavonoids, hesperidin and naringin, in type 2 diabetic mice (72).
The normal fate of de novo synthesized FA is incorporation into triglycerides. In fact, HFD-fed rat livers had a significantly higher amount of triglycerides (25). The increase of GPD1L in HFD-fed rats would be consistent with the need for glycerol 3-phosphate for triglyceride synthesis, whereas the opposite would be true for HFD + GSPE-fed rats. This is in accordance with the finding, in the same rats, of low mRNA levels of diglyceride acyltransferase 2 (DGAT2) (25) because DGAT2 is a key enzyme in the free FA reesterification process that delivers TG to the nascent VLDL (74). Decreases in the microsomal transfer protein mRNA (key controller of VLDL assembly) have also been reported in HFD + GSPE-fed rats (25) that could diminish VLDL assembly. In this study, conclusions about VLDL assembly cannot be drawn because microsomal transfer protein expression only was changed with a low magnitude.
Taken together, these results indicate that GSPE decreased TG synthesis in obese rats despite the HFD they received. In fact, our group previously demonstrated that the hypotriglyceridemic effect of GSPE in vivo acts through an FXR- and SHP-dependent mechanism (21, 22). GSPE-enhanced FXR activity up-regulates the expression of SHP, which in turns represses SREBP1c, the transcription factor that controls the expression of hepatic genes involved in FA and TG synthesis (75). Now, we have reported a decrease of lipogenesis in HFD + GSPE rats through the expression of an extended number of proteins. This would further confirm the effect of GSPE at an upstream transcriptional regulatory level, although additional direct effects on the expression or functionality of individual proteins cannot be ruled out. Similarly, other flavonoids decrease SREBP1c, ACACA, and FASN liver expression (63, 64) and activity (71) in rats fed an HFD.
According to Quesada et al. (25), both HFD- and HFD + GSPE-fed rats suffered from fatty liver, but GSPE showed a tendency to ameliorate this condition. Fatty liver consists of hepatic lipid accumulation and can be caused by, in addition to a higher uptake of lipids of external origin, increased lipogenesis or decreased lipid oxidation in the liver or lipoprotein secretion (for a review, see Ref. 76). It is generally thought that an activation of FA synthesis reduces β-oxidation through the allosteric inhibition of carnitine palmitoyltransferase 1 (CPT-I), the rate-determining step in mitochondrial FA β-oxidation. However, CPT-I was not detected in this study, and other enzymes involved in mitochondrial FA β-oxidation such as CPT-II, ACADS, ACADL, and DECR1 were not significantly changed in HFD-fed rats (Table I). In the present study, GSPE effects on mitochondrial FA β-oxidation seem to be dependent on FA chain length because CPT-II, ACADS, and DECR1 were repressed due to GSPE treatment, whereas ACADL was overexpressed (Fig. 1B). The repression of ACADS and induction of ACADL appear to be controversial, and further investigation would be needed to elucidate their impact on the pathway fluxes. Changes in protein levels are not always consistent with changes in activities because of posttranslational modifications, subcellular location, allosteric regulation, etc. In fact, activities are also not conclusive, which means that pathway fluxes should be measured to find out how the different parts of FA β-oxidation are influenced by HFD and GSPE.
Acyl-CoAs are substrates in FA β-oxidation, and BUCS1 and ACOT2 are two mitochondrial enzymes that control acyl-CoA levels. In this study, we found that both BUCS1 and ACOT2 were up-regulated in HFD- (Fig. 1A) and down-regulated in HFD + GSPE-fed rats (Fig. 1B). BUCS1 adds CoA to 4–11-carbon FAs, whereas ACOT2 removes CoA preferably from 14–20-carbon acyl-CoAs. According to their preferred substrate, down-regulation of BUCS1 and ACOT2 in mitochondria of HFD + GSPE rats would result in the presence of deactivated short and medium chain FAs and activated long chain FAs. The consequence could be a decrease in β-oxidation of short and medium chain acyl-CoAs and an increase in long chain FA β-oxidation in HFD + GSPE-fed rats, whereas the opposite would occur in HFD-fed rats. This correlates with the observed levels of ACADS and ACADL in both groups and with the already observed down-regulation of short and medium chain acyl-CoA synthetases in GSPE-treated mice (21, 22). ACOX1, the first enzyme in peroxisomal FA β-oxidation of straight very long chain FAs, was reduced more than 2-fold in HFD-fed rats, indicating a lower β-oxidation of very long chain FAs, and the opposite seemed to be the case for HFD + GSPE-fed rats. Moreover, we found higher levels of catalase in HFD + GSPE-fed rats that could be due to a higher need for depletion of hydrogen peroxide produced by a higher ACOX1 activity in peroxisomes, reinforcing that FA β-oxidation is probably activated in HFD + GSPE-fed rats. Taken together, our results suggest that mitochondrial β-oxidation of FAs of different chain lengths could be controlled by BUCS1 and ACOT2 activities. In fact, this controlling role of BUCS1 would be consistent with the observation that polymorphisms in some human medium chain acyl-CoA synthetases are correlated with hypertriglyceridemia, visceral obesity (77), and cholesterol high density lipoprotein (78).
PLAA is another protein related to cardiovascular disease that was corrected by GSPE treatment in this study. PLAA activates a regulator of eicosanoid biosynthesis (phospholipase A2) (79) and is induced in several inflammation situations (50). HFD-fed rats have been shown to have high tumor necrosis factor α and C-reactive protein levels in plasma, whereas GSPE treatment reduced high tumor necrosis factor α (88), indicating a decrease in inflammation. This might explain the decreased PLAA expression in HFD + GSPE-fed rats found in the present study. In fact, other flavonoids are known to inhibit PLA2A activity (80–82).
In addition to counteracting the effects produced by HFD, GSPE also modified the expression of some proteins not affected by diet and revealed them to be proteins with possible positive effects on cardiovascular disease. These include CD36 and METTL7B (Table I) among other putative GSPE targets such as SLC30A1, G protein signaling proteins, etc. (Table II and supplemental Table S2). We report a more than 50% decrease in response to GSPE of SLC30A1, the transporter that exports zinc ions out of cells. Previous results in our group showed a decrease in the mRNA level of this zinc transporter and an increase in labile zinc cytosolic levels in HepG2 hepatocytes treated with GSPE, and we hypothesized that through these changes in labile zinc levels GSPE would affect signaling processes and/or metabolic pathways modulated by zinc (83).
HFD and GSPE also strongly influenced the expression of G protein signaling proteins. Among them, the Ras-like protein Ras-related protein 1b (RAP1B) showed increased expression due to HFD, and GSPE treatment tended to decrease its expression. RAP1B has previously been found to be upregulated during a hyperglycemic state (84). Other flavonoids have been reported to have an effect on G protein signaling. For example, cocoa procyanidins inhibit the activity of the mitogen-activated protein kinase (85), and isoflavones attenuate vascular contraction, at least in part, through inhibition of the RhoA/Rho kinase signaling pathway (86).
We also found a lower expression of ETHE1 and SQRDL in HFD-fed rats (Table II), and GSPE tended to normalize their expression. ETHE1 and SQRDL are two enzymes involved in sulfur metabolism that take part in the pathway in which H2S is oxidized to thiosulfate in three steps (48). H2S oxidation has previously been found in the liver (87), and although H2S has toxic properties (e.g. inhibiting the respiratory chain), the basal endogenous concentration of H2S has been found to have a cardioprotective effect mainly due to its antioxidant and vasorelaxation properties (49). The decreased levels of these two enzymes in HFD-fed rats may allow the presence of higher concentrations of H2S, which may balance out some of the risks of high blood pressure and oxidative stress associated with obesity. On the other hand, H2S seems to be implicated in several biological processes (49), and we cannot exclude the possibility of other regulatory properties of H2S in relation to obesity.
In summary, the increased expression of some enzymes involved in glycogenesis (UGP2 and GBE1), glycolysis (PKLR), FA synthesis (ACLY and FASN), NADPH synthesis (TALDO1), and glycerol synthesis (GPD1L) reinforces each other and demonstrates that glycogen synthesis and de novo lipogenesis were induced in the livers of rats fed an HFD. GSPE treatment of this metabolic syndrome animal model seems to reverse this effect, modifying the expression of PKLR, PCK2, ACLY, ACACA, FASN, G6PD, PGD, ME1, and GPD1L in the opposite direction. Decreased lipid synthesis due to GSPE is consistent with the corrected dyslipidemia reported previously for these animals (25) and extends the already demonstrated effect of GSPE in SREBP1c repression (21, 22, 25). Similarly, an effect of GSPE on the peroxisome proliferator-activated receptor α transcription factor may also be possible and needs to be further investigated as our results show that GSPE also modulates FA β-oxidation. Specifically, we found that β-oxidation would be induced in HFD-fed rats according to BUCS1 expression and reduced by GSPE for short and medium chain FAs (in view of ACADS repression), whereas long and very long chain FAs would be more actively oxidized in HFD + GSPE-fed rats (in view of ACADL induction). We hypothesize that this action could be controlled by acyl-CoA synthetases (BUCS1) and thioesterases (ACOT2), which would regulate the acyl-CoA levels in mitochondria. Some putative drug targets were also revealed during the course of this study that could ameliorate the deleterious effects of metabolic diseases on the liver such as GFPT1, CD36, PLAA, METTL7B, SLC30A1, ETHE1, and SQRDL and several proteins of G protein signaling.
Supplementary Material
Acknowledgments
We are grateful to all members of the Nutrigenomics Research Group for cooperation in caring for the animals and sampling. We also thank Dr. A. Ardévol, Dr. M. Blay, Dr. J. Fernández, and Dr. M. J. Salvadó for contributions to the discussion of the results.
* This work was supported in part by Grant AGL2008-00387/ALI from Spanish government. The John and Birthe Meyer Foundation, and the Institute of Clinical Medicine at Aarhus University, Denmark.
 This article contains supplemental Tables S1 and S2.
1 The abbreviations used are:
- CVD
- cardiovascular disease
- ACACA
- acetyl-CoA carboxylase α
- ACADL
- long chain acyl-CoA dehydrogenase
- ACADS
- short chain acyl-CoA dehydrogenase
- ACLY
- ATP-citrate lyase isoform 1
- ACOT2
- mitochondrial acyl-CoA thioesterase 2
- ACOX1
- palmitoyl acyl-CoA oxidase 1
- BUCS1
- butyryl-CoA synthetase 1 protein
- C
- control
- CD36
- CD36 antigen
- CPT-I
- carnitine palmitoyltransferase 1
- CPT-II
- carnitine palmitoyltransferase 2
- DECR1
- 2,4-dienoyl-CoA reductase 1, mitochondrial
- DGAT2
- diglyceride acyltransferase 2
- ETHE1
- ethylmalonic encephalopathy 1
- FA
- fatty acid
- FAM82A
- regulator of microtubule dynamics protein 2
- FASN
- fatty-acid synthase
- FXR
- farnesoid X receptor
- G6PD
- glucose-6-phosphate dehydrogenase
- GBE1
- glucan (1,4-α-), branching enzyme 1
- GFPT1
- glutamine fructose-6-phosphate transaminase 1
- GO
- gene ontology
- GPD1L
- glycerol-3-phosphate dehydrogenase 1
- GSPE
- grape seed proanthocyanidin extract
- H2S
- hydrogen sulfide
- HCCS
- cytochrome c-type heme-lyase
- HFD
- high fat diet
- iTRAQ
- isobaric tag for relative and absolute quantitation
- ME1
- malic enzyme 1
- METTL7B
- methyltransferase-like 7B
- M
- membrane protein(s)
- MT-CO3
- cytochrome c oxidase subunit II
- MYL12B
- myosin light chain regulatory B
- NCBI
- National Center for Biotechnology Information
- PCK2
- phosphoenolpyruvate carboxykinase 2
- PGD
- 6-phosphogluconate dehydrogenase, decarboxylating
- PKLR
- pyruvate kinase
- PLAA
- phospholipase A2-activating protein
- S
- soluble protein(s)
- SHP
- small heterodimer partner
- SLC30A1
- solute carrier family 30 member 1
- SQRDL
- sulfide-quinone reductase-like
- SREBP1c
- sterol regulatory element-binding protein 1
- TALDO1
- transaldolase 1
- TG
- triglyceride
- UGP2
- UDP-glucose pyrophosphorylase 2
- VLDL
- very low density lipoprotein
- LTQ
- linear trap quadrupole
- START
- steroidogenic acute regulatory protein-related lipid transfer.
REFERENCES
- 1.Hainer V., Toplak H., Mitrakou A. (2008) Treatment modalities of obesity: what fits whom? Diabetes Care 31, Suppl. 2, S269–S277 [DOI] [PubMed] [Google Scholar]
- 2.Goralski K. B., Sinal C. J. (2007) Type 2 diabetes and cardiovascular disease: getting to the fat of the matter. Can. J. Physiol. Pharmacol. 85, 113–132 [DOI] [PubMed] [Google Scholar]
- 3.Kotronen A., Yki-Järvinen H. (2008) Fatty liver—a novel component of the metabolic syndrome. Arterioscler. Thromb. Vasc. Biol. 28, 27–38 [DOI] [PubMed] [Google Scholar]
- 4.Huang P. L. (2009) A comprehensive definition for metabolic syndrome. Dis. Model. Mech. 2, 231–237 [DOI] [PMC free article] [PubMed] [Google Scholar]
- 5.Serra-Majem L., Roman B., Estruch R. (2006) Scientific evidence of interventions using the Mediterranean diet: a systematic review. Nutr. Rev. 64, S27–S47 [DOI] [PubMed] [Google Scholar]
- 6.Sofi F., Cesari F., Abbate R., Gensini G. F., Casini A. (2008) Adherence to Mediterranean diet and health status: meta-analysis. BMJ 337, a1344. [DOI] [PMC free article] [PubMed] [Google Scholar]
- 7.Schröder H. (2007) Protective mechanisms of the Mediterranean diet in obesity and type 2 diabetes. J. Nutr. Biochem. 18, 149–160 [DOI] [PubMed] [Google Scholar]
- 8.Giugliano D., Esposito K. (2008) Mediterranean diet and metabolic diseases. Curr. Opin. Lipidol. 19, 63–68 [DOI] [PubMed] [Google Scholar]
- 9.Renaud S., de Lorgeril M. (1992) Wine, alcohol, platelets, and the French paradox for coronary heart disease. Lancet 339, 1523–1526 [DOI] [PubMed] [Google Scholar]
- 10.Dohadwala M. M., Vita J. A. (2009) Grapes and cardiovascular disease. J. Nutr. 139, 1788S–1793S [DOI] [PMC free article] [PubMed] [Google Scholar]
- 11.Leifert W. R., Abeywardena M. Y. (2008) Cardioprotective actions of grape polyphenols. Nutr. Res. 28, 729–737 [DOI] [PubMed] [Google Scholar]
- 12.Pérez-Jiménez J., Saura-Calixto F. (2008) Grape products and cardiovascular disease risk factors. Nutr. Res. Rev. 21, 158–173 [DOI] [PubMed] [Google Scholar]
- 13.Aron P. M., Kennedy J. A. (2008) Flavan-3-ols: nature, occurrence and biological activity. Mol. Nutr. Food Res. 52, 79–104 [DOI] [PubMed] [Google Scholar]
- 14.Puiggros F., Llópiz N., Ardévol A., Bladé C., Arola L., Salvadó M. J. (2005) Grape seed procyanidins prevent oxidative injury by modulating the expression of antioxidant enzyme systems. J. Agric. Food Chem. 53, 6080–6086 [DOI] [PubMed] [Google Scholar]
- 15.Pinent M., Bladé C., Salvadó M. J., Blay M., Pujadas G., Fernández-Larrea J., Arola L., Ardévol A. (2006) Procyanidin effects on adipocyte-related pathologies. Crit. Rev. Food. Sci. Nutr. 46, 543–550 [DOI] [PubMed] [Google Scholar]
- 16.Montagut G., Bladé C., Blay M., Fernández-Larrea J., Pujadas G., Salvadó M. J., Arola L., Pinent M., Ardévol A. (2010) Effects of a grapeseed procyanidin extract (GSPE) on insulin resistance. J. Nutr. Biochem. 10.1016/j.jnutbio.2009.08.001 [DOI] [PubMed] [Google Scholar]
- 17.Del Bas J. M., Fernández-Larrea J., Blay M., Ardèvol A., Salvadó M. J., Arola L., Bladé C. (2005) Grape seed procyanidins improve atherosclerotic risk index and induce liver CYP7A1 and SHP expression in healthy rats. FASEB J. 19, 479–481 [DOI] [PubMed] [Google Scholar]
- 18.Terra X., Valls J., Vitrac X., Mérrillon J. M., Arola L., Ardèvol A., Bladé C., Fernandez-Larrea J., Pujadas G., Salvadó J., Blay M. (2007) Grape-seed procyanidins act as antiinflammatory agents in endotoxin-stimulated RAW 264.7 macrophages by inhibiting NFkB signaling pathway. J. Agric. Food Chem. 55, 4357–4365 [DOI] [PubMed] [Google Scholar]
- 19.Terra X., Fernández-Larrea J., Pujadas G., Ardèvol A., Bladé C., Salvadó J., Arola L., Blay M. (2009) Inhibitory effects of grape seed procyanidins on foam cell formation in vitro. J. Agric. Food Chem. 57, 2588–2594 [DOI] [PubMed] [Google Scholar]
- 20.Terra X., Montagut G., Bustos M., Llopiz N., Ardèvol A., Bladé C., Fernández-Larrea J., Pujadas G., Salvadó J., Arola L., Blay M. (2009) Grape-seed procyanidins prevent low-grade inflammation by modulating cytokine expression in rats fed a high-fat diet. J. Nutr. Biochem. 20, 210–218 [DOI] [PubMed] [Google Scholar]
- 21.Del Bas J. M., Ricketts M. L., Baiges I., Quesada H., Ardevol A., Salvadó M. J., Pujadas G., Blay M., Arola L., Bladé C., Moore D. D., Fernandez-Larrea J. (2008) Dietary procyanidins lower triglyceride levels signaling through the nuclear receptor small heterodimer partner. Mol. Nutr. Food Res. 52, 1172–1181 [DOI] [PubMed] [Google Scholar]
- 22.Del Bas J. M., Ricketts M. L., Vaqué M., Sala E., Quesada H., Ardevol A., Salvadó M. J., Blay M., Arola L., Moore D. D., Pujadas G., Fernandez-Larrea J., Bladé C. (2009) Dietary procyanidins enhance transcriptional activity of bile acid-activated FXR in vitro and reduce triglyceridemia in vivo in a FXR-dependent manner. Mol. Nutr. Food Res. 53, 805–814 [DOI] [PMC free article] [PubMed] [Google Scholar]
- 23.Montagut G., Baiges I., Valls J., Terra X., del Bas J. M., Vitrac X., Richard T., Merillon J. M., Arola L., Blay M., Blade C., Fernandez-Larrea J., Pujadas G., Salvado J., Ardevol A. (2009) A trimer plus a dimer-gallate reproduce the bioactivity described for an extract of grape seed procyanidins. Food Chem. 116, 265–270 [Google Scholar]
- 24.Sclafani A., Berner C. N. (1976) Influence of diet palatability on meal taking behavior of hypothalamic hyperphagic and normal rats. Physiol. Behav. 16, 355–363 [DOI] [PubMed] [Google Scholar]
- 25.Quesada H., del Bas J. M., Pajuelo D., Díaz S., Fernandez-Larrea J., Pinent M., Arola L., Salvadó M. J., Bladé C. (2009) Grape seed proanthocyanidins correct dyslipidemia associated with a high-fat diet in rats and repress genes controlling lipogenesis and VLDL assembling in liver. Int. J. Obes. 33, 1007–1012 [DOI] [PubMed] [Google Scholar]
- 26.Douette P., Navet R., Gerkens P., de Pauw E., Leprince P., Sluse-Goffart C., Sluse F. E. (2005) Steatosis-induced proteomic changes in liver mitochondria evidenced by two-dimensional differential in-gel electrophoresis. J. Proteome Res. 4, 2024–2031 [DOI] [PubMed] [Google Scholar]
- 27.Zhang L., Perdomo G., Kim D. H., Qu S., Ringquist S., Trucco M., Dong H. H. (2008) Proteomic analysis of fructose-induced fatty liver in hamsters. Metab. Clin. Exp. 57, 1115–1124 [DOI] [PMC free article] [PubMed] [Google Scholar]
- 28.Mantena S. K., King A. L., Andringa K. K., Eccleston H. B., Bailey S. M. (2008) Mitochondrial dysfunction and oxidative stress in the pathogenesis of alcohol- and obesity-induced fatty liver diseases. Free Radic. Biol. Med. 44, 1259–1272 [DOI] [PMC free article] [PubMed] [Google Scholar]
- 29.Maris M., Overbergh L., Mathieu C. (2008) Type 2 diabetes: gaining insight into the disease process using proteomics. Proteomics Clin. Appl. 2, 312–326 [DOI] [PubMed] [Google Scholar]
- 30.Morand J. P., Macri J., Adeli K. (2005) Proteomic profiling of hepatic endoplasmic reticulum-associated proteins in an animal model of insulin resistance and metabolic dyslipidemia. J. Biol. Chem. 280, 17626–17633 [DOI] [PubMed] [Google Scholar]
- 31.Schmid G. M., Converset V., Walter N., Sennitt M. V., Leung K. Y., Byers H., Ward M., Hochstrasser D. F., Cawthorne M. A., Sanchez J. C. (2003) Effect of high-fat diet on the expression of proteins in muscle, adipose tissues, and liver of C57BL/6 mice, in 3rd Annual Congress of the Swiss-Proteomics-Society, pp. 2270–2282, Wiley-VCH Verlag Gmbh, Basel, Switzerland: [DOI] [PubMed] [Google Scholar]
- 32.Van Greevenbroek M. M., Vermeulen V. M., De Bruin T. W. (2004) Identification of novel molecular candidates for fatty liver in the hyperlipidemic mouse model, HcB19. J. Lipid Res. 45, 1148–1154 [DOI] [PubMed] [Google Scholar]
- 33.Arbones-Mainar J. M., Ross K., Rucklidge G. J., Reid M., Duncan G., Arthur J. R., Horgan G. W., Navarro M. A., Carnicer R., Arnal C., Osada J., de Roos B. (2007) Extra virgin olive oils increase hepatic fat accumulation and hepatic antioxidant protein levels in APOE(−/−) mice. J. Proteome Res. 6, 4041–4054 [DOI] [PubMed] [Google Scholar]
- 34.Ong E. S., Len S. M., Lee A. C., Chui P., Chooi K. F. (2004) Proteomic analysis of mouse liver for the evaluation of effects of Scutellariae radix by liquid chromatography with tandem mass spectrometry. Rapid Commun. Mass Spectrom. 18, 2522–2530 [DOI] [PubMed] [Google Scholar]
- 35.Bordier C. (1981) Phase separation of integral membrane proteins in Triton X-114. J. Biol. Chem. 256, 1604–1607 [PubMed] [Google Scholar]
- 36.Puigserver P., Lladó I., Palou A., Gianotti M. (1991) Evidence for masking of brown adipose-tissue mitochondrial GDP-binding sites in response to fasting in rats made obese by dietary manipulation—effects of reversion to standard diet. Biochem. J. 279, 575–579 [DOI] [PMC free article] [PubMed] [Google Scholar]
- 37.Moebius J., Zahedi R. P., Lewandrowski U., Berger C., Walter U., Sickmann A. (2005) The human platelet membrane proteome reveals several new potential membrane proteins. Mol. Cell. Proteomics 4, 1754–1761 [DOI] [PubMed] [Google Scholar]
- 38.Fujiki Y., Hubbard A. L., Fowler S., Lazarow P. B. (1982) Isolation of intracellular membranes by means of sodium-carbonate treatment—application to endoplasmic-reticulum. J. Cell Biol. 93, 97–102 [DOI] [PMC free article] [PubMed] [Google Scholar]
- 39.Palmfeldt J., Vang S., Stenbroen V., Pedersen C. B., Christensen J. H., Bross P., Gregersen N. (2009) Mitochondrial proteomics on human fibroblasts for identification of metabolic imbalance and cellular stress. Proteome Sci. 7, 20. [DOI] [PMC free article] [PubMed] [Google Scholar]
- 40.Eisen M. B., Spellman P. T., Brown P. O., Botstein D. (1998) Cluster analysis and display of genome-wide expression patterns. Proc. Natl. Acad. Sci. U.S.A. 95, 14863–14868 [DOI] [PMC free article] [PubMed] [Google Scholar]
- 41.Saldanha A. J. (2004) Java Treeview—extensible visualization of microarray data. Bioinformatics 20, 3246–3248 [DOI] [PubMed] [Google Scholar]
- 42.Barsnes H., Vizcaíno J. A., Eidhammer I., Martens L. (2009) PRIDE Converter: making proteomics data-sharing easy. Nat. Biotechnol. 27, 598–599 [DOI] [PubMed] [Google Scholar]
- 43.Hunt M. C., Alexson S. E. (2002) The role acyl-CoA thioesterases play in mediating intracellular lipid metabolism. Prog. Lipid Res. 41, 99–130 [DOI] [PubMed] [Google Scholar]
- 44.Soupene E., Kuypers F. A. (2008) Mammalian long-chain Acyl-CoA synthetases. Exp. Biol. Med. 233, 507–521 [DOI] [PMC free article] [PubMed] [Google Scholar]
- 45.Holmes R. S., Cox L. A., Vandeberg J. L. (2009) Bovine carboxylesterases: Evidence for two CES1 and five families of CES genes on chromosome 18. Comp. Biochem. Physiol. Part D Genomics Proteomics 4, 11–20 [DOI] [PMC free article] [PubMed] [Google Scholar]
- 46.Tsujita T., Okuda H. (1993) Palmitoyl-coenzyme A hydrolyzing activity in rat kidney and its relationship to carboxylesterase. J. Lipid Res. 34, 1773–1781 [PubMed] [Google Scholar]
- 47.Hildebrandt T. M., Grieshaber M. K. (2008) Three enzymatic activities catalyze the oxidation of sulfide to thiosulfate in mammalian and invertebrate mitochondria. FEBS J. 275, 3352–3361 [DOI] [PubMed] [Google Scholar]
- 48.Tiranti V., Viscomi C., Hildebrandt T., Di Meo I., Mineri R., Tiveron C., Levitt M. D., Prelle A., Fagiolari G., Rimoldi M., Zeviani M. (2009) Loss of ETHE1, a mitochondrial dioxygenase, causes fatal sulfide toxicity in ethylmalonic encephalopathy. Nat. Med. 15, 200–205 [DOI] [PubMed] [Google Scholar]
- 49.Mancardi D., Penna C., Merlino A., Del Soldato P., Wink D. A., Pagliaro P. (2009) Physiological and pharmacological features of the novel gasotransmitter: hydrogen sulfide. Biochim. Biophys. Acta 1787, 864–872 [DOI] [PMC free article] [PubMed] [Google Scholar]
- 50.Ribardo D. A., Crowe S. E., Kuhl K. R., Peterson J. W., Chopra A. K. (2001) Prostaglandin levels in stimulated macrophages are controlled by phospholipase A(2)-activating protein and by activation of phospholipase C and D. J. Biol. Chem. 276, 5467–5475 [DOI] [PubMed] [Google Scholar]
- 51.Mantena S. K., Vaughn D. P., Andringa K. K., Eccleston H. B., King A. L., Abrams G. A., Doeller J. E., Kraus D. W., Darley-Usmar V. M., Bailey S. M. (2009) High fat diet induces dysregulation of hepatic oxygen gradients and mitochondrial function in vivo. Biochem. J. 417, 183–193 [DOI] [PMC free article] [PubMed] [Google Scholar]
- 52.Obeid R., Herrmann W. (2009) Homocysteine and lipids: S-adenosyl methionine as a key intermediate. FEBS Lett. 583, 1215–1225 [DOI] [PubMed] [Google Scholar]
- 53.Zhou J., Febbraio M., Wada T., Zhai Y., Kuruba R., He J., Lee J. H., Khadem S., Ren S., Li S., Silverstein R. L., Xie W. (2008) Hepatic fatty acid transporter Cd36 is a common target of LXR, PXR, and PPAR gamma in promoting steatosis. Gastroenterology 134, 556–567 [DOI] [PubMed] [Google Scholar]
- 54.Turró S., Ingelmo-Torres M., Estanyol J. M., Tebar F., Fernández M. A., Albor C. V., Gaus K., Grewal T., Enrich C., Pol A. (2006) Identification and characterization of associated with lipid droplet protein 1: a novel membrane-associated protein that resides on hepatic lipid droplets. Traffic 7, 1254–1269 [DOI] [PubMed] [Google Scholar]
- 55.Olayioye M. A., Vehring S., Müller P., Herrmann A., Schiller J., Thiele C., Lindeman G. J., Visvader J. E., Pomorski T. (2005) StarD10, a START domain protein overexpressed in breast cancer, functions as a phospholipid transfer protein. J. Biol. Chem. 280, 27436–27442 [DOI] [PubMed] [Google Scholar]
- 56.Bennati A. M., Schiavoni G., Franken S., Piobbico D., Della Fazia M. A., Caruso D., De Fabiani E., Benedetti L., Cusella De Angelis M. G., Gieselmann V., Servillo G., Beccari T., Roberti R. (2008) Disruption of the gene encoding 3 beta-hydroxysterol Delt▵14)-reductase (Tm7sf2) in mice does not impair cholesterol biosynthesis. FEBS J. 275, 5034–5047 [DOI] [PubMed] [Google Scholar]
- 57.Mölleken C., Sitek B., Henkel C., Poschmann G., Sipos B., Wiese S., Warscheid B., Broelsch C., Reiser M., Friedman S. L., Tornøe I., Schlosser A., Klöppel G., Schmiegel W., Meyer H. E., Holmskov U., Stühler K. (2009) Detection of novel biomarkers of liver cirrhosis by proteomic analysis. Hepatology 49, 1257–1266 [DOI] [PMC free article] [PubMed] [Google Scholar]
- 58.Yang S. Y., He X. Y., Olpin S. E., Sutton V. R., McMenamin J., Philipp M., Denman R. B., Malik M. (2009) Mental retardation linked to mutations in the HSD17B10 gene interfering with neurosteroid and isoleucine metabolism. Proc. Natl. Acad. Sci. U.S.A. 106, 14820–14824 [DOI] [PMC free article] [PubMed] [Google Scholar]
- 59.Sugatani J., Osabe M., Wada T., Yamakawa K., Yamazaki Y., Takahashi T., Ikari A., Miwa M. (2008) Comparison of enzymatically synthesized inulin, resistant maltodextrin and clofibrate effects on biomarkers of metabolic disease in rats fed a high-fat and high-sucrose (cafeteria) diet. Eur. J. Nutr. 47, 192–200 [DOI] [PubMed] [Google Scholar]
- 60.Clarke S. D., Armstrong M. K., Jump D. B. (1990) Nutritional control of rat-Liver fatty-acid synthase and S14 messenger-RNA abundance. J. Nutr. 120, 218–224 [DOI] [PubMed] [Google Scholar]
- 61.Ouyang X., Cirillo P., Sautin Y., McCall S., Bruchette J. L., Diehl A. M., Johnson R. J., Abdelmalek M. F. (2008) Fructose consumption as a risk factor for non-alcoholic fatty liver disease. J. Hepatol. 48, 993–999 [DOI] [PMC free article] [PubMed] [Google Scholar]
- 62.Loftus T. M., Jaworsky D. E., Frehywot G. L., Townsend C. A., Ronnett G. V., Lane M. D., Kuhajda F. P. (2000) Reduced food intake and body weight in mice treated with fatty acid synthase inhibitors. Science 288, 2379–2381 [DOI] [PubMed] [Google Scholar]
- 63.Guo H. X., Liu D. H., Ma Y., Liu J. F., Wang Y., Du Z. Y., Wang X., Shen J. K., Peng H. L. (2009) Long-term baicalin administration ameliorates metabolic disorders and hepatic steatosis in rats given a high-fat diet. Acta Pharmacol. Sin. 30, 1505–1512 [DOI] [PMC free article] [PubMed] [Google Scholar]
- 64.Honda K., Kamisoyama H., Tominaga Y., Yokota S., Hasegawa S. (2009) The molecular mechanism underlying the reduction in abdominal fat accumulation by licorice flavonoid oil in high fat diet-induced obese rats. Anim. Sci. J. 80, 562–569 [DOI] [PubMed] [Google Scholar]
- 65.Abe K., Okada N., Tanabe H., Fukutomi R., Yasui K., Isemura M., Kinae N. (2009) Effects of chronic ingestion of catechin-rich green tea on hepatic gene expression of gluconeogenic enzymes in rats. Biomed. Res. 30, 25–29 [DOI] [PubMed] [Google Scholar]
- 66.Shrestha S., Ehlers S. J., Lee J. Y., Fernandez M. L., Koo S. I. (2009) Dietary green tea extract lowers plasma and hepatic triglycerides and decreases the expression of sterol regulatory element-binding protein-1c mRNA and its responsive genes in fructose-fed, ovariectomized rats. J. Nutr. 139, 640–645 [DOI] [PMC free article] [PubMed] [Google Scholar]
- 67.Wang Y., Zhang S. Y., Ma X. F., Tian W. X. (2006) Potent inhibition of fatty acid synthase by parasitic loranthus [Taxillus chinensis (DC.) Danser] and its constituent avicularin. J. Enzyme Inhib. Med. Chem. 21, 87–93 [DOI] [PubMed] [Google Scholar]
- 68.Wang J. Q., Li J., Zou Y. H., Cheng W. M., Lu C., Zhang L., Ge J. F., Huang C., Jin Y., Lv X. W., Hu C. M., Liu L. P. (2009) Preventive effects of total flavonoids of Litsea coreana leve on hepatic steatosis in rats fed with high fat diet. J. Ethnopharmacol. 121, 54–60 [DOI] [PubMed] [Google Scholar]
- 69.Wei X., Zhao R., Sun Y. H., Cong J. P., Meng F. G., Zhou H. M. (2009) The leaf extract of Siberian Crabapple (Malus baccata (Linn.) Borkh) contains potential fatty acid synthase inhibitors. J. Enzyme Inhib. Med. Chem. 24, 234–240 [DOI] [PubMed] [Google Scholar]
- 70.Li B. H., Ma X. F., Wang Y., Tian W. X. (2005) Structure-activity relationship of polyphenols that inhibit fatty acid synthase. J. Biochem. 138, 679–685 [DOI] [PubMed] [Google Scholar]
- 71.Kamisoyama H., Honda K., Tominaga Y., Yokota S., Hasegawa S. (2008) Investigation of the anti-obesity action of licorice flavonoid oil in diet-induced obese rats. Biosci. Biotechnol. Biochem. 72, 3225–3231 [DOI] [PubMed] [Google Scholar]
- 72.Jung U. J., Lee M. K., Park Y. B., Kang M. A., Choi M. S. (2006) Effect of citrus flavonoids on lipid metabolism and glucose-regulating enzyme mRNA levels in type-2 diabetic mice. Int. J. Biochem. Cell Biol. 38, 1134–1145 [DOI] [PubMed] [Google Scholar]
- 73.Kweon S., Kim Y., Choi H. (2003) Grape extracts suppress the formation of preneoplastic foci and activity of fatty acid synthase in rat liver. Exp. Mol. Med. 35, 371–378 [DOI] [PubMed] [Google Scholar]
- 74.Gibbons G. F., Wiggins D., Brown A. M., Hebbachi A. M. (2004) Synthesis and function of hepatic very-low-density lipoprotein. Biochem. Soc. Trans. 32, 59–64 [DOI] [PubMed] [Google Scholar]
- 75.Guillou H., Martin P. G., Pineau T. (2008) Transcriptional regulation of hepatic fatty acid metabolism. Subcell. Biochem. 49, 3–47 [DOI] [PubMed] [Google Scholar]
- 76.Anderson N., Borlak J. (2008) Molecular mechanisms and therapeutic targets in steatosis and steatohepatitis. Pharmacol. Rev. 60, 311–357 [DOI] [PubMed] [Google Scholar]
- 77.Iwai N., Mannami T., Tomoike H., Ono K., Iwanaga Y. (2003) An acyl-CoA synthetase gene family in chromosome 16p12 may contribute to multiple risk factors. Hypertension 41, 1041–1046 [DOI] [PubMed] [Google Scholar]
- 78.Haketa A., Soma M., Nakayama T., Sato M., Kosuge K., Aoi N., Matsumoto K. (2004) Two medium-chain acyl-coenzyme A synthetase genes, SAH and MACS1, are associated with plasma high-density lipoprotein cholesterol levels, but they are not associated with essential hypertension. J. Hypertens. 22, 1903–1907 [DOI] [PubMed] [Google Scholar]
- 79.Homaidan F. R., Chakroun I., Haidar H. A., El-Sabban M. E. (2002) Protein regulators of eicosanoid synthesis: role in inflammation. Curr. Protein Pept. Sci. 3, 467–484 [DOI] [PubMed] [Google Scholar]
- 80.Lättig J., Böhl M., Fischer P., Tischer S., Tietböhl C., Menschikowski M., Gutzeit H. O., Metz P., Pisabarro M. T. (2007) Mechanism of inhibition of human secretory phospholipase A2 by flavonoids: rationale for lead design. J. Comput. Aided Mol. Des. 21, 473–483 [DOI] [PubMed] [Google Scholar]
- 81.Moon T. C., Hwang H. S., Quan Z., Son K. H., Kim C. H., Kim H. P., Kang S. S., Son J. K., Chang H. W. (2006) Ochnaflavone, naturally occurring biflavonoid, inhibits phospholipase A(2) dependent phosphatidylethanolamine degradation in a CCl4-induced rat liver microsome. Biol. Pharm. Bull. 29, 2359–2361 [DOI] [PubMed] [Google Scholar]
- 82.Moscatelli V., Hnatyszyn O., Acevedo C., Megías J., Alcaraz M. J., Ferraro G. (2006) Flavonoids from Artemisia copa with anti-inflammatory activity. Planta Med. 72, 72–74 [DOI] [PubMed] [Google Scholar]
- 83.Quesada I. M., Bustos M., Blay M., Pujades G., Ardévol A., Salvadó M. J., Bladé C., Arola L., Fernández-Larrea J. (2010) Dietary catechins and procyanidins modulate zinc homeostasis in human HepG2 cells. J. Nutr. Biochem., in press [DOI] [PubMed] [Google Scholar]
- 84.Sun L., Xie P., Wada J., Kashihara N., Liu F. Y., Zhao Y., Kumar D., Chugh S. S., Danesh F. R., Kanwar Y. S. (2008) Rap1b GTPase ameliorates glucose-induced mitochondrial dysfunction. J. Am. Soc. Nephrol. 19, 2293–2301 [DOI] [PMC free article] [PubMed] [Google Scholar]
- 85.Kang N. J., Lee K. W., Lee D. E., Rogozin E. A., Bode A. M., Lee H. J., Dong Z. (2008) Cocoa procyanidins suppress transformation by inhibiting mitogen-activated protein kinase kinase. J. Biol. Chem. 283, 20664–20673 [DOI] [PMC free article] [PubMed] [Google Scholar]
- 86.Seok Y. M., Baek I., Kim Y. H., Jeong Y. S., Lee I. J., Shin D. H., Hwang Y. H., Kim I. K. (2008) Isoflavone attenuates vascular contraction through inhibition of the RhoA/Rho-kinase signaling pathway. J. Pharmacol. Exp. Ther. 326, 991–998 [DOI] [PubMed] [Google Scholar]
- 87.Furne J., Springfield J., Koenig T., DeMaster E., Levitt M. D. (2001) Oxidation of hydrogen sulfide and methanethiol to thiosulfate by rat tissues: a specialized function of the colonic mucosa. Biochem. Pharmacol. 62, 255–259 [DOI] [PubMed] [Google Scholar]
- 88.Terra X., Pallarés V., Fernández-Larrea J., Pujadas G., Ardèvol A., Salvadó M. J., Bladé C., Arola L., Blay M. (2010) Modulatory effect of grape-seed procyanidins on local and systemic inflammation in diet-induced-obesity rats. J. Nutr. Biochem., in press [DOI] [PubMed] [Google Scholar]
Associated Data
This section collects any data citations, data availability statements, or supplementary materials included in this article.