

Abstract
Recent studies on the diazotrophic cyanobacterium Trichodesmium erythraeum (IMS101) showed that increasing CO2 partial pressure (pCO2) enhances N2 fixation and growth. Significant uncertainties remain as to the degree of the sensitivity to pCO2, its modification by other environmental factors, and underlying processes causing these responses. To address these questions, we examined the responses of Trichodesmium IMS101 grown under a matrix of low and high levels of pCO2 (150 and 900 μatm) and irradiance (50 and 200 μmol photons m−2 s−1). Growth rates as well as cellular carbon and nitrogen contents increased with increasing pCO2 and light levels in the cultures. The pCO2-dependent stimulation in organic carbon and nitrogen production was highest under low light. High pCO2 stimulated rates of N2 fixation and prolonged the duration, while high light affected maximum rates only. Gross photosynthesis increased with light but did not change with pCO2. HCO3− was identified as the predominant carbon source taken up in all treatments. Inorganic carbon uptake increased with light, but only gross CO2 uptake was enhanced under high pCO2. A comparison between carbon fluxes in vivo and those derived from 13C fractionation indicates high internal carbon cycling, especially in the low-pCO2 treatment under high light. Light-dependent oxygen uptake was only detected under low pCO2 combined with high light or when low-light-acclimated cells were exposed to high light, indicating that the Mehler reaction functions also as a photoprotective mechanism in Trichodesmium. Our data confirm the pronounced pCO2 effect on N2 fixation and growth in Trichodesmium and further show a strong modulation of these effects by light intensity. We attribute these responses to changes in the allocation of photosynthetic energy between carbon acquisition and the assimilation of carbon and nitrogen under elevated pCO2. These findings are supported by a complementary study looking at photosynthetic fluorescence parameters of photosystem II, photosynthetic unit stoichiometry (photosystem I:photosystem II), and pool sizes of key proteins in carbon and nitrogen acquisition.
Human-induced climate change will significantly alter the marine environment within the next century and beyond. Future scenarios predict an increase from currently approximately 380 to about 750 to 1,000 μatm CO2 partial pressure (pCO2) in the atmosphere until the end of this century (Raven et al., 2005; Raupach et al., 2007). As the ocean takes up this anthropogenic CO2, dissolved inorganic carbon (DIC) in the surface ocean increases while the pH decreases (Wolf-Gladrow et al., 1999). Rising global temperatures will increase surface ocean stratification, which may affect the light regime in the upper mixed layer as well as nutrient input from deeper waters (Doney, 2006). Uncertainties remain regarding both the magnitude of the physicochemical changes and the biological responses of organisms, including species and populations of the oceanic primary producers at the basis of the food webs.
In view of potential ecological implications and feedbacks on climate, several studies have examined pCO2 sensitivity in phytoplankton key species (Burkhardt and Riebesell, 1997; Riebesell et al., 2000; Rost et al., 2003; Tortell et al., 2008). Pronounced responses to elevated pCO2 were observed in N2-fixing cyanobacteria (Barcelos é Ramos et al., 2007; Hutchins et al., 2007; Levitan et al., 2007; Fu et al., 2008; Kranz et al., 2009), which play a vital role in marine ecosystems by providing a new source of biologically available nitrogen species to otherwise nitrogen-limited regions. Recent studies focused on the impact of different environmental factors on the filamentous Trichodesmium species, which is known for high abundance and the formation of massive blooms in tropical and subtropical areas (Capone et al., 2005; Mahaffey et al., 2005). Higher pCO2 levels stimulated growth rates, biomass production, and N2 fixation (Hutchins et al., 2007; Levitan et al., 2007; Kranz et al., 2009) and affected inorganic carbon acquisition of the cells (Kranz et al., 2009). While elevated sea surface temperatures are predicted to shift the spatial distribution of Trichodesmium species toward higher latitudes (Breitbarth et al., 2007), the combined effects of pCO2 and temperature may favor this species and extend its niche even farther (Hutchins et al., 2007; Levitan et al., 2010a). An increase in the average light intensity, caused by the predicted shoaling of the upper mixed layer, may further stimulate photosynthesis and thus growth and N2 fixation of Trichodesmium (Breitbarth et al., 2008). To our knowledge, the combined effects of light and pCO2 have not been studied yet, although these environmental factors are likely to influence photosynthesis and other key processes in Trichodesmium.
To understand the responses of an organism to changes in environmental conditions, metabolic processes must be studied. In Trichodesmium, photosynthetically generated energy (ATP and NADPH) is primarily used for the fixation of CO2 in the Calvin-Benson cycle. A large proportion of this energy, however, is also required for the process of N2 fixation via nitrogenase and for the operation of a CO2-concentrating mechanism (CCM). The latter involves active uptake of inorganic carbon, which functions to increase the rate of carboxylation reaction mediated by Rubisco. This ancient and highly conserved enzyme is characterized by low affinities for its substrate CO2 and a susceptibility to a competing reaction with oxygen (O2) as substrate (Badger et al., 1998); the latter initiates photorespiration. As cyanobacterial Rubisco possesses one of the lowest CO2 affinities among phytoplankton (Badger et al., 1998), a considerable amount of resources have to be invested to achieve sufficient rates of carbon fixation and to avoid photorespiration. A first step toward a mechanistic understanding of responses in Trichodesmium has been taken by Levitan et al. (2007), focusing on pCO2 dependency of nitrogenase activity and photosynthesis. Subsequently, Kranz et al. (2009) described variations in CCM efficiency with pCO2 and suggested that the observed plasticity in CCM regulation allowed energy reallocation under high pCO2, which may explain the observed pCO2-dependent changes in nitrogenase activity, growth, and elemental composition (Barcelos é Ramos et al., 2007; Hutchins et al., 2007; Levitan et al., 2007).
In this study, we measured growth responses as well as metabolic key processes in Trichodesmium erythraeum (IMS101) under environmental conditions that likely alter the energy budget and/or energy allocation of the cell. Cultures were acclimated to a matrix of low and high pCO2 (150 and 900 μatm) at two different light intensities (50 and 200 μmol photons m−2 s−1). For each of the four treatments, changes in growth rates, elemental ratios, and the accumulation of particulate carbon and nitrogen were measured. Metabolic processes (gross photosynthesis, CCM activity, and O2 uptake) were obtained by means of membrane-inlet mass spectrometry (MIMS), while N2 fixation was detected by gas chromatography. As these processes may vary over the diurnal cycle in Trichodesmium (Berman-Frank et al., 2001; Kranz et al., 2009), measurements were performed in the morning and around midday. The results on metabolic processes were accompanied by measurements of the fluorescence of PSII, ratios of the photosynthetic units (PSI:PSII), and pool sizes of key proteins involved in carbon and nitrogen fixation as well as assimilation (Levitan et al., 2010b).
RESULTS
Elemental Composition, and Growth and Production Rates
Cellular quotas of particulate organic carbon (POC) and particulate organic nitrogen (PON) increased with both pCO2 and light, while particulate phosphorus (PP) quotas remained constant in all treatments (one-way ANOVA for PP; P > 0.05; Table I). POC quota ranged between 3.79 ± 0.09 and 4.51 ± 0.21 pmol cell−1 under low light and 4.60 ± 0.46 and 5.02 ± 0.57 pmol cell−1 under high light (Table I). Elevated pCO2 significantly increased the POC cell−1 by 19% at low light (t test; P = 0.001) and by 9% (although not significant) at high light (t test; P = 0.226). PON quotas exhibited similar patterns, with values ranging from 0.59 ± 0.03 to 0.88 ± 0.06 pmol cell−1 under low light and 0.86 ± 0.08 to 1.04 ± 0.09 pmol cell−1 under high light at low and high pCO2, respectively (Table I). The pCO2-dependent changes in the PON quota were even larger than those of the POC, with a significant increase by 47% under low light (t test; P < 0.001) and 21% under high light (t test; P < 0.05). Respective carbon-nitrogen ratios decreased from 6.41 ± 0.39 to 5.04 ± 0.15 under low light (one-way ANOVA followed by a posthoc test; P < 0.05) and from 5.25 ± 0.19 to 4.85 ± 0.10 under high light with increasing pCO2 (one-way ANOVA followed by a posthoc test; P = 0.09; Table I). Chlorophyll a (chl a) cell−1 did not differ significantly between treatments, excluding cells grown under low light and low pCO2 (one-way ANOVA followed by a posthoc test; P < 0.001; Table I).
Table I. Elemental composition of Trichodesmium IMS101 under a matrix of pCO2 and light.
Values represent means of triplicate cultures, sampled over several days, all within exponential phase. Errors are ±1 sd (n > 10).
| Elemental Composition | Acclimation |
|||
| Low Light (50 μmol Photons m−2 s−1) |
High Light (200 μmol Photons m−2 s−1) |
|||
| 150 μatm pCO2 | 900 μatm pCO2 | 150 μatm pCO2 | 900 μatm pCO2 | |
| POC (pmol carbon cell−1)a | 3.79 ± 0.09 | 4.51 ± 0.21 | 4.60 ± 0.46 | 5.02 ± 0.57 |
| PON (pmol nitrogen cell−1)a | 0.59 ± 0.03 | 0.88 ± 0.06 | 0.86 ± 0.08 | 1.04 ± 0.09 |
| PP (fmol phosphorus cell−1) | 73 ± 9 | 78 ± 9 | 70 ± 14 | 71 ± 4 |
| Chl a (pg cell−1)b | 0.47 ± 0.04 | 0.72 ± 0.05 | 0.67 ± 0.14 | 0.69 ± 0.08 |
| Carbon:nitrogen (mol:mol)c | 6.41 ± 0.39 | 5.04 ± 0.15 | 5.25 ± 0.19 | 4.85 ± 0.10 |
t test: significant difference between high-light acclimations.
t test: significant difference between low-light acclimations.
One-way ANOVA: significant difference between all acclimations.
Growth increased significantly with both elevated pCO2 and higher light (one-way ANOVA followed by a posthoc test; P < 0.001). There was no difference between growth rate estimates whether based on changes in cell densities, chl a, POC, or PON; thus, they are reported as mean values. Growth rates ranged between 0.15 ± 0.03 and 0.24 ± 0.03 d−1 at low light and from 0.38 ± 0.02 to 0.42 ± 0.02 d−1 at high light (Fig. 1A). Elevated pCO2 increased growth rates by 60% under low light and by 11% under high light. Rates of POC production also increased significantly under elevated pCO2 (t test; P < 0.001), ranging between 0.57 ± 0.11 and 1.10 ± 0.17 pmol carbon cell−1 d−1 under low light and between 1.76 ± 0.26 and 2.12 ± 0.34 pmol carbon cell−1 d−1 under high light (Fig. 1B). The PON production increased under elevated pCO2 (t test; P < 0.001), ranging between 0.09 ± 0.02 and 0.21 ± 0.04 pmol nitrogen cell−1 d−1 under low light and between 0.33 ± 0.05 and 0.44 ± 0.06 pmol nitrogen cell−1 d−1 under high light (Fig. 1C). Notably, at low light, elevated pCO2 caused the strongest relative increase in POC and PON production, being 93% and 133% higher than under low pCO2, respectively.
Figure 1.

Responses of Trichodesmium IMS101 to different light (50 and 200 μmol photons m−2 s−1) and pCO2 (150 and 900 μatm) levels. A, Growth rates. B, Production rates of POC. C, Production rates of PON. Numbers in brackets denote the relative increase from low to high pCO2 levels. Asterisks between bars indicate significant differences between low and high pCO2 levels (t test; P < 0.05). Error bars indicate 1 sd (n ≥ 10).
N2 Fixation
Both the diurnal pattern and the rates of N2 fixation responded strongly to pCO2 and light (Fig. 2). For the low-light acclimations, N2 fixation peaked 3 h after the beginning of the photoperiod with maximum rates, which range between 1.61 ± 0.51 and 3.03 ± 0.56 μmol N2 mg chl a−1 h−1 for low and high pCO2, respectively. Under high light, both pCO2 acclimations peaked about 5 h after the onset of light, and maximum rates were 15.45 ± 1.29 and 19.21 ± 6.48 μmol N2 mg chl a−1 h−1 for the low and high pCO2 treatments, respectively (Fig. 2A). Elevated pCO2 increased maximum rates about 2-fold under low light, while maximum rates appear not to differ at high light. More prominently, under high light, elevated pCO2 led to a prolonged phase with high N2 fixation rates, which lasted until the end of the photoperiod. This pCO2 effect on the diurnal cycle was also present but less pronounced under low light. No N2 fixation occurred during the dark period in all acclimations. As a result of the higher fixation rates and the prolonged N2 fixation under elevated pCO2, the integrated diurnal values of N2 fixation increased by 200% and 112% under low and high light, respectively (Fig. 2B).
Figure 2.

A, Diurnal cycle of nitrogen fixation of Trichodesmium IMS101 at the different light and pCO2 acclimations. Measurements were obtained from duplicate cultures. Error bars indicate 1 sd. The black and white areas at top correspond to the dark and light periods of the diurnal cycle. B, Integrated diurnal N2 fixation rate from A. Numbers in brackets denote the relative increase from low to high pCO2 levels. Error bars indicate 1 sd (n ≥ 2).
Photosynthetic O2 Evolution and O2 Uptake
Gross O2 evolution increased with light but was neither affected by pCO2 nor varied among measurements performed between 2 to 3 h (am) and 6 to 7 h (pm) after the beginning of the photoperiod (Fig. 3A; Table II). O2 evolution ranged between 119 ± 22 and 156 ± 4 μmol O2 mg chl a−1 h−1 at low light and between 432 ± 153 and 534 ± 51 μmol O2 mg chl a−1 h−1 at high light (Fig. 3A; Table II). O2 uptake in the light was present in all treatments (Fig. 3B), yet rates were, with one exception, similar to those determined in the dark (Table II). At 150 μatm pCO2 and 200 μmol photons m−2 s−1, O2 uptake in the light significantly exceeded dark respiration by about 140% in the morning and by about 70% during midday (t test; P < 0.001; Table II). Light-dependent O2 uptake was also induced when cells acclimated to 50 μmol photons m−2 s−1 were exposed to 200 μmol photons m−2 s−1 during the measurements, irrespective of the pCO2 level of the acclimation (Table II). Such instantaneous effects were also observed in the gross O2 evolution (i.e. low-light-acclimated cells exposed to high light yielded rates similar to cells that had been acclimated to high light).
Figure 3.

O2 fluxes of Trichodesmium IMS101 measured between 2 to 3 h (am; plain bars) and 6 to 7 h (pm; striped bars) after the beginning of the photoperiod. A, Gross O2 evolution rate. B, Gross O2 uptake rate in the light. Error bars indicate 1 sd (n ≥ 2).
Table II. O2 fluxes in Trichodesmium IMS101 according to the method of Peltier and Thibault (1985).
Values represent rates measured between 2 to 3 h (am) and 6 to 7 h (pm) after the beginning of the photoperiod. Blanks denote no measurement. Errors are ±1 sd (n ≥ 3). No sd is given when only one measurement was obtained.
| Oxygen Fluxes | Assay Condition | Acclimation |
||||
| Low Light (50 μmol Photons m−2 s−1) |
High Light (200 μmol Photons m−2 s−1) |
|||||
| 150 μatm pCO2 | 900 μatm pCO2 | 150 μatm pCO2 | 900 μatm pCO2 | |||
| Gross O2 evolution (μmol O2 mg chl a−1 h−1) | Low light | am | 143 ± 16 | 119 ± 22 | ||
| pm | 156 ± 4 | 135 ± 17 | ||||
| High light | am | 453 | 538 ± 70 | 454 ± 28 | 534 ± 51 | |
| pm | 612 | 429 ± 42 | 486 ± 81 | 432 ± 153 | ||
| O2 uptake in the light (μmol O2 mg chl a−1 h−1) | Low light | am | 81 ± 21 | 46 ± 18 | ||
| pm | 27 ± 12 | 23 ± 23 | ||||
| High light | am | 200 | 137 ± 33 | 254 ± 49 | 117 ± 42 | |
| pm | 81 | 83 ± 62 | 115 ± 57 | 123 ± 27 | ||
| O2 uptake in the dark (μmol O2 mg chl a−1 h−1) | No light | am | 115 ± 10 | 83 ± 11 | 106 ± 44 | 126 ± 30 |
| pm | 25 ± 8 | 24 ± 7 | 67 ± 13 | 111 ± 24 | ||
Inorganic Carbon Acquisition and Leakage
HCO3− was the major inorganic carbon source taken up by Trichodesmium in all acclimations, while CO2 contributed only a minor fraction. Rates of HCO3− uptake were affected by both light and pCO2, ranging from 82 ± 19 to 121 ± 25 μmol HCO3− mg chl a−1 h−1 in low light and from 224 ± 30 to 287 ± 50 μmol HCO3− mg chl a−1 h−1 in high light at low and high pCO2, respectively (Table III). Under low light, HCO3− uptake decreased slightly, although not significantly, when cultures were acclimated to high pCO2 (one-way ANOVA followed by a posthoc test; P > 0.05). Under high light, HCO3− uptake remained relatively stable at both pCO2 levels. Rates of gross CO2 uptake were affected by both light and pCO2, ranging between 10 ± 1 and 22 ± 10 μmol CO2 mg chl a−1 h−1 in low light and between 59 ± 6 and 147 ± 31 μmol CO2 mg chl a−1 h−1 at high light at low and high pCO2, respectively (Table II). To illustrate the contribution of each carbon species to the total carbon uptake, the ratio of HCO3− uptake to gross CO2 uptake is depicted in Figure 4. Ratios ranged between 2 and 10, reflecting that HCO3− was the major carbon species taken up in all treatments. The increased relevance of CO2 uptake was indicated by the declining HCO3−:CO2 uptake ratios under elevated pCO2 and high light (Fig. 4). Rates of net O2 evolution obtained in these assays (data not shown) were similar to those obtained in the assays on O2 fluxes (Table II).
Table III. Carbon fluxes in Trichodesmium IMS101 measured according to Badger et al. (1994).
Values represent rates measured between 2 to 3 h (am) and 6 to 7 h (pm) after the beginning of the photoperiod. Errors are ±1 sd (n ≥ 3).
| Inorganic Carbon Fluxes | Assay Condition | Acclimation |
||||
| Low Light (50 μmol Photons m−2 s−1) |
High Light (200 μmol Photons m−2 s−1) |
|||||
| 150 μatm pCO2 | 900 μatm pCO2 | 150 μatm pCO2 | 900 μatm pCO2 | |||
| Net fixation (μmol C mg chl a−1 h−1) | Same as acclimation | am | 98 ± 4 | 69 ± 7 | 301 ± 9 | 226 ± 55 |
| pm | 92 ± 10 | 52 ± 8 | 330 ± 40 | 290 ± 15 | ||
| HCO3− uptake (μmol HCO3− mg chl a−1 h−1) | Same as acclimation | am | 105 ± 8 | 82 ± 19 | 247 ± 50 | 224 ± 30 |
| pm | 121 ± 25 | 98 ± 8 | 287 ± 50 | 282 ± 28 | ||
| CO2 uptake (μmol CO2 mg chl a−1 h−1) | Same as acclimation | am | 10 ± 1 | 22 ± 10 | 59 ± 6 | 90 ± 19 |
| pm | 17 ± 5 | 19 ± 6 | 61 ± 8 | 147 ± 31 | ||
Figure 4.

HCO3−:CO2 uptake ratio in Trichodesmium IMS101 obtained from HCO3− and gross CO2 uptake rates (Table III) measured between 2 to 3 h (am; plain bars) and 6 to 7 h (pm; striped bars) after the beginning of the photoperiod. Error bars indicate 1 sd (n ≥ 3).
Cellular leakage (CO2 efflux:gross carbon uptake) determined by MIMS measurements was generally low under low pCO2, ranging between 0.24 ± 0.13 and 0.29 ± 0.19 in the low- and high-light acclimation, respectively (Table IV). In the high-pCO2 acclimation, leakage was 0.41 ± 0.09 and 0.31 ± 0.14 in the low- and high-light acclimation, respectively. Leakage estimates deduced from 13C fractionation were much higher than those measured directly by MIMS. In the low-pCO2 acclimations, leakage was 0.57 ± 0.02 at high light and 0.84 ± 0.03 at low light, and it was about 0.90 in both high-pCO2 acclimations (Table IV). These leakage estimates were derived from 13C fractionation (εp), ranging between 12.94‰ ± 0.78‰ and 7.19‰ ± 0.58‰ under low pCO2 at low and high light, respectively. Higher εp values were measured under elevated pCO2, being 15.69‰ ± 1.12‰ and 16.54‰ ± 0.10‰ at low and high light, respectively.
Table IV. Leakage (CO2 efflux:gross carbon uptake) under respective culture conditions for Trichodesmium IMS101.
Values for two different approaches for leakage estimation are presented. Errors are ±1 sd (n > 3).
| Approach | Acclimation |
|||
| Low Light (50 μmol Photons m−2 s−1) |
High Light (200 μmol Photons m−2 s−1) |
|||
| 150 μatm pCO2 | 900 μatm pCO2 | 150 μatm pCO2 | 900 μatm pCO2 | |
| MIMS-based leakage | 0.24 ± 0.13 | 0.29 ± 0.19 | 0.41 ± 0.09 | 0.31 ± 0.14 |
| 13C-based leakage | 0.84 ± 0.03 | 0.92 ± 0.04 | 0.57 ± 0.02 | 0.90 ± 0.01 |
DISCUSSION
The results of our study confirm the pronounced pCO2 effect on N2 fixation and growth in Trichodesmium and further show a strong modulation of these effects by irradiance. Cellular gas-exchange measurements revealed pCO2-dependent changes in rates of N2 fixation over the course of the photoperiod as well as in modes of carbon acquisition. Taken together, our results indicate the reallocation of photosynthetic energy between both processes. Further evidence for this is presented in our complementary study (Levitan et al., 2010b).
Elemental Ratios, and Growth and Production Rates
Trichodesmium demonstrates high plasticity in growth and/or elemental composition with changing levels of pCO2 (Barcelos é Ramos et al., 2007; Hutchins et al., 2007; Levitan et al., 2007; Kranz et al., 2009) and light (Breitbarth et al., 2008). The observed responses to these abiotic factors provide prima facie evidence for the increasing importance of Trichodesmium species in future oceans. In our study, the combined effect of pCO2 and light, two factors that are predicted to change in the future ocean, were studied on Trichodesmium IMS101 and are discussed on an ecophysiological level.
The elemental composition of Trichodesmium cells showed an increase in POC and PON quotas with enhanced pCO2 concentrations (Table I), a finding consistent with Kranz et al. (2009) but contradicting Barcelos é Ramos et al. (2007), who reported decreasing POC and PON quotas with elevated pCO2. No pCO2-dependent changes in elemental stoichiometry of carbon to nitrogen were observed in previous studies with light intensities between 80 and 150 μmol photons m−2 s−1 (Barcelos é Ramos et al., 2007; Hutchins et al., 2007; Levitan et al., 2007; Kranz et al., 2009). However, under 50 μmol photons m−2 s−1, lower carbon-to-nitrogen ratios were obtained under elevated pCO2 (Table I), reflecting a greater pCO2 effect on the PON than on the POC quota under low light. Cell quotas for PP did not differ between acclimations (Table I), a finding that disagrees with decreasing organic phosphorus quotas under elevated pCO2 observed by Barcelos é Ramos et al. (2007). The pCO2-dependent increases in carbon-to-phosphorus and/or nitrogen-to-phosphorus ratios observed in this and previous studies imply that more biomass can be produced per available phosphorus.
The observed increase in growth rates under elevated pCO2 (Fig. 1A) is consistent with previous findings from Trichodesmium (Barcelos é Ramos et al., 2007; Hutchins et al., 2007; Levitan et al., 2007). Yet, the magnitude in pCO2-dependent stimulation differed strongly between studies and is probably associated with the different light intensities applied (approximately 80–150 μmol photons m−2 s−1; Barcelos é Ramos et al., 2007; Hutchins et al., 2007; Levitan et al., 2007; Kranz et al., 2009). As our study focused on different pCO2 levels in combination with low and high light, we could indeed verify that light levels strongly modify the responses of Trichodesmium to pCO2 (Fig. 1; Table I). Like the responses in elemental composition, the relative changes in growth rates to elevated pCO2 were largest under low light.
Due to the described effects on elemental composition and growth rates, the buildup of biomass in Trichodesmium increased strongly under elevated pCO2 (Fig. 1, B and C). The pCO2-dependent stimulation was highest under low light, with a 93% increase for POC production and a 133% increase for PON production relative to low pCO2. Hutchins et al. (2007) measured 14C incorporation over 24 h, an approach comparable to POC production rates in our study, and observed a 40% to 50% increase in carbon fixation when elevating the pCO2 from 380 to 750 μatm pCO2. Such responses in growth or POC production rates to elevated pCO2 exceed those reported for other important marine phytoplankton groups such as diatoms and coccolithophores (Burkhardt et al., 1999; Zondervan et al., 2002; Langer et al., 2006) and demonstrate the exceptionally high sensitivity of Trichodesmium to pCO2.
The strong responses in growth and POC and PON production rates corroborate previous publications stating that in Trichodesmium, central physiological processes must be pCO2 sensitive. While processes like CCMs and carbon fixation are intrinsically CO2 dependent (Giordano et al., 2005), a direct CO2 effect on processes like N2 fixation appeared unlikely. Furthermore, the observation that the pCO2 sensitivity of POC and PON production rates is altered by light levels hints at an essential role of energy availability and allocation that we subsequently explored by measuring metabolic processes like N2 fixation, gross photosynthetic O2 evolution, CCM activity, as well as the Mehler reaction. Our complementary study focuses on these processes by measuring the respective protein pools (Levitan et al., 2010b).
N2 Fixation
Since Trichodesmium cultures were grown in artificial medium without nitrogen sources and thus had to acquire all nitrogen for growth by fixation of dissolved N2, the differences in PON production between treatments must be attributed to the respective changes in N2 fixation. Under both low-light acclimations, N2 fixation peaked about 3 h after onset of the light and showed reduced activities over midday until the end of the photoperiod (Fig. 2A). This atypical diurnal pattern may be caused by an energy shortage imposed by the low light levels, which first and foremost affect energy-demanding processes such as N2 fixation. Despite energy shortage under low light, elevated pCO2 highly stimulated N2 fixation rates, which implies that more energy is available for this process. Under high light, maximum rates of N2 fixation rates were more than 6-fold higher than in the low-light acclimations (Fig. 2A) and peaked during midday (5 h after onset of the light), as typically reported for Trichodesmium (Berman-Frank et al., 2001). While under low pCO2, N2 fixation rates declined after the midday peak, high pCO2 levels resulted in a prolonged N2 fixation until the end of the photoperiod. Such combined effects by light and pCO2 on the diurnal patterns have not previously been reported and may indicate extended resource and energy availability for N2 fixation and a change in the regulation of nitrogenase (Levitan et al., 2010b).
As a consequence of the changes in rates and patterns of N2 fixation under high light and elevated pCO2, integrated N2 fixation rates over the day increased by 200% under low light and 112% under high light (Fig. 2B). N2 fixation by nitrogenase should be coupled to PON production (Fig. 1C), since N2 is the only nitrogen source available. While both approaches indeed confirm the strong pCO2 sensitivity in Trichodesmium, the relative stimulation by elevated pCO2 was larger for the integrated N2 fixation rates than those of the daily PON production (Figs. 1C and 2B). This apparent difference between acetylene reduction assay (i.e. gross N2 fixation) and PON production (i.e. net N2 fixation) could be explained by the loss of previously reduced N2 as dissolved organic nitrogen (Capone et al., 1994; Glibert and Bronk, 1994) or ammonia (Mulholland et al., 2004) to the medium. In our experimental setup with continuous gas exchange, a significant proportion of ammonia may in fact be stripped out and subsequently cannot be used for PON production.
Fixation of N2 and PON production differ in their demand for energy and resources. Consequently, pCO2-dependent changes in the availability of energy and resources may affect both processes differently. While N2 fixation by nitrogenase is mainly controlled by the availability of energy and electrons provided by the photosynthetic and respiratory pathways (a minimum of 16 ATP, eight electrons, and eight protons are required to reduce N2 to NH4+), the PON accumulation is regulated by glutamine synthetase (GS) and glutamine oxoglutarate aminotransferase (GOGAT), called the GS/GOGAT pathway. The primary substrates for the GS/GOGAT pathway are NH4+ and α-ketoglutarate, a respiratory intermediate of the citric acid cycle, and this pathway requires relatively little energy (one ATP, one NADPH + H+, and two protons to form one Glu). For a mechanistic understanding of these findings, it is important to look at possible regulations of key proteins in nitrogen metabolism (Levitan et al., 2010b).
What is the source of the additional energy and resources supporting the observed stimulation in N2 fixation and PON production under elevated pCO2? To answer this question, we compared the changes of energy generated in photosynthesis and energy consumed by processes involved in carbon metabolism.
Gross Photosynthesis
Photosynthesis generates energy and reductants that maintain metabolic processes such as N2 fixation, carbon assimilation, and biomass buildup in Trichodesmium. In this study, direct measurements of gross photosynthesis (O2 evolution from water splitting) yielded rates of photosynthetic electron generation, providing estimations about energy and reductant production. Regardless of pCO2, gross photosynthesis was greatly stimulated by light (Fig. 3A). Thus, the enhanced N2 fixation and PON production rates under high light (Figs. 1 and 2) can be explained by a higher supply of energy and reductants. Gross photosynthesis was insensitive to the applied pCO2 levels (Fig. 3A). This is comparable with results obtained by Levitan et al. (2007), reporting no change in O2 evolution for three different pCO2 acclimations. The production of energy and reductants is not only set by electron generation at PSII but strongly controlled by the downstream processes along the electron transport chain. For example, rapid cyclic electron transport around PSI would yield higher ATP production at the expense of NADPH. We examined these light/pCO2 effects in more detail at the level of the core proteins of PSII and PSI (Levitan et al., 2010b). Our findings show that elevated pCO2 did not alter the supply of energy provided by gross photosynthesis. Thus, energy-demanding processes related to carbon metabolism must have been down-regulated to explain the strong stimulation in nitrogen metabolism under elevated pCO2.
Inorganic Carbon Acquisition
Active acquisition of inorganic carbon is a mandatory process for the subsequent carbon fixation in the Calvin-Benson cycle. For the operation of these so-called CCMs, cyanobacteria like Trichodesmium need to invest a large amount of energy, which is primarily required due to the poor CO2 affinity of Rubisco (Badger et al., 1998). Trichodesmium IMS101 operates an active CCM based predominantly on the uptake of HCO3− (Kranz et al., 2009). The relative HCO3− contribution to the total carbon fixation was about 90% and remained rather constant under all applied pCO2 concentrations (150–1,000 μatm; Kranz et al., 2009). In this study, HCO3− was also the preferred carbon species in all treatments (Fig. 4; Table III). These results concur with studies showing that CCMs in marine cyanobacteria are generally based on the transport and accumulation of HCO3− within the cell (Price et al., 2008). In some cyanobacteria, internal pools of inorganic carbon were up to 1,000-fold higher than ambient concentrations (Kaplan et al., 1980), emphasizing the generally high energetic costs of their CCMs.
Despite the predominance of HCO3− transport, gross CO2 uptake rate increased under elevated pCO2 (Fig. 4; Table III). Genome analysis identified the NAD(P)H dehydrogenase complex (NDH14), a CO2 uptake system located at the thylakoid membrane (Ohkawa et al., 2001), to be present in Trichodesmium. This complex is considered to catalyze the conversion from CO2 to HCO3− (Badger et al., 2006) by utilizing reductants or electrons provided mostly by electron transport (Friedrich and Scheide, 2000; Price et al., 2002, 2008) and may generate extra ATP by shuffling protons through the Q cycle of the thylakoid membrane (Friedrich and Scheide, 2000; Price et al., 2002). HCO3− uptake, on the other hand, is mediated by BicA transporters that are located in the plasma membrane and function as Na+/HCO3− symporters (Price et al., 2004), which are indirectly energized by ATP hydrolysis. Consequently, the changes in HCO3− and CO2 uptake observed in our study (Fig. 4) may reflect changes in the activity of the CCM components and the availability and/or utilization of ATP, NADPH, or reduced ferredoxin. Furthermore, the changes in uptake ratios may indicate a shift between linear and cyclic electron transport (Li and Canvin, 1998).
The energetic costs associated with the operation of a CCM (Raven and Lucas, 1985) play a central role in the overall energy budget of the cell. Kranz et al. (2009) observed a high plasticity of CCM regulation, for instance in DIC affinities, in response to changes in pCO2 concentrations and over the photoperiod. Regulation of DIC affinities will likely alter the energy allocation between the CCM and other metabolic processes. The ability of Trichodesmium to down-regulate its DIC affinities under elevated pCO2 (Kranz et al., 2009) and the observed up-regulation in the CO2 uptake system (Fig. 4; Table III), therefore, could provide parts of the energetic “surplus” to explain the stimulation in nitrogen metabolism and/or organic carbon production.
Although the POC production rates increased significantly under elevated pCO2 (Fig. 1B), rates of net carbon fixation in the MIMS assays were not stimulated in the high-pCO2 treatment (Table III). Part of this apparent contradiction may result from the fact that POC production rates cover several generations, including dark and light phases, while net carbon fixation is based on “instantaneous” measurements at specific time points during the photoperiod. Such discrepancies between direct measurements of carbon fixation and daily POC turnover rates in Trichodesmium species were also reported for field populations (Mulholland et al., 2006). As Trichodesmium IMS101 was able to saturate carbon fixation in the assays at pCO2 concentrations of the respective acclimations (data not shown; Kranz et al., 2009), we conclude that the observed changes in POC production cannot be caused by direct effects on the carboxylation efficiency of Rubisco but rather are due to changes in energy availability for downstream processes. Additional information on Rubisco quantities, energy requirements, and availability are provided by Levitan et al. (2010b).
Leakage and Internal Inorganic Carbon Cycling
In addition to the processes involved in inorganic carbon uptake and accumulation, the ability to reach high rates of carbon fixation also depends on the loss of inorganic carbon via leakage (CO2 efflux:gross carbon uptake). MIMS-based estimates of leakage ranged between 0.24 and 0.41 in this study (Table IV), confirming values published previously for Trichodesmium (Kranz et al., 2009). Similar leakage estimates have been determined for other species of phytoplankton (Rost et al., 2006b; Trimborn et al., 2008), and such values seem reasonable for operating a cost-efficient CCM (Raven and Lucas, 1985). The leakage estimates obtained by 13C fractionation, on the other hand, were found to be as high as 0.9 (Table IV), a value that would question the benefits of a CCM. It should be noted, however, that 13C-based leakage estimates are dependent on several assumptions (e.g. the intrinsic fractionation of Rubisco). Also, this approach considers fluxes over the plasma membrane only. However, any kind of internal inorganic carbon cycling would increase 13C fractionation as the accumulation of 13CO2 at the site of carboxylation is lowered (Schulz et al., 2007). Following Sharkey and Berry (1985), high 13C fractionation values caused by internal inorganic carbon cycling would then be misinterpreted as high leakage over the plasma membrane. Thus, the large differences between MIMS- and 13C-based leakage estimates in our study likely reflect significant internal inorganic carbon cycling for Trichodesmium. High inorganic carbon cycling has also been indicated for other cyanobacteria based on exchange of 18O from doubly labeled CO2 in the light (Price et al., 2002, and refs. therein).
The NDH CO2 uptake systems in cyanobacteria may be involved in both uptake of CO2 and inorganic carbon cycling as a leakage prevention mechanism (Maeda et al., 2002; Price et al., 2002, 2008). The overestimation of 13C-based leakage found in the high-pCO2 treatments (Table IV) may thus reflect higher internal inorganic carbon cycling mediated by the NDH14 in Trichodesmium. Such inorganic carbon cycling appears consistent with the higher PSI-to-PSII ratio at elevated pCO2 (Levitan et al., 2010b). An increasing role of NDH14 is also indicated by the higher gross CO2 uptake rates under these conditions (Table III). As a consequence of higher inorganic carbon cycling, more ATP may be produced under elevated pCO2 (Price et al., 2002), which in turn could fuel the observed higher N2 fixation (Fig. 2B). In the low-pCO2 and high-light acclimation, the relatively small differences in leakage estimates indicate rather low internal inorganic carbon cycling (Table IV). This finding may be attributed to light-dependent O2 uptake, which was observed only for this treatment (Fig. 3B; see “Discussion” below). Fluorescence data shown by Levitan et al. (2010b) also indicate low cyclic electron transport. However, further investigations on the dynamics of leakage and possible regulations by NDH14 in Trichodesmium have to be conducted to understand this essential process within its CCM.
Light-Dependent O2 Uptake
Processes that reduce the O2 concentration within the cell may play an important function in supporting and protecting nitrogenase in Trichodesmium from oxidative degradation (Kana, 1993; Berman-Frank et al., 2001; Milligan et al., 2007). In particular, the photoreduction of O2 by the Mehler reaction catalyzes the conversion of O2 to water. Changes in this O2-scavenging process, therefore, could influence N2 fixation rates. The Mehler reaction was also identified to be involved in photoprotection in other photoautotrophic species (Osmond and Grace, 1995; Osmond et al., 1997; Asada, 1999; Foyer and Noctor, 2000). To test for the presence and role of the Mehler reaction in our different acclimations, light-dependent O2 uptake was measured.
In low-light-acclimated cells, in situ rates of O2 uptake in the light were similar to the rates measured in the dark (Fig. 3B; Table II). Irrespective of the light treatment, the O2 uptake rates were unaffected by the inhibition of PSII activity using 3-(3,4-dichlorophenyl)-1,1-dimethylurea (data not shown). Both observations indicate that the Mehler reaction was not present in Trichodesmium IMS101 grown under low light, regardless of pCO2. Moreover, they indicate that the respiratory O2 uptake via the terminal oxidase is not repressed during illumination. These findings provide an additional perspective to the current understanding of the Mehler reaction and the terminal oxidase activity in Trichodesmium (Milligan et al., 2007). It is likely that under the low light levels applied here, the Mehler reaction may not be beneficial, as it competes for the “scarce” electrons and its operation would decrease the energy supply for carbon and nitrogen fixation. In addition, the need for O2 scavenging under low light is reduced because of low photosynthetic O2 production relative to respiratory O2 uptake (Table II).
In high-light-acclimated cells, the Mehler reaction was only detected under low pCO2. Gross CO2 uptake (i.e. NDH14 activity), inorganic carbon cycling, as well as nitrogenase activity were lower in this treatment than under high pCO2. As these processes can use electrons supplied by ferredoxin, lower activities may enhance the proportion of reduced ferredoxin and impede electron transport. Under these conditions, the Mehler reaction could act as a shunt for routing excess electrons to avoid an overreduction and damage of PSII. Under elevated pCO2, where the Mehler reaction was not observed, rates of gross CO2 uptake, N2 fixation, as well as POC and PON production may provide sufficient electron sinks, thereby reducing the need for the Mehler reaction.
Short-term exposure of the cells acclimated to 50 μmol photons m−2 s−1 to 200 μmol photons m−2 s−1 (6 min) resulted in a strong increase in light-dependent O2 uptake, irrespective of the applied pCO2 levels (Table II). The apparent operation of the Mehler reaction under these conditions may reduce the sudden electron flux within the electron transport chain, which otherwise may cause photodamage. Furthermore, the Mehler reaction may compensate for some of the light-stimulated O2 evolution and thus act as a protection mechanism for nitrogenase. Such a relationship between the Mehler reaction and N2 fixation was observed for Trichodesmium in several studies (Kana, 1993; Milligan et al., 2007). However, different growth conditions and the use of significantly higher light levels during these experiments (Kana, 1993; Milligan et al., 2007) could also account for the detection of the Mehler reaction in previous studies.
Under the conditions applied in this study, the Mehler reaction does not contribute to the observed stimulation in N2 fixation under elevated pCO2. Our findings suggest that under our experimental conditions, the Mehler reaction in Trichodesmium is involved in photoprotection rather than in O2 scavenging. This proposed role may be advantageous in view of the high and variable light levels typical for the natural environments of Trichodesmium (La Roche and Breitbarth, 2005).
CONCLUSION
Our data on production rates and elemental composition bear important implications for future changes in the relevant biogeochemical cycles. The pCO2-dependent stimulation in the rate of biomass production may increase the CO2 drawdown in the upper mixed layer and affect the vertical transport of organic matter. This “fertilization” effect on Trichodesmium may also expand to other phytoplankton, as this important diazotroph fixes N2 into particulate and dissolved compounds, thus providing a major source of bioavailable nitrogen to oligotrophic oceans (Capone et al., 2005). In addition to the rate of production, biomass buildup is ultimately limited by the availability of other nutrients such as phosphorus. Consequently, the observed increase in carbon to phosphorus and/or nitrogen to phosphorus under elevated pCO2 may imply that more biomass can be produced per available phosphorus, for instance over the course of a Trichodesmium bloom. In terms of the light-dependent changes in CO2 sensitivity, the rise in pCO2 may have a stronger effect on Trichodesmium thriving in deeper waters than for cells close to the surface. Furthermore, new information about metabolic key pathways and related proteins involved in carbon and nitrogen metabolism are provided in this and the complementary study (Levitan et al., 2010b). Although Trichodesmium can saturate carbon fixation even at low pCO2 levels by operating an efficient CCM, this comes at an energetic cost and competes with other energy-demanding processes like N2 fixation and the operation of the Calvin cycle. The observed responses to elevated pCO2 could not be attributed to enhanced energy generation via gross photosynthesis. Instead, energetic costs of the CCM were reduced under high pCO2, providing a surplus of energy and reductants that in turn enabled higher rates of N2 fixation and PON and POC production and growth. Future studies should investigate whether phosphorus and iron limitation, often prevailing in oligotrophic waters, may modify the described effects of this study.
MATERIALS AND METHODS
Culture Conditions
Cultures of Trichodesmium erythraeum (strain IMS101; originally isolated by Prufert-Bebout et al., 1993) were grown at 25°C in 0.2-μm-filtered unbuffered nitrogen-free artificial seawater (YBCII medium; Chen et al., 1996). All cells were cultured as single filaments, grown in 1-L cylindrical glass flasks (diameter of 7 cm), and incubated in a light:dark cycle (12:12 h) with light provided by white fluorescent bulbs (Osram; BIOLUX) at two different light intensities (50 and 200 μmol photons m−2 s−1), representing light-limiting and light-saturating values for Trichodesmium according to Breitbarth et al. (2008). Cultures were continuously bubbled with air containing different pCO2 values of 150 and 900 μatm. The bubbling was sufficient to avoid aggregate formation but did not alter the integrity of the filaments. CO2 gas mixtures were generated with gas-mixing pumps (Digamix 5KA18/8-F and 5KA36/8-F; Woesthoff) using CO2-free air (Nitrox CO2RP280; Domnick Hunter) and pure CO2 (Air Liquide Deutschland). Dilute batch cultivation (i.e. regular dilution with fresh, preequilibrated medium) ensured that the carbonate chemistry remained constant and cells stayed in the midexponential growth phase. Cultures in which the pH shifted (pH shift > 0.06) in comparison with a reference (i.e. cell-free medium at the respective pCO2 levels) were excluded from further analysis.
Seawater Carbonate Chemistry
Samples for total alkalinity (TA) were taken from the culture filtrate (Whatman GFF filter; approximately 0.6 μm), stored in 100-mL borosilicate bottles at room temperature, and measured by potentiometric titration (Brewer et al., 1981) with an average precision of ±10 μmol kg−1. TA was calculated from linear Gran Plots (Gran, 1952). TA measurements were calibrated with certified reference material (Dr. Andrew Dickson, Scripps Institution of Oceanography). The pHNBS was determined every morning using a pH/ion meter (model 713 pH meter; Metrohm). The carbonate system was calculated from TA, pHNBS, temperature, salinity, and phosphate using CO2Sys (Lewis and Wallace, 1998). Equilibrium constants of Mehrbach et al. (1973) refitted by Dickson and Millero (1987) were chosen. Carbonate chemistry for the respective pCO2 treatments are given in Table V.
Table V. Parameters of the seawater carbonate system.
Values were calculated from TA, pH, phosphate, temperature, and salinity using the CO2Sys program (Lewis and Wallace, 1998). Errors are ±1 sd (n > 3).
| pCO2 | CO2 | TA | pH | DIC |
| μatm | μmol kg−1 | μmol kg−1 | NBS | μmol kg−1 |
| 150 | 3.8 ± 0.3 | 2,487 ± 9 | 8.57 ± 0.03 | 1,841 ± 19 |
| 900 | 23.3 ± 1.5 | 2,470 ± 14 | 7.94 ± 0.03 | 2,240 ± 18 |
Elemental Composition, and Growth and Production Rates
Cells were acclimated to the respective pCO2 and light levels for at least 30 d (more than 10 generations) prior to harvesting. In all acclimations, samples for growth responses were taken simultaneously at the beginning of the photoperiod to account for diurnal changes. Cell densities were determined using an inverted microscope (Zeiss Axiovert 200) by measuring the number and the length of filaments as well as the cell size in a Sedgwick-Rafter Cell (S50; Graticules).
Samples for POC, PON, and PP were filtered onto precombusted (500°C, 9 h) glass fiber filters (GF/F) and stored in precombusted (500°C, 9 h) petri dishes at −20°C. Prior to analysis, filters for POC were treated with 200 μL of HCl (0.1 n) to remove all inorganic carbon. POC and PON filters were measured in duplicate with a mass spectrometer (ANCA-SL 2020), with an average precision of ±1 μg of carbon and ±0.5 μg of nitrogen, respectively. PP was measured photometrically using a modified version of the ALOHA protocol (Hawaii Institute of Marine Biology, Analytical Services Laboratory at the University of Hawaii).
Growth and POC and PON production rates were determined based on changes in cell density, chl a, as well as POC and PON. Growth rates (μ) were calculated according to the following equation:
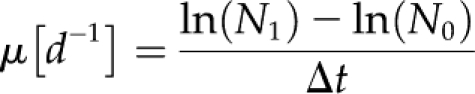 |
where N0 and N1 are concentrations (cell, chl a, POC, PON) at the beginning (to) and the end (t1) of sampling, and Δt is the time between sampling intervals. Production rates of POC and PON were calculated according to the following equations:
Samples for chl a were filtered on GF/filters and immediately stored at −80°C. Chl a was subsequently extracted in 5 to 10 mL of 90% acetone (overnight in darkness at 4°C) and determined with a fluorometer (Turner Designs) by measuring nonacidified and acidified fluorescence.
N2 Fixation
Rates of N2 fixation were estimated using the acetylene reduction assay (Capone, 1993). The samples (concentrations between 0.02 and 0.08 μg chl a mL−1) were spiked with acetylene (20% of head space volume) and incubated for 1 h at acclimation light and temperature with gentle continuous shaking of the bottles to avoid aggregation or settlement. The rate of acetylene reduction to ethylene was measured using a gas chromatograph with a flame-ionization detector (Thermo Finnigan Trace) and quantified relative to an ethylene standard. Rates were normalized to chl a, and a conversion factor of 4:1 (Capone and Montoya, 2001) was applied to convert ethylene production to N2 fixation rates. To account for the diurnal patterns, nitrogen fixation rates were measured every 2 h from the onset of light until 2 h after dark.
Photosynthetic O2 Evolution and O2 Uptake
Rates of net O2 production and O2 uptake were measured by MIMS. All MIMS measurements were carried out in an 8-mL thermostatted cuvette, which was attached to a sectorfield multicollector mass spectrometer (Isoprime; GV Instruments) via a gas-permeable membrane (PTFE; 0.01 mm) inlet system. O2-evolving and O2-consuming processes can be separated in the light by measuring 16O2 evolution from water splitting and 18O2 uptake from the medium. To this end, the medium was initially bubbled with nitrogen to remove all the 16O2 and then enriched with 18O2, ensuring that mainly 18O2 is taken up by O2-consuming processes. For further details on the calculations of O2 fluxes, the reader is referred to Peltier and Thibault (1985) and Fock and Sültemeyer (1989).
Assays were performed in YBCII medium buffered with HEPES (50 mm, pH 7.8) or Bicine (50 mm, pH 8.4) depending on the respective pCO2 of the acclimation. To obtain assay conditions, the medium was purged with N2 overnight, subsequently sealed in 40-mL glass bottles, and spiked with 20 to 40 μL of 18O2 to yield air-equilibrated O2 concentrations (i.e. 21%). For measurements, cells were concentrated by gentle filtration (8 μm; Isopore; Millipore). The culture medium was exchanged stepwise with the 18O2-enriched assay medium, and cells were subsequently transferred to the MIMS cuvette. Light and dark intervals lasted 6 min to obtain O2 fluxes under steady-state conditions. DIC concentrations were adjusted by the addition of a 1 m HCO3− solution prior to measurements. Measurements were performed at respective acclimation light (50 or 200 μmol photons m−2 s−1) and DIC (approximately 1,900 or 2,300 μmol of DIC) levels if not mentioned otherwise. Chl a concentration during the measurement ranged between 0.4 and 1.6 μg mL−1.
Inorganic Carbon Acquisition and Leakage
Uptake of net photosynthesis, inorganic carbon sources (CO2 or HCO3−) for photosynthesis, and leakage (CO2 efflux:gross carbon uptake) were determined by MIMS measurements according to Badger et al. (1994). This approach is based on simultaneous measurements of O2 and CO2 during consecutive light and dark intervals at steady-state photosynthesis. For measurements, cells were concentrated in the same manner as for the O2 flux measurements, exchanging growth medium with assay medium (pH 7.8 and 8.4) containing air-equilibrated O2 levels. Light and dark intervals during the assay lasted 6 min. Light was adjusted to the respective photon flux densities in the acclimation (50 or 200 μmol photons m−2 s−1). To completely inhibit external carbonic anhydrase activity, dextran-bound sulfonamide was added to a final concentration of 50 μmol L−1. Chl a concentrations during the measurement ranged between 0.5 and 2 μg mL−1. Further details on the method and calculations are given by Badger et al. (1994) and Rost et al. (2007).
To obtain additional information about leakage, isotopic composition of POC (δ13CPOC) was determined by EA-mass spectrometry (ANCA-SL 2020) following Rost et al. (2006a). Isotopic fractionation during POC formation (εp) was calculated relative to the isotopic composition of CO2 (δ13CCO2) in the medium. To determine the isotopic composition of DIC (δ13CDIC), 8 mL of the culture medium was fixed with HgCl2 (approximately 110 mg L−1 final concentration). Extractions and measurements were performed in the laboratory of H.J. Spero (University of California, Davis) with a precision of ±0.11‰. The isotopic composition of CO2 (δ13CCO2) was calculated from δ13CDIC, following a mass-balance equation (Zeebe and Wolf-Gladrow, 2007). Isotopic fractionation is driven by the intrinsic discrimination of 13C by Rubisco (εf), setting the upper-most values for εP. Variations in fractionation are principally determined by changes in leakage as well as carbon source taken up (Sharkey and Berry, 1985):
where εf is assumed to be approximately 25‰ (Guy et al., 1993), εs represents the equilibrium fractionation between CO2 and HCO3− and a is the fractional contribution of HCO3− to total inorganic carbon uptake. Since HCO3− is about 9‰ enriched in 13C relative to CO2 (Zeebe and Wolf-Gladrow, 2007), an increasing proportion of HCO3− uptake reduces the εP value, which is defined relative to CO2 as the carbon source. If there is no change in carbon source, εP increases with increasing leakage.
Acknowledgments
We thank Torben Genz for technical support and two anonymous reviewers for their constructive comments on the manuscript.
References
- Asada K. (1999) The water-water cycle in chloroplasts: scavenging of active oxygens and dissipation of excess photons. Annu Rev Plant Physiol Plant Mol Biol 50: 601–639 [DOI] [PubMed] [Google Scholar]
- Badger MR, Andrews TJ, Whitney SM, Ludwig M, Yellowlees DC. (1998) The diversity and co-evolution of Rubisco, plastids, pyrenoids and chloroplast-based CO2-concentrating mechanisms in the algae. Can J Bot 76: 1052–1071 [Google Scholar]
- Badger MR, Palmqvist K, Yu JW. (1994) Measurement of CO2 and HCO3− fluxes in cyanobacteria and microalgae during steady-state photosynthesis. Physiol Plant 90: 529–536 [Google Scholar]
- Badger MR, Price GD, Long BM, Woodger FJ. (2006) The environmental plasticity and ecological genomics of the cyanobacterial CO2 concentrating mechanism. J Exp Bot 57: 249–265 [DOI] [PubMed] [Google Scholar]
- Barcelos é Ramos J, Biswas H, Schulz KG, LaRoche J, Riebesell U. (2007) Effect of rising atmospheric carbon dioxide on the marine nitrogen fixer Trichodesmium. Global Biogeochem Cycles 21: doi/10.1029/2006GB002898 [Google Scholar]
- Berman-Frank I, Lundgren P, Chen YB, Küpper H, Kolber Z, Bergman B, Falkowski P. (2001) Segregation of nitrogen fixation and oxygenic photosynthesis in the marine cyanobacterium Trichodesmium. Science 294: 1534–1537 [DOI] [PubMed] [Google Scholar]
- Breitbarth E, Oschlies A, LaRoche J. (2007) Physiological constraints on the global distribution of Trichodesmium: effect of temperature on diazotrophy. Biogeosciences 4: 53–61 [Google Scholar]
- Breitbarth E, Wohlers J, Kläs J, LaRoche J, Peeken I. (2008) Nitrogen fixation and growth rates of Trichodesmium IMS-101 as a function of light intensity. Mar Ecol Prog Ser 359: 25–36 [Google Scholar]
- Brewer PG, Bradshaw AL, Williams RT. (1981) Measurements of total carbon dioxide and alkalinity in the North Atlantic Ocean. Trabalka JR, Reichle DE, , The Changing Carbon Cycle: A Global Analysis. Springer, New York, pp 348–370 [Google Scholar]
- Burkhardt S, Riebesell U. (1997) CO2 availability affects elemental composition (C:N:P) of the marine diatom Skeletonema costatum. Mar Ecol Prog Ser 155: 67–76 [Google Scholar]
- Burkhardt S, Riebesell U, Zondervan I. (1999) Stable carbon isotope fractionation by marine phytoplankton in response to daylength, growth rate, and CO2 availability. Mar Ecol Prog Ser 184: 31–41 [Google Scholar]
- Capone DG. (1993) Determination of nitrogenase activity in aquatic samples using the acetylene reduction procedure. Kemp PF, Sherr B, Sherr E, Cole J, , Handbook of Methods in Aquatic Microbial Ecology. Lewis Publishers, New York, pp 621–631 [Google Scholar]
- Capone DG, Burns JA, Montoya JP, Subramaniam A, Mahaffey C, Gunderson T, Michaels AF, Carpenter EJ. (2005) Nitrogen fixation by Trichodesmium spp.: an important source of new nitrogen to the tropical and subtropical North Atlantic Ocean. Global Biogeochem Cycles 19: GB2024, 10.1029/2004GB002331 [Google Scholar]
- Capone DG, Ferrier MD, Carpenter EJ. (1994) Cycling and release of glutamate and glutamine in colonies of the marine planktonic cyanobacterium, Trichodesmium thiebautii. Appl Environ Microbiol 60: 3989–3995 [DOI] [PMC free article] [PubMed] [Google Scholar]
- Capone DG, Montoya JP. (2001) Nitrogen fixation and denitrification. Methods Microbiol 30: 501–515 [Google Scholar]
- Chen YB, Zehr JP, Mellon M. (1996) Growth and nitrogen fixation of the diazotrophic filamentous nonheterocystous cyanobacterium Trichodesmium sp. IMS 101 in defined media: evidence for a circadian rhythm. J Phycol 32: 916–923 [Google Scholar]
- Dickson AG, Millero FJ. (1987) A comparison of the equilibrium constants for the dissociation of carbonic acid in seawater media. Deep Sea Res 34: 1733–1743 [Google Scholar]
- Doney SC. (2006) Oceanography: plankton in a warmer world. Nature 444: 695–696 [DOI] [PubMed] [Google Scholar]
- Fock HP, Sültemeyer DF. (1989) O2 evolution and uptake measurements in plant cells by mass spectrometer. Liskens HF, Jackson JF, , Modern Methods of Plant Analysis, Vol 9. Springer-Verlag, Heidelberg, pp 3–18 [Google Scholar]
- Foyer CH, Noctor G. (2000) Oxygen processing in photosynthesis: regulation and signaling. New Phytol 146: 359–388 [Google Scholar]
- Friedrich T, Scheide D. (2000) The respiratory complex I of bacteria, archaea and eukarya and its module common with membrane-bound multisubunit hydrogenases. FEBS Lett 497: 1–5 [DOI] [PubMed] [Google Scholar]
- Fu FX, Mulholland MR, Garcia NS, Beck A, Bernhardt PW, Warner ME, Sanudo-Wilhelmy SA, Hutchins DA. (2008) Interactions between changing pCO2, N2 fixation, and Fe limitation in the marine unicellular cyanobacterium Crocosphaera. Limnol Oceanogr 53: 2472–2484 [Google Scholar]
- Giordano M, Beardall J, Raven JA. (2005) CO2 concentrating mechanisms in algae: mechanisms, environmental modulation, and evolution. Annu Rev Plant Biol 56: 99–131 [DOI] [PubMed] [Google Scholar]
- Glibert PM, Bronk DA. (1994) Release of dissolved organic nitrogen by marine diazotrophic cyanobacteria, Trichodesmium spp. Appl Environ Microbiol 60: 3996–4000 [DOI] [PMC free article] [PubMed] [Google Scholar]
- Gran G. (1952) Determination of the equivalence point in potentiometric titrations. Part II. Analyst (Lond) 77: 661–671 [Google Scholar]
- Guy RD, Fogel ML, Berry JA. (1993) Photosynthetic fractionation of stable isotopes of oxygen and carbon. Plant Physiol 101: 37–47 [DOI] [PMC free article] [PubMed] [Google Scholar]
- Hutchins DA, Fu FX, Zhang Y, Warner ME, Feng Y, Portune K, Bernhardt PW, Mulholland MR. (2007) CO2 control of Trichodesmium N2 fixation, photosynthesis, growth rates and elemental ratios: implications for past, present and future ocean biogeochemistry. Limnol Oceanogr 552: 1293–1304 [Google Scholar]
- Kana TM. (1993) Rapid oxygen cycling in Trichodesmium thiebautii. Limnol Oceanogr 38: 18–24 [Google Scholar]
- Kaplan A, Badger MR, Berry JA. (1980) Photosynthesis and the intracellular inorganic carbon pool in the blue green alga Anabaena variabilis: response to external CO2 concentration. Planta 149: 219–226 [DOI] [PubMed] [Google Scholar]
- Kranz SA, Sültemeyer D, Richter KU, Rost B. (2009) Carbon acquisition in Trichodesmium: the effect of pCO2 and diurnal changes. Limnol Oceanogr 54: 548–559 [Google Scholar]
- Langer G, Geisen M, Baumann KH, Kläs J, Riebesell U, Thoms S, Young JR. (2006) Species-specific responses of calcifying algae to changing seawater carbonate chemistry. Geochemistry Geophysics Geosystems 7: Q09006 [Google Scholar]
- La Roche J, Breitbarth E. (2005) Importance of the diazotrophs as a source of new nitrogen in the ocean. J Sea Res 53: 67–91 [Google Scholar]
- Levitan O, Brown CM, Sudhaus S, Campbell D, LaRoche J, Berman-Frank I. (2010a) Regulation of nitrogen metabolism in the marine diazotroph Trichodesmium IMS101 under varying temperatures and atmospheric CO2 concentrations. Environ Microbiol 12: 1899–1912 [DOI] [PubMed] [Google Scholar]
- Levitan O, Kranz SA, Spungin D, Prášil O, Rost B, Berman-Frank I. (2010b) Combined effects of CO2 and light on the N2-fixing cyanobacterium Trichodesmium IMS101: a mechanistic view. Plant Physiol 154: 346–356 [DOI] [PMC free article] [PubMed] [Google Scholar]
- Levitan O, Rosenberg G, Setlik I, Setlikova E, Grigel J, Klepetar J, Prášil O, Berman-Frank I. (2007) Elevated CO2 enhances nitrogen fixation and growth in the marine cyanobacterium Trichodesmium. Glob Change Biol 13: 531–538 [Google Scholar]
- Lewis E, Wallace DWR. (1998) Program developed for CO2 system calculations. ORNL/CDIAC-105. Carbon Dioxide Information Analysis Center, Oak Ridge National Laboratory, U.S. Department of Energy, Oak Ridge, TN [Google Scholar]
- Li QL, Canvin DT. (1998) Energy sources for HCO3− and CO2 transport in air-grown cells of Synechococcus UTEX 625. Plant Physiol 116: 1125–1132 [DOI] [PMC free article] [PubMed] [Google Scholar]
- Maeda S, Badger MR, Price GD. (2002) Novel gene products associated with NdhD3/D4-containing NDH-1 complexes are involved in photosynthetic CO2 hydration in the cyanobacterium Synechococcus sp. PCC7942. Mol Microbiol 43: 425–435 [DOI] [PubMed] [Google Scholar]
- Mahaffey C, Michaels AF, Capone DG. (2005) The conundrum of marine N2 fixation. Am J Sci 305: 546–595 [Google Scholar]
- Mehrbach C, Culberson CH, Hawley JE, Pytkowicz RM. (1973) Measurement of the apparent dissociation constants of carbonic acid in seawater at atmospheric pressure. Limnol Oceanogr 18: 897–907 [Google Scholar]
- Milligan AJ, Berman-Frank I, Gerchman Y, Dismukes GC, Falkowski PG. (2007) Light-dependent oxygen consumption in nitrogen-fixing cyanobacteria plays a key role in nitrogenase protection. J Phycol 43: 845–852 [Google Scholar]
- Mulholland MR, Bronk DA, Capone DG. (2004) Dinitrogen fixation and release of ammonium and dissolved organic nitrogen by Trichodesmium IMS101. Aquat Microb Ecol 37: 85–94 [Google Scholar]
- Mulholland MR, Heil CA, Bronk DA, O’Neil MO. (2006) Nitrogen fixation and release of fixed nitrogen by Trichodesmium sp. in the Gulf of Mexico. Limnol Oceanogr 51: 1762–1776 [Google Scholar]
- Ohkawa H, Sonoda M, Shibata M, Ogawa T. (2001) Localization of NAD(P)H dehydrogenase in the cyanobacterium Synechocystis sp strain PCC 6803. J Bacteriol 183: 4938–4939 [DOI] [PMC free article] [PubMed] [Google Scholar]
- Osmond CB, Badger MR, Maxwell K, Bjoerkman O, Leegood RC. (1997) Too many photons: photorespiration, photoinhibition and photooxidation. Trends Plant Sci 2: 119–121 [Google Scholar]
- Osmond CB, Grace SC. (1995) Perspectives on photoinhibition and photorespiration in the field: quintessential inefficiencies of the light and dark reactions of photosynthesis? J Exp Bot 46: 1351–1362 [Google Scholar]
- Peltier G, Thibault P. (1985) O2 uptake in the light in Chlamydomonas: evidence for persistent mitochondrial respiration. Plant Physiol Biochem 79: 225–230 [DOI] [PMC free article] [PubMed] [Google Scholar]
- Price GD, Badger MR, Woodger FJ, Long BM. (2008) Advances in understanding the cyanobacterial CO2-concentrating-mechanism (CCM): functional components, Ci transporters, diversity, genetic regulation and prospects for engineering into plants. J Exp Bot 59: 1441–1461 [DOI] [PubMed] [Google Scholar]
- Price GD, Maeda SI, Omata T, Badger MR. (2002) Modes of inorganic carbon uptake in the cyanobacterium Synechococcus sp. PCC7942. Funct Plant Biol 29: 131–149 [DOI] [PubMed] [Google Scholar]
- Price GD, Woodger FJ, Badger MR, Howitt SM, Tucker L. (2004) Identification of a SulP-type bicarbonate transporter in marine cyanobacteria. Proc Natl Acad Sci USA 101: 18228–18233 [DOI] [PMC free article] [PubMed] [Google Scholar]
- Prufert-Bebout L, Paerl HW, Lassen C. (1993) Growth, nitrogen fixation, and spectral attenuation in cultivated Trichodesmium species. Appl Environ Microbiol 59: 1367–1375 [DOI] [PMC free article] [PubMed] [Google Scholar]
- Raupach MR, Marland G, Ciais P, Le Quere C, Canadell JG, Klepper G, Field CB. (2007) Global and regional drivers of accelerating CO2 emissions. Proc Natl Acad Sci USA 104: 10288–10293 [DOI] [PMC free article] [PubMed] [Google Scholar]
- Raven J, Caldeira K, Elderfield H, Hoeg-Guldberg O, Liss P, Riebesell U, Shepherd J, Turley C, Watson A. (2005) Ocean Acidification Due to Increasing Atmospheric Carbon Dioxide. Policy Document 12/05. The Royal Society, London. Clyvedon Press Ltd., Cardiff, UK [Google Scholar]
- Raven JA, Lucas WJ. (1985) Energy costs of carbon acquisition. Lucas WJ, Berry JA, , Inorganic Carbon Uptake by Aquatic Photosynthetic Organisms. American Society of Plant Physiologists, Rockville, MD, pp 305–324 [Google Scholar]
- Riebesell U, Zondervan I, Rost B, Tortell PD, Zeebe E, Morel FMM. (2000) Reduced calcification in marine plankton in response to increased atmospheric CO2. Nature 407: 634–637 [DOI] [PubMed] [Google Scholar]
- Rost B, Kranz SA, Richter KU, Tortell PD. (2007) Isotope disequilibrium and mass spectrometric studies of inorganic carbon acquisition by phytoplankton. Limnol Oceanogr Methods 5: 328–337 [Google Scholar]
- Rost B, Richter KU, Riebesell U, Hansen PJ. (2006a) Inorganic carbon acquisition in red-tide dinoflagellates. Plant Cell Environ 29: 810–822 [DOI] [PubMed] [Google Scholar]
- Rost B, Riebesell U, Burkhardt S, Sültemeyer D. (2003) Carbon acquisition of bloom-forming marine phytoplankton. Limnol Oceanogr 48: 55–67 [Google Scholar]
- Rost B, Riebesell U, Sültemeyer D. (2006b) Carbon acquisition of marine phytoplankton: effect of photoperiod length. Limnol Oceanogr 51: 12–20 [Google Scholar]
- Schulz KG, Rost B, Burkhardt S, Riebesell U, Thoms S, Wolf-Gladrow DA. (2007) The effect of iron availability on the regulation of inorganic carbon acquisition in the coccolithophore Emiliania huxleyi and the significance of cellular compartmentation for stable carbon isotope fractionation. Geochim Cosmochim Acta 71: 5301–5312 [Google Scholar]
- Sharkey TD, Berry JA. (1985) Carbon isotope fractionation of algae influenced by an inducible CO2-concentrating mechanism. Lucas WJ, Berry JA, , Inorganic Carbon Uptake by Aquatic Photosynthetic Organisms. American Society of Plant Physiologists, Rockville, MD, pp 389–401 [Google Scholar]
- Tortell PD, Payne CD, Li Y, Trimborn S, Rost B, Smith WO, Riesselman C, Dunbar R, Sedwick P, DiTullio G. (2008) The CO2 response of southern ocean phytoplankton. Geophys Res Lett 35: L04605 [Google Scholar]
- Trimborn S, Lundholm N, Thoms S, Richter KU, Krock B, Hansen PJ, Rost B. (2008) Inorganic carbon acquisition in potentially toxic and non-toxic diatoms: the effect of pH-induced changes in seawater carbonate chemistry. Physiol Plant 133: 92–105 [DOI] [PubMed] [Google Scholar]
- Wolf-Gladrow DA, Bijma J, Zeebe RE. (1999) Model simulation of the carbonate chemistry in the microenvironment of symbiont bearing foraminifera. Mar Chem 64: 181–198 [Google Scholar]
- Zeebe RE, Wolf-Gladrow DA. (2007) CO2 in Seawater: Equilibrium, Kinetics, Isotopes. Elsevier Science, Amsterdam [Google Scholar]
- Zondervan I, Rost B, Riebesell U. (2002) Effect of CO2 concentration on the PIC/POC ratio in the coccolithophore Emiliania huxleyi grown under light-limiting conditions and different daylengths. J Exp Mar Biol Ecol 272: 55–70 [Google Scholar]