Abstract
Alternative splicing creates diverse mRNA isoforms from single genes and thereby enhances complexity of transcript structure and of gene function. We describe a method called spliceotyping, which translates combinatorial mRNA splicing patterns along transcripts into a library of binary strings of nucleic acid tags that encode the exon composition of individual mRNA molecules. The exon inclusion pattern of each analyzed transcript is thus represented as binary data, and the abundance of different splice variants is registered by counts of individual molecules. The technique is illustrated in a model experiment by analyzing the splicing patterns of the adenovirus early 1A gene and the beta actin reference transcript. The method permits many genes to be analyzed in parallel and it will be valuable for elucidating the complex effects of combinatorial splicing.
INTRODUCTION
Alternative splicing of primary RNA transcripts contributes to proteome complexity, greatly increasing the number of possible protein variants that can be produced from the relatively limited number of genes in higher organisms. Estimates of alternatively spliced genes in humans vary between 95% and 100% (1,2). Alternative 5′- or 3′-splice site usage and exon skipping enables e.g. production of membrane bound and soluble proteins from the same gene, inclusion of regulatory domains and tolerance for mutations in duplicated exons. Splicing isoforms are frequently differentially expressed with respect to developmental stages, tissue localization (10–30% of spliced genes) and between individuals; SNPs affecting splice sites are a frequent cause of disease (3). To improve our understanding of this biologically important layer of regulation and its effects on the organism, it would be useful to have techniques that record variation of complete splice patterns along genes in cells and tissues as opposed to only detecting individual splice sites.
A large body of splicing information has been collected through northern blotting (4) and DNA sequencing experiments, revealing tissue and development stage-dependent use of splice sites. Recently, microarray-based techniques for analysis of alternative splicing, such as exon arrays (5), exon junction arrays (6) and tiling arrays (7), have made genome-wide screening for splicing aberrations feasible. Microarrays commonly probe 20–80 nt per feature. Next-generation sequencing coupled with technologies to select particular transcripts facilitate studies of rare splice patterns (2,8). Yet, complete sequences of individual transcripts cannot be derived due to the limited read-length of these sequencers (25–400 nt sequence per read).
Thus, both microarray-based and next-generation sequencing methods fail to extract information about the entire transcript, and any correlation between different splicing events within individual transcripts is lost. Sequence-analysis of full-length cDNA clones has provided evidence of correlations between usage of distant splice sites (9). The cloning approach requires extensive resources to study correlated use of splice sites in several genes in the absence of strategies for sequencing multiple clones using next-generation sequencers (10).
To study linked regulation of multiple splice sites within individual genes, also in highly complicated transcripts such as Dscam (11), Neurexins, CD44 or L-type calcium channels, new approaches are needed. The work of Zhu and Shendure (12) is an important step toward the elucidation of complete splice patterns of single transcripts. PCR colony (polony) amplification was used to capture cDNA in a polyacrylamide gel matrix and decode exon composition by sequential minisequencing using exon specific probes. Compared to microarray techniques and next generation sequencing, polony mediated splicing analysis provided a powerful tool by combining the advantages of parallel single molecule analysis with full-length transcript analysis. However, the polony approach is not suited to target several different target molecules in parallel due to inherent limitations of multiplex PCR amplification.
We present a new approach capable of determining the full-length makeup of large sets of transcripts in parallel, with digital quantification of the relative abundance of each splice pattern. Internal exons are represented by DNA probes comprising a synthetic tag sequence flanked by sequences derived from the 5′- and 3′-ends of individual exons. The first and last exons are detected by probes comprised of the sequence complementary to their 3′- and 5′-ends, respectively, a tag identifying the gene and amplification sequences.
The probes are hybridized to full-length cDNA molecules and connected by ligation at positions corresponding to the splice sites. Thus, the exons in each mRNA transcript are encoded in abbreviated form as a string of tag sequences, separated by target-complementary regions. Completed strings are circularized, amplified by rolling circle amplification (RCA) (13) and all the amplification products (RCPs) from an experiment are immobilized on a surface and probed for each exon by adapting a previously published decoding strategy (14). The makeup of individual mRNA molecules could then be reconstructed from the presence or absence of each tag. We demonstrate the utility of this approach to decode the splicing pattern on tens of thousands of transcripts of two genes in the same sample; different splice forms of the E1A gene arising in the course of infection by adenovirus were studied together with beta actin transcripts.
MATERIALS AND METHODS
Viral infection and RNA extraction
HeLa cells were grown until 60% confluence in 6/10 cm Petri dishes. The cells were infected with a ratio of 10 viral particles per cell using adenovirus wt900, an Ad5 virus with the Ad5 E1A cassette replaced by Ad2 E1A (15). Total cytoplasmic RNA was extracted with IsoB-NP40 [10 mM Tris–HCl (pH 7.9), 150 mM NaCl, 1.5 mM MgCl2, 1% NP-40] at time points 6-, 12-, 24-, 36-, 48-h post-infection.
cDNA synthesis
One microgram RNA was incubated for 5 min at 65°C in a 10 µl mix of 10 nmol of each dNTP (with dTTP replaced by dUTP) and 50 pmol oligo dT and then kept on ice for 1 min. The reaction was brought to 5 mM dithiothreitol, 2U/µl RiboLock RNAse inhibitor (Fermentas) in 1× first strand buffer and with 200 U Superscript III (Invitrogen) in a final volume of 20 µl. The reaction was incubated at 50°C for 1 h and then inactivated by heating to 70°C for 15 min. Remaining RNA was removed by incubation with 2 U of RNAse H (Qiagen) at 37°C for 20 min.
Probe ligation
Ligation was performed by adding 5 µl ligation mix to 5 µl of the cDNA reaction to a final concentration 1× Ampligase buffer (Epicentre), 0.8 g/l BSA, 2.5 U Ampligase (Epicentre) and 1 nM of each oligonucleotide probe Actin A, B, C and D and/or Adeno A, B, C, D, E and F (Supplementary Table S1). An initial incubation at 80°C for 2 min was followed by 65°C for 60 min.
PCR amplification
One microliter of the ligated probe library was amplified by PCR with 10 pmol of phosphorylated forward primer and biotinylated reverse primer, 0.2 mM dNTP, 2 mM MgCl2 and 1 U PfuTurbo polymerase (Stratagene) in 50 µl 1× PCR buffer. The PCR was incubated for 95°C for 2 min followed by 40 cycles of 95°C 15 s, 50°C 15 s and 72°C 1 min. After the cycles, a final extension at 72°C was performed for 5 min.
Quantitative PCR amplification
Quantification of ligation events by PCR was performed in a reaction mix of 0.2× SybrGreen (Invitrogen), 0.5 µM ROX (Sigma), 0.2 mM dNTP (dTTP replaced by dUTP), 6 pmol of each primer, 2 mM MgCl2 and 0.6 U Taq Platinum (Invitrogen) in 30 µl 1× PCR buffer (Invitrogen). Reactions were incubated and analyzed in a Stratagene MX instrument, with 2 min at 95°C followed by 45 cycles of 15 s at 95°C and 1 min at 60°C.
Library circularization and amplification
Unincorporated primers were removed from PCR products with the GFX kit (Amersham). The PCR products were immobilized on 100 µg Dynabeads M280 (Invitrogen) according to the manufacturer’s instructions. The non-biotinylated strand was released by incubating beads in 10 µl 0.1 M NaOH for 1 min, and the supernatant was neutralized in a new tube with 10 µl 0.1 M HCl and 5 µl 0.1 M Tris–HCl pH 7.5. The single-stranded library was then phosphorylated by T4 polynucleotide kinase (PNK) in a reaction comprising 1× PNK buffer A (Fermentas), 0.17 U/µl PNK and 1 mM ATP. The library was then circularized in 1× Ampligase buffer (Epicentre), 4 nM of circularization template (Supplementary Table S1), 0.2 g/l BSA and ∼10 pM of PCR library, for 2 min at 80°C and 60 min at 60°C.
The circularized DNA library was amplified by RCA for 60 min at 37°C in 125 µM dNTPs, 0.2 g/l BSA and 50 mU/µl phi29 DNA polymerase in 1× phi29 DNA polymerase buffer (Fermentas). The reaction was terminated for 5 min at 60°C.
Decoding binary exon information
Ten microliter of the RCPs were spread on a poly l-lysine-coated microscope slide (Sigma-Aldrich) and allowed to dry at 55°C for ∼15 min. The slide was blocked with 10 mg/l sonicated salmon sperm DNA (Invitrogen), 2× SSC buffer and 0.05 % Tween-20 (Sigma-Aldrich) for 15 min at 37°C. Slides were rinsed in 1× PBS and the exon composition decoded by hybridization cycles containing 10 nM fluorescent labeled probes (cycle 1: probes Adeno DO, Exon B DO and Exon C DO; cycle 2: Adeno DO, Exon D DO and Exon E DO; cycle 3: Actin DO, Exon B DO, Exon C DO) in 0.05% Tween-20, 2× SSC buffer and 5% dextran sulfate. Hybridization reactions were incubated at 55°C for 60 min, followed by rinsing in 1× PBS and 1 min in 70% ethanol. Thereafter slides were spun dry, mounted with ∼10 μl VectaShield (Immunkemi) and a cover slip and imaged.
Thereafter, the cover slips were removed from the slides by incubating in 1× PBS for 15 min at room temperature. Stripping of the RCA products was performed by incubating the slides in 2× SSC and 50% formamide at 50°C for 1 min. The slides were washed in 1× PBS and 70% ethanol, and subsequently spun dry. The following cycles of hybridizations were performed as described above.
Image acquisition and image analysis
The RCPs were recorded using an epi-fluorescent microscope (Axioplan II, Zeiss) equipped with a Carl Zeiss Fluar 20×/1.3 NA objective, a 100 W mercury lamp and a charge-coupled device camera (Zeiss AxioCam MRm). The images were collected with excitation and emission filters for FITC, Cy3 and Cy5 and AxioVision LE4.8 software (Zeiss).
For each RCP, the presence or absence of fluorescent signal in each hybridization was determined by a customized Matlab program (see Supplementary Data), and interpreted as the presence or absence of the exons targeted by each probe, allowing the RCPs to be classified according to their exon patterns.
RESULTS
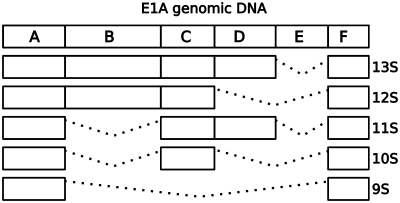
Five major transcripts arise during the adenovirus infection cycle (Figure 1). The 13S and 12S transcripts are expressed during early infection when the E1A gene products stimulate transcription from the adenovirus promoters. The 11S and 10S transcript appear somewhat later (15,16), while the 9S transcript is expressed during the late phases of infection (17).
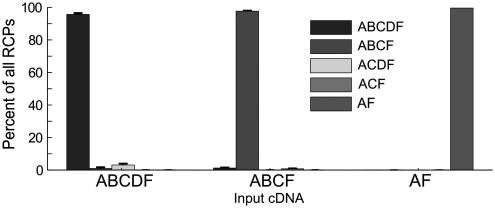
Figure 5.
Splice analysis of cloned cDNA. Adenovirus probes were hybridized to single-stranded DNA comprising the ABCDF, ABCF and AF exons, respectively, and ligated. Hybridization analysis of the tag-strings that formed indicate that spliceotyping analysis leads to correct classification of input cDNA.
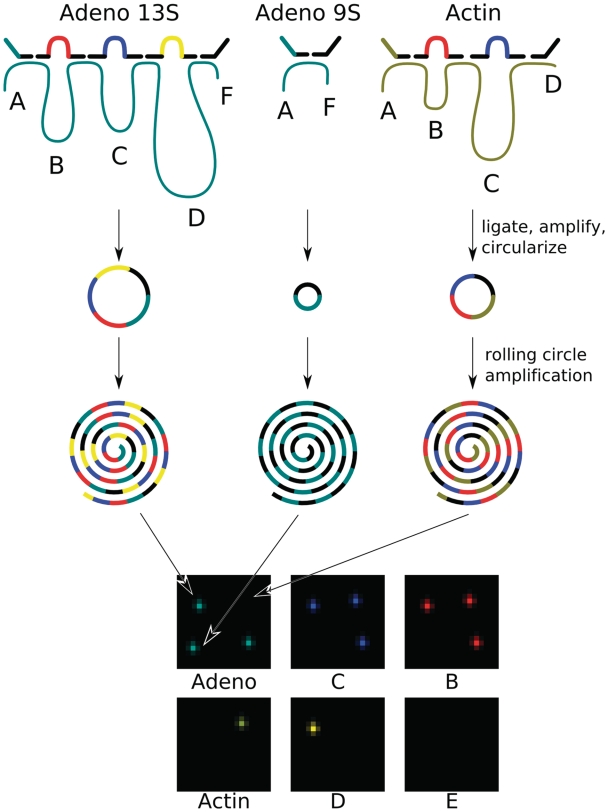
Oligonucleotide probes were designed to comprise sequences complementary to the 3′- and 5′-ends of each interrogated region, flanking a tag motif that represents the targeted region. The 3′- and 5′-most probes are equipped with a single target complementary sequence and a universal primer motif, and the 5′-most probe further encodes which gene the transcript was derived from (Figure 2).
Figure 1.
Expected splicing patterns of E1A during adenovirus infection. During the early phases of infection, only the E sequence is spliced out, resulting in the 13S transcript that involves the exons ABCDF. As infection progresses, the D and B exons are removed from transcripts, and in the final stages the 9S transcript comprising only the A and F exon is observed. Figure adapted from ref. (24).
Figure 2.
The spliceotyping detection scheme: exon-specific probes hybridize to the adenovirus (dark cyan) and actin (brown) cDNAs and are ligated into circular DNA tag strings that are amplified and circularized. Each tag string derived from an individual transcript is amplified by RCA, encoding the exon content of the transcript. RCPs are spread out on a glass slide and decoded by sequential hybridization with probes directed against the tag sequences. The pictures show combined data from the three decoding steps where the adenovirus and actin gene-id tags are decoded together with the exon tags B, C, D and E.
Assay optimization
The chain of DNA tags representing the single transcript exon pattern must contain the first and last exon tags to be amplified and detected. Therefore, reverse transcription of mRNA into full-length cDNA is essential for conversion of the transcript sequence into a complete chain of exon tags.
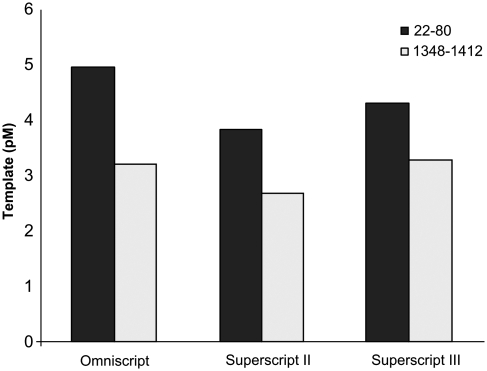
Actin cDNA was prepared with either of three reverse transcriptases (omniscript, superscript II, superscript III), primed from the polyA tail. The fraction of transcripts that were completely reverse transcribed was estimated by relative quantification of a target sequence near the polyA tail (bases 1348–1412) and near the 5′-UTR (bases 22–80). Target quantity was estimated by reference to a quantitative PCR (qPCR) standard curve. Full-length cDNA contains templates for both PCRs, while incomplete cDNA only contains the template closest to the RT-primer. Omniscript, superscript II and superscript III produced 65, 70 and 76% full-length cDNA, respectively (Figure 3).
Figure 3.
Comparison of reverse transcriptase product lengths. Copy number of one sequence near the polyA (1348–1412) and one near the 5′-UTR (22–80), respectively, were determined by qPCR. Full-length cDNAs act as templates for both qPCRs, while incomplete cDNAs only template replication from the PCR primer pair located near the polyA tail. The ratio of the two transcript represents the proportions of cDNA molecules that reached full-length (superscript III: 76%, superscript II: 70%, omniscript: 65%).
Probe hybridization and ligation efficiencies
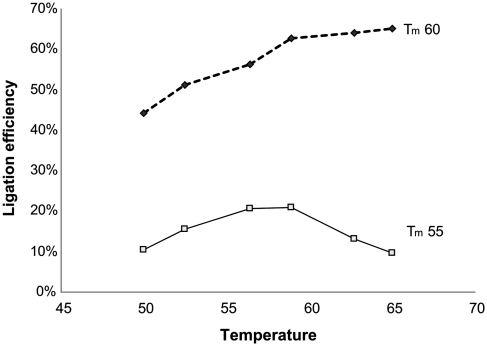
Complete hybridization of exon probes to the cDNA and efficient ligation are prerequisites to form a continuous chain of exon tags. Two sets of exon probes, having different melting temperatures in the exon-complementary sequences, were designed for the actin transcript and their ability to form full-length ligation products was examined. Ligation efficiency was measured by qPCR across all three sites of ligation using the primer sites on the flanking probes. Absolute target quantification was estimated by reference to a qPCR standard curve.
The exon probes containing target complementary sequences with melting temperatures of 55°C ligate best at temperatures between 55°C and 60°C, but for only 22% of products were all three ligation sites joined. The probes with Tm of 60°C markedly improved the ligation performance to 65% (Figure 4). BSA concentrations below 0.1 and above 1 g/l decreased the ligation efficiency ∼10-fold.
Figure 4.
Probes with melting temperatures 55 and 60°C, respectively, were hybridized to actin cDNA and ligated. Completely ligated tag strings were quantified by qPCR. Three sites need to be ligated to form a PCR template, so ligation efficiency at each site was calculated as the third root of the ratio between completely ligated tag strings and cDNAs.
Specificity testing
The specificity of the probes was tested by inclusion of one intron-specific probe (probe E) in the adenovirus probe set. In a typical test, 5000–15 000 transcripts were counted, and no RCPs containing the exon E probe were found.
DNA molecules with the sequence of the adenovirus E1A splice patterns ABCDF, ABCF and AF were prepared by PCR or as synthetic oligonucleotides. Adenovirus probes were hybridized, ligated, amplified and analyzed as described in ‘Materials and Methods’ section. Among ∼5000–15 000 analyzed transcripts, between 0.03% and 3.96% were classified as containing incorrect splice patterns (Figure 5 and Supplementary Table S2). Upon manual inspection most of these could be attributed to artifacts of the automated image analysis. For example the B-exon was probed with the weak fluorophore Cy5, resulting in 3% false negatives classified as ACDF. These results underline the specificity of the probe ligation.
Adenovirus infection samples
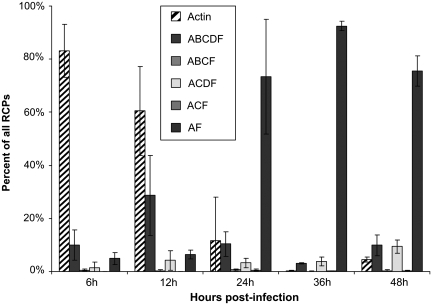
HeLa cells were infected with adenovirus, and mRNA extracted 6, 12, 24, 36 and 48 h after infection. cDNA was prepared with superscript III reverse transcriptase. Probes directed against adenovirus and actin transcripts were hybridized, ligated and amplified. The amplification products were stained with fluorescent probes directed against the exon tags, imaged and analyzed (Figure 6 and Supplementary Table S3). During the early hours of infection (6 and 12h), the majority of the RCPs originate from the host cell’s actin transcripts. At 6 hand 12 h, the few adenovirus E1A transcripts are clearly dominated by the longest isoform ABCDF (13S) and a few ABCF transcripts (12S). The decreasing portion of actin transcripts reflects the increasing concentration of adenoviral transcripts, and is paralleled by a shift from the early ABCDF isoform to the shortest AF isoform (9S). The ACDF (11S) isoform is detected with limited quantitative variation throughout the entire infection, but it is unclear whether these events reflect mis-classified ABCDF ligation products (as seen in Supplementary Table S2) or genuine ACDF transcripts.
Figure 6.
Splicing analysis of adenovirus infection time series. cDNA was prepared from HeLa cells infected with adenovirus. Adenovirus and actin probes were hybridized to cDNA and ligated. Hybridization analysis of the tag-strings formed reveals the relative increase of adenovirus transcripts and the trend toward shorter transcripts in later stages of infection.
The data in Supplementary Table S3 were collected from three microscope fields of view for each time point. The numbers of counted RCPs differ due to variations in RCP density from slide to slide. Furthermore, when images are recorded slightly off the optimal focus the point-like RCPs appeared much less intense. Thus fewer RCPs reached the threshold intensity to be included in the analysis. The total number of counted RCPs for individual time points differs by more than an order of magnitude.
DISCUSSION
Cellular RNA sequencing data has uncovered an unexpected diversity of transcript processing. Since the description of intron-splicing and differential usage of splice donor and acceptor sites, the discovery of alternative transcription start sites has complicated our view of the transcript landscape. More recently the discovery of trans-splicing of transcripts from separate genomic loci (18,19), dual-specificity splice sites that can act as 5′- or 3′-splice sites (20) and transcripts where the order of exons differs from that in the genome (21) have added further dimensions of complexity.
The variety of processed transcripts can only be completely understood by analysis of a large number of full-length transcripts. An interesting feature is the apparent correlation between the choice of splice events at separate sites along a gene, as opposed to stochastic combination of the frequency of variable splicing at different sites (9,22). Understanding this correlated regulation requires an efficient assay that provides the splice-patterns of thousands of full-length transcripts.
Microarray-based analyses of splice patterns are limited by the short sequence interrogated per microarray feature. Microarrays are useful to determine tissue-dependent expression of exons and use of splice sites, but fail to shed light on the possible existence of correlated splice events in distant regions of a transcript.
The sequencing of transcripts produces a picture of the splicing landscape, without requiring any assumptions about the location of splice sites, and this has been extremely useful in defining exon borders and expression patterns. Yet, sequencing of complete transcripts is limited by the read-length of Sanger sequencing and even more so of next-generation sequencing instruments (2,8).
The spliceotyping method described herein reduces the sequencing of long transcripts to the digital readout of presence or absence of predefined blocks. This information compression requires knowledge of which sequences can be included in mature transcripts, as recorded in splicing databases (23). While the RCA step constitutes a clonal amplification of the tag-string derived from one transcript, no bacterial cloning is required. The spliceotyping method faithfully records the exon pattern from artificial cDNA templates. The analysis of changing exon patterns during infection of a cell line with adenovirus demonstrates how thousands of full-length transcripts can be analyzed in a single, inexpensive experiment.
The maximum number of transcripts that can be analyzed in a single experiment is limited by the dynamic range, which is set by the number of enumerated RCPs and the noise level. Transcripts present at levels lower than the noise level may not be detected. Furthermore, the number of resolvable spectra, tag positions and hybridizations affect the number of detectable transcripts. As described in detail before (14), an optical setup with four fluorescence channels and a combinatorial decoding scheme can be used to decode multiplex RCP populations. Applying in total 10 serial hybridizations, targeting tags of the RCPs, could enable analysis of up to nine exons in up to 324 genes. Decoding of the exon tags could be achieved by hybridizing each exon tag position in three hybridizations using three exon tags per hybridization (3 + 3 + 3 = 9). A series of seven hybridizations targeting three gene tag positions could then be used to decode the genes (3 + 2 + 2 hybridizations per tag position, each consisting of three tags = 9 × 6 × 6 = 324 tag combinations). As discussed below, sequencing would largely remove the limitation of detectable tags.
The adenovirus E1A model transcript includes five exons that are differentially expressed in the infection cycle. Due to the requirement for increasing numbers of ligations steps, analysis of transcripts with more exons decreases the yield of completely ligated tag-strings (the expected yield is approximately proportionate to 0.65probes−1). This bias can be compensated mathematically if information of the relative abundance of several transcripts is desired. While the E1A model transcript does not feature some of the more complicated splicing patterns observed in other genes, the spliceotyping assay can easily be adapted to handle e.g. alternative 5′- or 3′-exons, alternative internal donor- and acceptor-sites and trans-splicing. To study genes with multiple 5′-exons, multiple probes can be designed to encode them as distinct tags. If multiple 3′-exons are spliced into transcripts, the 3′ probes can be designed to carry tags (omitted in our design, as the assay only amplifies tag-strings including the 3′-probe). Alternative internal donor- and acceptor-sites would be encoded as separate probes. To detect trans-splicing, all exons in question must be encoded by their own tags. As the fluorescent readout only confirms the presence of exons, information about the order of the exons in each transcript is lost.
Sequencing the tag-strings in a next-generation sequencer with sufficient read-length to cover the ligation products would reveal which probes were included, and in which order for a targeted set of genes. Thus, also transcripts with non-genomic exon order (21) could be correctly identified. Using a sequencing-based approach no tag sequences would be required but only target-complementary motifs. In this manner the 454 sequencing chemistry, currently allowing read-lengths of 500 nt, could be used to read strings identifying up to 10 exon junctions in a targeted set of genes.
SUPPLEMENTARY DATA
Supplementary Data are available at NAR Online.
FUNDING
Knut and Alice Wallenberg Foundation (grant number 2006.0261); the Swedish Research Council (grant number K2008-67X-13096-10.3); the Swedish Cancer Society (grant number 07-0448); and by the European Community’s Framework Program READNA (grant number HEALTH-F4-2008-201418). Funding for open access charge: READNA grant.
Conflict of interest statement. None declared.
Supplementary Material
REFERENCES
- 1.Wang ET, Sandberg R, Luo S, Khrebtukova I, Zhang L, Mayr C, Kingsmore SF, Schroth GP, Burge CB. Alternative isoform regulation in human tissue transcriptomes. Nature. 2008;456:470–476. doi: 10.1038/nature07509. [DOI] [PMC free article] [PubMed] [Google Scholar]
- 2.Pan Q, Shai O, Lee LJ, Frey BJ, Blencowe BJ. Deep surveying of alternative splicing complexity in the human transcriptome by high-throughput sequencing. Nat. Genet. 2008;40:1413–1415. doi: 10.1038/ng.259. [DOI] [PubMed] [Google Scholar]
- 3.Matlin AJ, Clark F, Smith CW. Understanding alternative splicing: towards a cellular code. Nat. Rev. Mol. Cell Biol. 2005;6:386–398. doi: 10.1038/nrm1645. [DOI] [PubMed] [Google Scholar]
- 4.Alwine JC, Kemp DJ, Stark GR. Method for detection of specific RNAs in agarose gels by transfer to diazobenzyloxymethyl-paper and hybridization with DNA probes. Proc. Natl Acad. Sci. USA. 1977;74:5350–5354. doi: 10.1073/pnas.74.12.5350. [DOI] [PMC free article] [PubMed] [Google Scholar]
- 5.Clark TA, Schweitzer AC, Chen TX, Staples MK, Lu G, Wang H, Williams A, Blume JE. Discovery of tissue-specific exons using comprehensive human exon microarrays. Genome Biol. 2007;8:R64. doi: 10.1186/gb-2007-8-4-r64. [DOI] [PMC free article] [PubMed] [Google Scholar]
- 6.Johnson JM, Castle J, Garrett-Engele P, Kan Z, Loerch PM, Armour CD, Santos R, Schadt EE, Stoughton R, Shoemaker DD. Genome-wide survey of human alternative pre-mRNA splicing with exon junction microarrays. Science. 2003;302:2141–2144. doi: 10.1126/science.1090100. [DOI] [PubMed] [Google Scholar]
- 7.Kampa D, Cheng J, Kapranov P, Yamanaka M, Brubaker S, Cawley S, Drenkow J, Piccolboni A, Bekiranov S, Helt G, et al. Novel RNAs identified from an in-depth analysis of the transcriptome of human chromosomes 21 and 22. Genome Res. 2004;14:331–342. doi: 10.1101/gr.2094104. [DOI] [PMC free article] [PubMed] [Google Scholar]
- 8.Sultan M, Schulz MH, Richard H, Magen A, Klingenhoff A, Scherf M, Seifert M, Borodina T, Soldatov A, Parkhomchuk D, et al. A global view of gene activity and alternative splicing by deep sequencing of the human transcriptome. Science. 2008;321:956–960. doi: 10.1126/science.1160342. [DOI] [PubMed] [Google Scholar]
- 9.Emerick M, Parmigiani G, Agnew W. Multivariate analysis and visualization of splicing correlations in single-gene transcriptomes. BMC Bioinformatics. 2007;8:16. doi: 10.1186/1471-2105-8-16. [DOI] [PMC free article] [PubMed] [Google Scholar]
- 10.Regan MR, Emerick MC, Agnew WS. Full-length single-gene cDNA libraries: applications in splice variant analysis. Anal. Biochem. 2000;286:265–276. doi: 10.1006/abio.2000.4819. [DOI] [PubMed] [Google Scholar]
- 11.Hattori D, Demir E, Kim HW, Viragh E, Zipursky SL, Dickson BJ. Dscam diversity is essential for neuronal wiring and self-recognition. Nature. 2007;449:223–227. doi: 10.1038/nature06099. [DOI] [PMC free article] [PubMed] [Google Scholar]
- 12.Zhu J, Shendure J, Mitra RD, Church GM. Single molecule profiling of alternative pre-mRNA splicing. Science. 2003;301:836–838. doi: 10.1126/science.1085792. [DOI] [PubMed] [Google Scholar]
- 13.Lizardi PM, Huang X, Zhu Z, Bray-Ward P, Thomas DC, Ward DC. Mutation detection and single-molecule counting using isothermal rolling-circle amplification. Nat Genet. 1998;19:225–232. doi: 10.1038/898. [DOI] [PubMed] [Google Scholar]
- 14.Goransson J, Wahlby C, Isaksson M, Howell WM, Jarvius J, Nilsson M. A single molecule array for digital targeted molecular analyses. Nucleic Acids Res. 2009;37:e7. doi: 10.1093/nar/gkn921. [DOI] [PMC free article] [PubMed] [Google Scholar]
- 15.Ulfendahl PJ, Linder S, Kreivi JP, Nordqvist K, Sevensson C, Hultberg H, Akusjarvi G. A novel adenovirus-2 E1A mRNA encoding a protein with transcription activation properties. EMBO J. 1987;6:2037–2044. doi: 10.1002/j.1460-2075.1987.tb02468.x. [DOI] [PMC free article] [PubMed] [Google Scholar]
- 16.Stephens C, Harlow E. Differential splicing yields novel adenovirus 5 E1A mRNAs that encode 30 kd and 35 kd proteins. EMBO J. 1987;6:2027–2035. doi: 10.1002/j.1460-2075.1987.tb02467.x. [DOI] [PMC free article] [PubMed] [Google Scholar]
- 17.Chow LT, Broker TR, Lewis JB. Complex splicing patterns of RNAs from the early regions of adenovirus-2. J. Mol. Biol. 1979;134:265–303. doi: 10.1016/0022-2836(79)90036-6. [DOI] [PubMed] [Google Scholar]
- 18.Li H, Wang J, Mor G, Sklar J. A neoplastic gene fusion mimics trans-splicing of RNAs in normal human cells. Science. 2008;321:1357–1361. doi: 10.1126/science.1156725. [DOI] [PubMed] [Google Scholar]
- 19.Rickman DS, Pflueger D, Moss B, VanDoren VE, Chen CX, de la Taille A, Kuefer R, Tewari AK, Setlur SR, Demichelis F, et al. SLC45A3-ELK4 is a novel and frequent erythroblast transformation-specific fusion transcript in prostate cancer. Cancer Res. 2009;69:2734–2738. doi: 10.1158/0008-5472.CAN-08-4926. [DOI] [PMC free article] [PubMed] [Google Scholar]
- 20.Zhang C, Hastings ML, Krainer AR, Zhang MQ. Dual-specificity splice sites function alternatively as 5′ and 3′ splice sites. Proc. Natl Acad. Sci. USA. 2007;104:15028–15033. doi: 10.1073/pnas.0703773104. [DOI] [PMC free article] [PubMed] [Google Scholar]
- 21.Gingeras TR. Implications of chimaeric non-co-linear transcripts. Nature. 2009;461:206–211. doi: 10.1038/nature08452. [DOI] [PMC free article] [PubMed] [Google Scholar]
- 22.Emerick MC, Stein R, Kunze R, McNulty MM, Regan MR, Hanck DA, Agnew WS. Profiling the array of Ca(v)3.1 variants from the human T-type calcium channel gene CACNA1G: alternative structures, developmental expression, and biophysical variations. Proteins. 2006;64:320–342. doi: 10.1002/prot.20877. [DOI] [PubMed] [Google Scholar]
- 23.Kahn A, Ryan M, Liu H, Zeeberg B, Jamison DC, Weinstein J. SpliceMiner: a high-throughput database implementation of the NCBI Evidence Viewer for microarray splice variant analysis. BMC Bioinformatics. 2007;8:75. doi: 10.1186/1471-2105-8-75. [DOI] [PMC free article] [PubMed] [Google Scholar]
Associated Data
This section collects any data citations, data availability statements, or supplementary materials included in this article.


