Abstract
A mutation in pro-EGF causes isolated hypomagnesemia, and monoclonal antibodies targeting the extracellular domain of the EGF receptor (EGFR) affect epithelial Mg2+ transport. The effect of the EGFR tyrosine kinase inhibitor erlotinib on Mg2+ homeostasis, however, remains unknown. Here, we injected C57BL/6 mice with erlotinib for 23 days and observed a small but significant decrease in serum Mg2+ concentrations at days 16 and 23, but the fractional excretion of Mg2+ remained unchanged after 23 days. Semiquantitative immunohistochemical evaluation did not reveal detectable changes in renal expression of transient receptor potential melastatin 6 (TRPM6) protein, the channel that mediates Mg2+ reabsorption. Patch clamp analysis in TRPM6-expressing cells demonstrated that 30 μM erlotinib inhibited EGF-induced changes in TRPM6 current density and tyrosine phosphorylation of EGFR; 0.3 μM erlotinib did not have these effects. Furthermore, 30 μM erlotinib inhibited EGF-stimulated increases in the mobile fraction of endomembrane TRPM6 channels. In summary, erlotinib can influence Mg2+ handling but its effect on the systemic Mg2+ concentration seems less potent than that observed with antibody-based EGFR inhibitors. These data suggest that typical human dosages of erlotinib are unlikely to severely affect serum Mg2+ concentrations.
Overall maintenance of serum Mg2+ concentration is essential for many cellular processes, including adequate function of neurologic and cardiovascular systems. The transient receptor potential melastatin subtype 6 (TRPM6) was originally identified as the causative gene for the rare autosomal recessive disorder: hypomagnesemia with secondary hypocalcemia.1,2 TRPM6, which is expressed in the kidney and colon,1,3,4 constitutes the gatekeeper and postulated rate-limiting entry step for active Mg2+ (re-)absorption.
The effect of EGF on TRPM6 has been firmly established. Application of EGF readily increases TRPM6 current density.5,6 Additional evidence suggests that EGF provokes trafficking of the channel to the plasma membrane, via activation of the Rho GTPase, Rac1.5 These discoveries were prompted by the observations that anticancer treatments with monoclonal antibodies (cetuximab), targeting an extracellular epitope on the EGF receptor (EGFR), causes hypomagnesemia in patients with colorectal cancer. In addition, genetic linkage and sequence analysis implicated the pro-EGF gene in isolated recessive renal hypomagnesemia.6–8 The observed decline in serum Mg2+ is accompanied by renal Mg2+ wasting, as these patients maintain an inappropriately high fractional Mg2+ excretion.6
Although mostly patients with colorectal cancer are treated with monoclonal EGFR inhibitors, numerous patient groups suffering from cancer receive tyrosine kinase inhibitors, such as erlotinib or gefitinib. These include individuals being treated for non–small cell lung cancer as well as pancreatic cancer.9 Erlotinib has been grouped with platinum compounds in most trials, a combination that may potentiate the effects on serum Mg2+ concentrations.10 At present, there are no published clinical reports detailing the potential effect of tyrosine kinase inhibitors on systemic and renal Mg2+ handling. Given the pronounced effect of cetuximab on Mg2+ homeostasis, we sought to ascertain if erlotinib alters Mg2+ handling. Thus, Mg2+ homeostasis and TRPM6 expression levels were investigated in wild-type mice receiving erlotinib for 23 days, and the effect of erlotinib on current density and mobility of TRPM6 was studied in HEK293 cells transiently overexpressing the channel.
Results
Erlotinib Reduces Serum Mg2+ Concentration in C57Bl/6 Mice
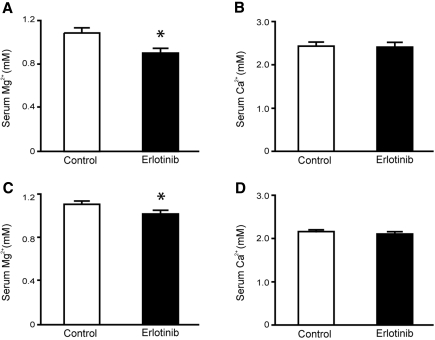
C57BL/6 mice were injected intraperitoneally with a high dose of erlotinib or vehicle for 23 days (2 mg per mouse per day) (n = 9 per group). Blood samples were obtained at day 16 by puncturing a vascular bundle in the submandibular area. Serum Mg2+ concentration showed a significant decline in the erlotinib-injected group (P = 0.005) (Figure 1A), whereas no difference was detected in serum Ca2+ concentration between groups (P = 0.88) (Figure 1B). Upon sacrifice after 23 days of erlotinib injections, similar results were found, namely, a slight but significant decline in the serum Mg2+ concentration in the erlotinib-injected group (P = 0.003) (Figure 1C). erlotinib did not affect the systemic Ca2+ concentration at day 23 (P = 0.38) (Figure 1D).
Figure 1.
Effect of erlotinib on serum Mg2+ and Ca2+ concentrations. (A, B) Changes in serum Mg2+ and Ca2+ concentrations after 16 days, in mice receiving daily injections with erlotinib or vehicle. (C, D) Effect of erlotinib or vehicle on serum Mg2+ and Ca2+ concentrations after 23 days. Values are presented as means ± SEM (n = 9). *P < 0.05 is considered statistically significant.
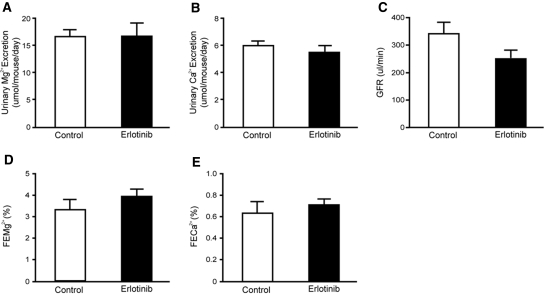
No difference was observed in the urinary excretion of Mg2+ (P = 0.98) (Figure 2A) and the urinary Ca2+ excretion (P = 0.45) (Figure 2B) after 23 days of erlotinib administration. The GFR remained within normal limits (P = 0.24) (Figure 2C). Importantly, no change in the fractional excretion of Mg2+ was observed in mice receiving erlotinib (P = 0.22) (Figure 2D). The fractional excretion of Ca2+ (P = 0.51) remained unchanged after chronic administration of erlotinib (Figure 2E). These results suggest that erlotinib-treated mice waste Mg2+, as serum Mg2+ is decreased whereas a compensatory reduction in the fractional Mg2+ excretion is absent.
Figure 2.
Functional data after 23 days of erlotinib injections. (A, B) Daily urinary excretion of Mg2+ and Ca2+ in mice injected with erlotinib for 23 days. (C) Creatinine clearance (estimated GFR) in erlotinib- and vehicle-injected mice and also the (D, E) corresponding fractional excretions of Mg2+ (FEMg) and Ca2+ (FECa). Values are presented as means ± SEM (n = 9). *P < 0.05 is considered statistically significant. FECa, corresponding fractional excretion of Ca2+; FEMg, corresponding fractional excretion of Mg2+.
Renal TRPM6 Protein Expression Is Unchanged in Erlotinib-Injected Mice
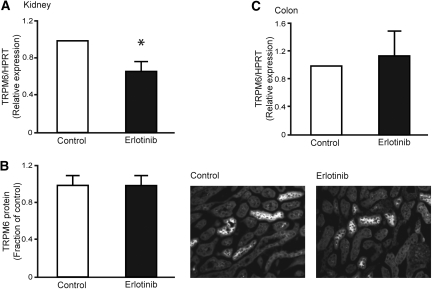
As mice injected with erlotinib develop a modest reduction in serum Mg2+, without appropriate compensation by the kidney, a possible effect could be on the expression level of TRPM6. Therefore, TRPM6 mRNA abundance was determined in the erlotinib- and vehicle-injected mice. Chronic administration of erlotinib caused a significant 0.67-fold decrease in the mRNA expression of TRPM6 (P < 0.02, n = 9) (Figure 3A). TRPM6 protein abundance was determined by semiquantification of fluorescence, from anti-TRPM6 immunolabeled kidney sections. However, with use of this method, no change in TRPM6 fluorescence was found (P = 0.99, n = 9) (Figure 3B). As TRPM6 is abundantly expressed in the colon, the main site for active Mg2+ absorption in the intestine, the effect of erlotinib on colonic TRPM6 mRNA expression was investigated. No change in the abundance of colonic TRPM6 was observed between erlotinib- and vehicle-injected mice (P = 0.48, n = 9) (Figure 3C).
Figure 3.
Effect of erlotinib on mRNA and protein abundance of TRPM6. (A) Semiquantitative real-time PCR was used to determine the abundance of TRPM6 mRNA extracted from kidney. (B) Histogram depicting TRPM6 protein abundance determined by computerized analysis of immunohistochemical images. Representative immunohistochemical pictures of TRPM6 in vehicle- and erlotinib-injected mice. (C) Semiquantitative real-time PCR determination of TRPM6 mRNA expression in the colon. Data are presented as means ± SEM. *P < 0.05 is considered statistically significant.
Renal EGFR Expression Is Increased in Mice Injected with Erlotinib
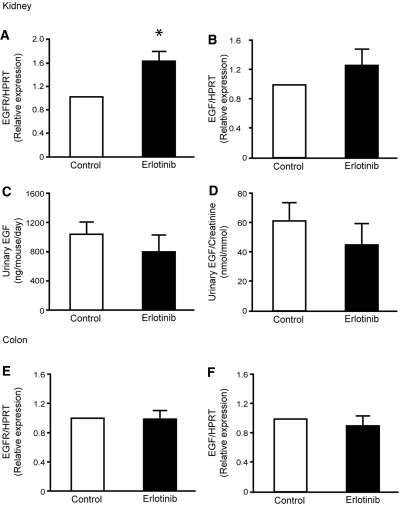
To investigate if changes in the renal EGF system were apparent after chronic administration of erlotinib, renal mRNA expression of EGF and the EGFR was determined. A 1.6-fold increase in the mRNA abundance of the EGFR receptor was observed in erlotinib-injected mice (P = 0.001, n = 9) (Figure 4A). Additionally, no change in renal mRNA expression of EGF was observed after injection of erlotinib (P = 0.14, n = 9) (Figure 4B). To evaluate changes in the secretion of EGF after administration of erlotinib, the urinary excretion of EGF was measured in the experimental groups. No differences were observed in the total urinary excretion of EGF between vehicle- and erlotinib-injected animals (Figure 4C). In addition, no changes were detected when the values were corrected for the urinary creatinine excretion (Figure 4D). As the colonic EGF system may be affected in a similar way, as observed in the kidney, the abundance of the EGFR and the EGF mRNA was investigated in samples extracted from the colon. However, no differences in the colonic expression of the EGFR (P = 0.90, n = 9) (Figure 4E) and EGF (P = 0.43, n = 9) (Figure 4F) were detectable between vehicle- and erlotinib-injected animals.
Figure 4.
Erlotinib modulates EGFR mRNA expression. (A, B) Semiquantitative determination of the mRNA abundance of EGFR and EGF in the kidney of vehicle- and erlotinib-injected mice. (C, D) Measurements of urinary EGF excretion and also the urinary EGF/creatinine ratio. (E, F) Colonic mRNA abundance of EGFR and EGF. Data are presented as means ± SEM. *P < 0.05 is considered statistically significant.
Supraphysiological Concentrations of Erlotinib Are Necessary To Inhibit TRPM6 Channel Activity
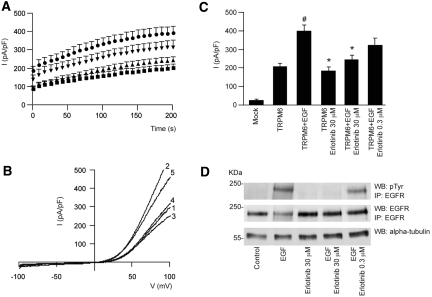
HEK293 cells expressing TRPM6 were subjected to whole-cell patch-clamp analysis. With use of this technique, a TRPM6-specific outward current was detectable. Pretreatment with erlotinib alone did not significantly affect channel currents from controls (P > 0.05). Application of EGF (10 nM) significantly increased channel activity compared with control (P < 0.001) (Figure 5, A through C). Pretreatment with erlotinib (30 μM) completely prevented the EGF-induced increase in TRPM6 current density (P < 0.01). However, at lower erlotinib concentrations (0.3 μM), erlotinib did not significantly inhibit EGF-stimulated TRPM6 channel currents (Figure 5, A through C). Tyrosine phosphorylation of the immunoprecipitated EGFR was evaluated under the same experimental conditions as aforementioned (Figure 5D). In the presence of EGF, tyrosine phosphorylation of the immunoprecipitated receptor was markedly increased. Preincubation of HEK293 cells with erlotinib at 30 μM blunted the EGF-induced EGFR tyrosine phosphorylation. However, incubation with 0.3 μM of erlotinib was not sufficient to effectively block EGFR phosphorylation. Cells incubated in the absence of EGF showed no detectable tyrosine phosphorylation of the EGFR.
Figure 5.
EGFR blockade by erlotinib can prevent EGF-induced changes in TRPM6 current density. (A) Time course of the current development (pA/pF) at +80 mV of TRPM6-transfected (■) HEK293 cells, pretreated with EGF (●) and erlotinib 30 μM (▲) or 0.3 μM (▼). (B) Current recorded after 200-second stimulation by a voltage ramp between −100 and +100 mV of TRPM6-transfected HEK293 cells (1), pretreated with EGF (2) or erlotinib (3) alone, or pretreated with EGF and erlotinib 30 μM (4)/0.3 μM (5). (C) Histogram summarizing the current density (pA/pF) at +80 of TRPM6-transfected HEK293 cells pretreated with EGF and/or erlotinib as indicated. # indicates P < 0.01 compared with TRPM6 current (n = 12 to 26 cells). * indicates P < 0.05 compared with TRPM6 pretreated with EGF (n = 12 to 26 cells). (D) The immunoprecipitated EGFR was placed on Western blots for the detection of pTyr and the EGFR itself. In addition, α-tubulin was detected in whole-cell lysates as a control for total expression. pTyr, tyrosine phosphorylation.
Erlotinib Inhibits EGF-Stimulated Mobility of Endomembrane TRPM6
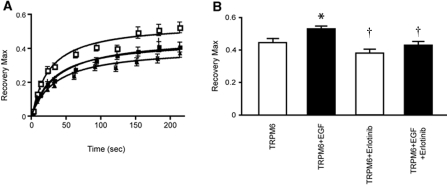
Fluorescence recovery after photobleaching (FRAP) was used to estimate the mobility and mobile fraction of green fluorescent protein–tagged TRPM6 channels in HEK293 cells. The electrophysiological properties of GFP-TRPM6 have previously been shown to display comparable currents with that of wild-type TRPM6 in the presence or absence of EGF.5 In line with this, an increase in the maximal recovery was found after EGF application (P < 0.05) (Figure 6, D and E). Pretreatment with erlotinib (at 30 μM) prevented the EGF-stimulated increase in the mobile fraction of TRPM6 channels (P < 0.05) (Figure 6, D and E).
Figure 6.
Erlotinib inhibits EGF-stimulated changes in the mobile fraction of TRPM6. (A) Fluorescence recovery kinetics as a function of time, measured in HEK293 cells transiently transfected with GFP-TRPM6. Cells were preincubated with erlotinib (30 μM, 30 minutes) alone (▲) or before EGF application (10 nM, 30 to 60 minutes, △), and compared with control (■) or EGF-treated cells (□). (B) Histogram representing the maximal recovery of fluorescence (estimated mobile fraction) in HEK293 cells expressing GFP-TRPM6 with or without application of erlotinib, EGF, or both. Data are presented as means ± SEM (n = 9). *P < 0.05 is considered statistically significant from control. †P < 0.05 statistically significant from EGF-treated.
Discussion
This study shows erlotinib is capable of affecting TRPM6 regulation and thereby altering Mg2+ handling. This conclusion is based on the following: (1) mice receiving supraphysiological doses of erlotinib for 23 days develop a decrease in their serum Mg2+ concentration; (2) erlotinib-injected mice fail to reduce the fractional renal excretion of Mg2+ in response to a decreased serum Mg2+ concentration; (3) whole-cell patch-clamp analysis in HEK293 cells shows that erlotinib significantly inhibited EGF-stimulated TRPM6 channel activity.
Administration of 92 mg/kg erlotinib (approximately 2.3 mg/25 g of mouse) intraperitoneally yielded a plasma concentration of approximately 40 μM after 1 hour in mice.11 A virtually identical dose was employed in our mice study (2 mg per mouse per day); thus, we can expect similar plasma concentrations of erlotinib. HEK293 cells received dosages in the same range (30 μM of erlotinib). Given the moderate effects of erlotinib in vivo, application of the compound could still block EGF-stimulated TRPM6 currents and routing in HEK293 cells. This can possibly be explained by the bioavailability of the compound. It has been estimated that 92 to 95% of the administered erlotinib is bound to plasma proteins12; thus, the estimated free concentration in our mouse model would be approximately 2 to 3 μM, a dose that likely would impose less inhibition on EGF-stimulated TRPM6 activity in vitro. Individuals receiving a single standard dose of erlotinib (150 mg) show a maximal plasma concentration amounting to 2.65 ± 2.02 μM (1.14 μg/ml) of the compound,12,13 representing an approximately 10 times lower circulating concentration than the mouse model. Given that the free circulating concentration of erlotinib is likely to be around 0.3 μM in human patients, we tested whether this concentration would be able to block the effect of EGF on TRPM6 currents. However, we could not detect any significant differences from EGF-stimulated cells. Evaluating EGF-induced tyrosine phosphorylation of its receptor substantiated these data. At erlotinib concentrations of 30 μM, we were unable to detect any phosphorylation of the EGFR. At lower concentrations (0.3 μM), resembling the free concentration found in humans receiving standard doses of erlotinib, EGFR phosphorylation was still present after application of EGF. Previous studies showed that erlotinib inhibits ligand-stimulated tyrosine autophosphorylation of the EGFR, with an IC50 of approximately 20 nM in cells. However, concentrations of at least a few hundred nanomolar of erlotinib are necessary to block >90% of the ligand-induced autophosphorylation.14,15 The results obtained in this study fit well with the previous observations. Taken together, these data indicate that erlotinib treatment in human patients is unlikely to induce severe hypomagnesemia as observed with EGFR-directed antibodies. However, it remains unclear if the cellular concentration of erlotinib, namely, that obtained in the distal convoluted tubule, is similar to what is observed in plasma. Similarly, the bioavailability of monoclonal antibodies may explain why colorectal cancer patients receiving cetuximab show a pronounced decrease in serum Mg2+ concentrations, to such a degree that hypomagnesemia develops.
We also find that inhibition of Mg2+ transport by erlotinib is likely to occur via inhibition of TRPM6 routing, by preventing EGF-mediated changes in the mobile fraction of TRPM6 proteins. After application of erlotinib, the EGF-stimulated fraction of TRPM6 channels becomes unresponsive. As previously shown, EGF increases not only the mobile fraction but also the plasma membrane expression of the channel, suggesting that EGF exerts its effect by redistributing TRPM6 from storage vesicles to the membrane.5 In the experimental animal, where physiologic levels of EGF are present, blockade of the EGFR would be expected to retain a bigger fraction of TRPM6 channels in endomembrane compartments, thereby preventing plasma membrane trafficking and hence reduce Mg2+ influx. This hypothesis would also explain renal Mg2+ wasting, without concomitant changes in renal TRPM6 protein expression.
EGFR inhibition by erlotinib influences Mg2+ handling, by decreasing serum Mg2+ content, without providing a compensatory decrease in the fractional renal Mg2+ excretion. These data are in good agreement with those obtained from patients receiving cetuximab, although less pronounced.6,7 Thus, the kidney is not able to effectively compensate for the reduction in serum Mg2+ concentration. Accordingly, the data insofar support tubular Mg2+ wasting, as a potential source of reducing serum Mg2+ concentration or at least in keeping serum Mg2+ lowered. Systemic and renal Ca2+ homeostasis remained unaffected during administration of erlotinib, suggesting that EGF does not directly affect Ca2+ handling. Thus, the changes in renal Mg2+ handling correlate well with impaired distal tubular transport, where Mg2+ transport is mechanistically separated from that of Ca2+. Also, the lack of secondary changes in Ca2+, which often accompany perturbations in Mg2+ homeostasis, may be explained by the modest decline in serum Mg2+ concentration observed in erlotinib-injected animals. This is confirmed in patients treated with cetuximab, as the appearance of hypocalcaemia was limited to individuals presenting with at least grade 2 hypomagnesemia (serum Mg2+ between 0.5 and 0.4 mM).7 The underlying cause of the secondary hypocalcemia during severe hypomagnesemia remains incompletely understood, although impaired release of PTH from the parathyroid gland and desensitization of bone to PTH is likely implicated.16,17
Despite a significant decrease in renal TRPM6 mRNA abundance, semiquantitative comparison of TRPM6 immunofluorescence could not detect a difference in protein expression. These findings may be explained by the observation that TRPM6 is retained in endomembrane vesicles, leading to a decreased degradation of the protein. In such an event, mRNA expression would be expected to be reduced, as the protein is retained in the cell. In fact, in vitro findings in this study support this observation, i.e., impaired mobility of TRPM6 after EGF stimulation in the presence of erlotinib.
No change was observed in colonic TRPM6 mRNA abundance. Because of difficulties detecting TRPM6 immunohistochemically in the colon, it is not possible to confirm if TRPM6 protein abundance remains unchanged. Moreover, it cannot be excluded as to whether erlotinib inhibits EGF-stimulated TRPM6 trafficking in the colon, as we observe in HEK293 cells. However, it is currently not possible to effectively estimate Mg2+ uptake in the intact animal using tracers because of the very short half-life of the radioactive 28Mg2+ isotope. In addition, one would expect an increased TRPM6 expression in the colon during conditions of lowered serum Mg2+, an effect that is not observed here and elsewhere.3 It is currently unclear how colonic Mg2+ absorption is regulated. An increase was found in the renal EGFR mRNA expression, whereas in the colon no such change could be detected. This response may indicate that particularly in the kidney, the EGF axis is affected after erlotinib treatment. Additionally, the EGF mRNA abundance remained unchanged in both organs. Measurements of EGF in the urine supported these findings, suggesting that EGF secretion is not altered in response to erlotinib.
This study is, to our knowledge, the first to delineate the effects of erlotinib on Mg2+ handling in vivo. Taken together, these findings suggest that erlotinib can inhibit EGF-stimulated TRPM6 activity and consequently impair Mg2+ reabsorption in the kidney. Additionally, it provides an explanation about why hypomagnesemia has not been correlated with erlotinib treatment in patients undergoing chemotherapy, as has been observed with cetuximab. However, it should be noted that erlotinib has the potential to modulate renal and systemic Mg2+ handling in vivo. Therefore, caution should be given when treating individuals prone to developing hypomagnesemia, and patients receiving combinational treatment with Mg2+ lowering compounds.
Concise Methods
Experimental Protocol
C57BL/6 mice (10 weeks old, n = 18) received intraperitoneal injections with erlotinib or vehicle for 23 days. The animals were kept in a light- and temperature-controlled room with ad libitum access to food and water. Erlotinib (Tarceva, generously provided by Roche Diagnostics GmbH, Penzberg, Germany) was dissolved in 10% DMSO in saline with 0.1% Pluronic P105 vol/vol as described previously.11 The compound was delivered once daily at a dose of 2 mg per mouse per day. Controls received an identical vehicle solution. At day 16, blood was obtained by puncturing the vascular bundle located rear of the jawbone. During the last 24 hours of the experimental period, mice were placed in metabolic cages and subsequently killed under 1.5% vol/vol isofluorane anesthesia (Nicholas Piramal Limited, London). Blood was withdrawn by perforating the orbital vessels and serum was extracted afterward. Additionally, organs were dissected out and immediately frozen in liquid nitrogen. One-half kidney was processed for immunohistochemistry by immersion fixation in 2% wt/vol periodate-lysine-paraformaldehyde, followed by overnight incubation in 15% wt/vol sucrose. The animal ethics board of Radboud University Nijmegen approved all experimental procedures.
Analytical Procedures
Serum and urinary Mg2+ and Ca2+ concentrations were measured using a colorimetric assay kit according to the manufacturer's protocol (Roche Diagnostics, Almere, The Netherlands). Urinary mouse EGF was measured by an enzyme-linked immunosorbent assay (R&D DuoSet ELISA, DY2028, R&D Systems Europe Ltd., United Kingdom). The wells were coated with anti-mouse EGF overnight, blocked with BSA (1 hour, room temperature), and washed with PBS with 0.05% vol/vol Tween 20. Urine samples and recombinant mouse EGF, used as standard (diluted in 0.5% wt/vol BSA), were added (2 hours, room temperature). After the wells were washed in PBS with 0.05% vol/vol Tween 20, they were incubated with biotinylated goat anti-mouse EGF and then incubated with horseradish peroxidase-conjugated streptavidin. Color was developed with o-phenylenediamine and stopped with H2SO4 (end concentration, 0.33 M). Absorbance was measured at 492 nm (Varioskan, Thermo Electron Corporation, Waltham, MA); data were analyzed using SkanIt Software for Varioskan (Thermo Electron Corporation). Detection range of the ELISA was between 2 and 577 pg/ml.
Semiquantitative Real-Time PCR Analysis
Tissue RNA was extracted using TriZol Total RNA Isolation Reagent (Life Technologies BRL, Breda, The Netherlands). After DNase treatment (Promega, Madison, WI), 1.5 μg of RNA was reverse-transcribed by Molony-Murine Leukemia Virus-Reverse Transcriptase (Invitrogen) as described previously.18 The cDNA was mixed with Power SYBR green PCR master mix (Applied Biosystems, Foster City, CA) and primers against TRPM6 (5′-AAAGCCATGCGAGTTATCAGC-3′; 5′-CTTCACAATGAAAACCTGCCC-3′), EGFR (5′-CAGAACTGGGCTTAGGGAAC-3′; 5′-GGACGATGTCCCTCCACTG-3′), EGF (5′-GAGAATCTACTGGACAGACAGTGG-3′; 5′-CTCGAGATTCTCTCCTGGATG-3′), or the housekeeping gene hypoxanthine-guanine phosphoribosyl transferase (HPRT: 5′-TTATCAGACTGAAGAGCTACTGTAATGATC-3′; 5′-TTACCAGTGTCAATTATATCTTCAACAATC-3′). The mRNA expression levels were quantified using a single-color real-time PCR detection system (MyiQ, Biorad, Veenendaal, The Netherlands). Data analysis was carried out using the Relative Expression Software Tool (REST19).
Immunohistochemistry
Periodate-lysine-paraformaldehyde (7 μm) fixed cryosections were prepared and stained with anti-TRPM6 (guinea pig antiserum), as described previously.4 Photographs of TRPM6 staining in kidney cortex were taken through a ×25 objective on a Zeiss fluorescence microscope (Sliedrecht, The Netherlands) equipped with a digital photo camera (Nikon DMX1200). Semiquantitative determination of TRPM6 protein expression was done using Image J (image-processing program, NIH), similar to previous publications.20
Cell Culture and Transfection
Cells were maintained and transfected using Lipofectamine 2000 (Invitrogen-Life Technologies, Breda, The Netherlands) as described previously.21 Briefly, HEK293T cells were transiently transfected with a N-terminal hemagglutinin-tagged TRPM6 in the pCINeo/internal ribosomal entry site-GFP vector4 for patch-clamp analysis. HEK293 cells were transfected with TRPM6 N-terminally conjugated to GFP in the pCINeo vector5 for FRAP analysis. Experiments were performed 48 to 72 hours after transfection. Cells were preincubated at 37 °C in the presence or absence of erlotinib (30 or 0.3 μM) for 60 minutes. Cells were also incubated with or without EGF (10 nM) for 30 minutes.
Electrophysiology
Electrophysiological recordings were made as described previously.4,5 Briefly, whole-cell currents were determined in the tight seal whole-cell configuration using a patch-clamp amplifier controlled by Patchmaster software (HEKA, Lambrecht, Germany). Cells were kept in an extracellular bath solution (150 mM NaCl, 10 mM Hepes/NaOH, 1 mM CaCl2, pH 7.4). Electrode resistances were between 2 and 4 MΩ after the pipette was filled with standard pipette solution (150 mM NaCl, 10 mM EDTA, 10 mM Hepes/NaOH, pH 7.2). Capacitance and access resistances were continuously monitored using the automatic capacitance compensation of the Patchmaster software. A linear voltage ramp protocol from −100 to +100 mV (within 450 milliseconds) was applied every 2 seconds from a holding potential of 0 mV. Extracting the current amplitudes at +80 and −80 mV from individual ramp current records assessed the temporal development of membrane currents. Current densities presented were determined by normalizing the current amplitude to the cell membrane capacitance. All experiments were performed at room temperature. The analysis and display of patch-clamp data were performed using Igor Pro software (WaveMetrics, Lake Oswego, OR).
Western Blotting and Immunoprecipitation
HEK293T cells were incubated with EGF and erlotinib as described above. Immunoprecipitation and Western blotting was performed as described previously.22 Briefly, cells were incubated in lysis buffer (150 mM NaCl, 25 mM Tris/HCL, pH 7.5, 1% Brij97 (polyethylene glycol monooleyl ether), 5 mM EDTA/NaOH, pH 8.0, 1 mM Na3VO4, 1 mM NaF, 1 mM phenylmethylsulfonyl fluoride, 1 μg/ml leupeptin, 1 μg/ml aprotinin, 1 μg/ml pepstatin) and spun down at 1000 g for 10 minutes at 4°C. Lysates were incubated overnight with anti-EGFR–directed mouse antibodies (subcutaneously-120, Santa Cruz Biotechnology, CA) coupled to protein A-Sepharose beads. Immunoprecipitates were run on SDS-PAGE gels and blotted onto membranes for detection of tyrosine phosphorylation (4G10, Millipore, MA) and EGFR abundance (subcutaneously-03, Santa Cruz Biotechnology). α-Tubulin was detected in whole-cell lysates and used as a housekeeping control (T6199, Sigma Aldrich, Zwijndrecht, The Netherlands).
Fluorescence Recovery after Photobleaching
The experiments were performed essentially as described previously.5 GFP-TRPM6–expressing HEK293 cells were plated onto glass Petri dish chambers (0.17-mm-thick, WillCo Wells, United States) and mounted on a confocal laser-scanning microscope (Zeiss LSM 510). Cells were kept in a standard solution (130 mM NaCl, 20 mM Hepes/Tris, 5 mM KCl, 5 mM glucose, 1 mM CaCl2, 1 mM MgCl2, pH 7.4). After two regions of interest (ROI) were defined and two baseline fluorescence measurements subsequent recorded, irreversible photobleaching of one ROI was initiated. After photobleaching, fluorescence of both ROIs was measured over a 4-minute period. Recovery in fluorescence was calculated from baseline measurements. The unbleached ROI was used to correct for photobleaching induced by image acquisition. The FRAP data were fitted by nonlinear regression analysis using previously published equations.23 Between 14 and 16 cells were measured in each experimental condition.
Statistical Analyses
Values are presented as means ± SEM. Comparisons between two groups were made using an unpaired t test. Statistical significance was determined by ANOVA in the patch clamp and FRAP experiments. P < 0.05 is considered statistically significant.
Disclosures
None.
Acknowledgments
This work was supported by The Netherlands Organization for Scientific Research (ZonMw 9120.6110, 91208026), EURYI award from the European Science Foundation, and the Dutch Kidney Foundation (C03.6017, C05.4106, C06.2166). We thank Titia Woudenberg-Vrenken, Tom Nijenhuis, Henk Arnts, Annemiete W.C.M van der Kemp, and Jeroen van Leeuwen for technical and scientific contributions to this work.
Footnotes
Published online ahead of print. Publication date available at www.jasn.org.
REFERENCES
- 1.Schlingmann KP, Weber S, Peters M, Niemann Nejsum L, Vitzthum H, Klingel K, Kratz M, Haddad E, Ristoff E, Dinour D, Syrrou M, Nielsen S, Sassen M, Waldegger S, Seyberth HW, Konrad M: Hypomagnesemia with secondary hypocalcemia is caused by mutations in TRPM6, a new member of the TRPM gene family. Nat Genet 31: 166–170, 2002 [DOI] [PubMed] [Google Scholar]
- 2.Walder RY, Landau D, Meyer P, Shalev H, Tsolia M, Borochowitz Z, Boettger MB, Beck GE, Englehardt RK, Carmi R, Sheffield VC: Mutation of TRPM6 causes familial hypomagnesemia with secondary hypocalcemia. Nat Genet 31: 171–174, 2002 [DOI] [PubMed] [Google Scholar]
- 3.Groenestege WM, Hoenderop JG, van den Heuvel L, Knoers N, Bindels RJ: The epithelial Mg2+ channel transient receptor potential melastatin 6 is regulated by dietary Mg2+ content and estrogens. J Am Soc Nephrol 17: 1035–1043, 2006 [DOI] [PubMed] [Google Scholar]
- 4.Voets T, Nilius B, Hoefs S, van der Kemp AW, Droogmans G, Bindels RJ, Hoenderop JG: TRPM6 forms the Mg2+ influx channel involved in intestinal and renal Mg2+ absorption. J Biol Chem 279: 19–25, 2004 [DOI] [PubMed] [Google Scholar]
- 5.Thebault S, Alexander RT, Tiel Groenestege WM, Hoenderop JG, Bindels RJ: EGF increases TRPM6 activity and surface expression. J Am Soc Nephrol 20: 78–85, 2009 [DOI] [PMC free article] [PubMed] [Google Scholar]
- 6.Groenestege WM, Thebault S, van der Wijst J, van den Berg D, Janssen R, Tejpar S, van den Heuvel LP, van Cutsem E, Hoenderop JG, Knoers NV, Bindels RJ: Impaired basolateral sorting of pro-EGF causes isolated recessive renal hypomagnesemia. J Clin Invest 117: 2260–2267, 2007 [DOI] [PMC free article] [PubMed] [Google Scholar]
- 7.Tejpar S, Piessevaux H, Claes K, Piront P, Hoenderop JG, Verslype C, Van Cutsem E: Magnesium wasting associated with epidermal-growth-factor receptor-targeting antibodies in colorectal cancer: A prospective study. Lancet Oncol 8: 387–394, 2007 [DOI] [PubMed] [Google Scholar]
- 8.Schrag D, Chung KY, Flombaum C, Saltz L: Cetuximab therapy and symptomatic hypomagnesemia. J Natl Cancer Inst 97: 1221–1224, 2005 [DOI] [PubMed] [Google Scholar]
- 9.Mendelsohn J, Baselga J: Epidermal growth factor receptor targeting in cancer. Semin Oncol 33: 369–385, 2006 [DOI] [PubMed] [Google Scholar]
- 10.Gatzemeier U, Pluzanska A, Szczesna A, Kaukel E, Roubec J, De Rosa F, Milanowski J, Karnicka-Mlodkowski H, Pesek M, Serwatowski P, Ramlau R, Janaskova T, Vansteenkiste J, Strausz J, Manikhas GM, Von Pawel J: Phase III study of erlotinib in combination with cisplatin and gemcitabine in advanced non-small-cell lung cancer: the Tarceva Lung Cancer Investigation Trial. J Clin Oncol 25: 1545–1552, 2007 [DOI] [PubMed] [Google Scholar]
- 11.Pollack VA, Savage DM, Baker DA, Tsaparikos KE, Sloan DE, Moyer JD, Barbacci EG, Pustilnik LR, Smolarek TA, Davis JA, Vaidya MP, Arnold LD, Doty JL, Iwata KK, Morin MJ: Inhibition of epidermal growth factor receptor-associated tyrosine phosphorylation in human carcinomas with CP-358,774: Dynamics of receptor inhibition in situ and antitumor effects in athymic mice. J Pharmacol Exp Ther 291: 739–748, 1999 [PubMed] [Google Scholar]
- 12.Hidalgo M, Bloedow D: Pharmacokinetics and pharmacodynamics: Maximizing the clinical potential of Erlotinib (Tarceva). Semin Oncol 30: 25–33, 2003 [PubMed] [Google Scholar]
- 13.Hidalgo M, Siu LL, Nemunaitis J, Rizzo J, Hammond LA, Takimoto C, Eckhardt SG, Tolcher A, Britten CD, Denis L, Ferrante K, Von Hoff DD, Silberman S, Rowinsky EK: Phase I and pharmacologic study of OSI-774, an epidermal growth factor receptor tyrosine kinase inhibitor, in patients with advanced solid malignancies. J Clin Oncol 19: 3267–3279, 2001 [DOI] [PubMed] [Google Scholar]
- 14.Moyer JD, Barbacci EG, Iwata KK, Arnold L, Boman B, Cunningham A, DiOrio C, Doty J, Morin MJ, Moyer MP, Neveu M, Pollack VA, Pustilnik LR, Reynolds MM, Sloan D, Theleman A, Miller P: Induction of apoptosis and cell cycle arrest by CP-358,774, an inhibitor of epidermal growth factor receptor tyrosine kinase. Cancer Res 57: 4838–4848, 1997 [PubMed] [Google Scholar]
- 15.Schaefer G, Shao L, Totpal K, Akita RW: Erlotinib directly inhibits HER2 kinase activation and downstream signaling events in intact cells lacking epidermal growth factor receptor expression. Cancer Res 67: 1228–1238, 2007 [DOI] [PubMed] [Google Scholar]
- 16.Anast CS, Mohs JM, Kaplan SL, Burns TW: Evidence for parathyroid failure in magnesium deficiency. Science 177: 606–608, 1972 [DOI] [PubMed] [Google Scholar]
- 17.Rude RK, Oldham SB, Singer FR: Functional hypoparathyroidism and parathyroid hormone end-organ resistance in human magnesium deficiency. Clin Endocrinol (Oxford) 5: 209–224, 1976 [DOI] [PubMed] [Google Scholar]
- 18.Hoenderop JGJ, Hartog A, Stuiver M, Doucet A, Willems PHGM, Bindels RJM: Localization of the epithelial Ca2+ channel in rabbit kidney and intestine. J Am Soc Nephrol 11: 1171–1178, 2000 [DOI] [PubMed] [Google Scholar]
- 19.Pfaffl MW, Horgan GW, Dempfle L: Relative expression software tool (REST) for group-wise comparison and statistical analysis of relative expression results in real-time PCR. Nucleic Acids Res 30: e36, 2002 [DOI] [PMC free article] [PubMed] [Google Scholar]
- 20.Nijenhuis T, Hoenderop JG, Bindels RJ: Downregulation of Ca(2+) and Mg(2+) transport proteins in the kidney explains tacrolimus (FK506)-induced hypercalciuria and hypomagnesemia. J Am Soc Nephrol 15: 549–557, 2004 [DOI] [PubMed] [Google Scholar]
- 21.Topala CN, Groenestege WT, Thebault S, van den Berg D, Nilius B, Hoenderop JG, Bindels RJ: Molecular determinants of permeation through the cation channel TRPM6. Cell Calcium 41: 513–523, 2007 [DOI] [PubMed] [Google Scholar]
- 22.Alwan HA, van Zoelen EJ, van Leeuwen JE: Ligand-induced lysosomal epidermal growth factor receptor (EGFR) degradation is preceded by proteasome-dependent EGFR de-ubiquitination. J Biol Chem 278: 35781–35790, 2003 [DOI] [PubMed] [Google Scholar]
- 23.Yguerabide J, Schmidt JA, Yguerabide EE: Lateral mobility in membranes as detected by fluorescence recovery after photobleaching. Biophys J 40: 69–75, 1982 [DOI] [PMC free article] [PubMed] [Google Scholar]


