

Abstract
Mitochondria are difficult targets for microscopy because of their small size and highly compartmentalized, membranous interior. Super-resolution fluorescence microscopy methods have recently been developed that exceed the historical limits of optical imaging. Here we outline considerations and techniques in preparing to image the relative location of mitochondrial proteins using photoactivated localization microscopy (PALM). PALM and similar methods have the capacity to dramatically increase our ability to image proteins within the mitochondria, and to expand our knowledge of the location of macromolecules beyond the current limits of immunoEM.
Keywords: Super-resolution microscopy, PALM, Fluorescence microscopy, Mitochondria, Photoactivateable fluorescent protein, LR white resin
1. Introduction
Direct visualization of proteins and complex structures within a cell is a basic methodological approach in biological research. Fluorescence microscopy is widely used to observe specifically labeled molecules inside cells. Conventional fluorescence microscopy is limited, however, in the ability to resolve subcellular structures, due to an optical barrier known as the diffraction limit. Light emitted from a single small (~1 nm) fluorescent molecule is diffracted during microscopy to an ellipsoid of light that is ≥200 nm in the lateral plane and ≥500 nm in the axial plane, using common objectives. The distribution of light intensity over this space is termed the point spread function (PSF). This pattern of diffracted light is larger than many subcellular structures, thus limiting the image resolution of those structures. In the last several years a variety of super-resolution fluorescence microscopes have been invented which overcome the diffraction limit, achieving spatial resolution in the range of 20–50 nm [1].
2. Choice of super-resolution microscopes
There are two basic strategies toward overcoming the diffraction barrier that are utilized by these new microscopes. One of these is to introduce rationally designed patterns into the excitation beam in order to define and sharpen the information usually detected as the PSF. Examples of this approach include STED, RESOLFT and SSIM [2–4]. An alternative general approach is to diminish the spatial domain occupied by the PSF by defining the center or point source of light. This is done by imaging single molecules. PALM, FPALM, STORM, and PALMIRA [5–8] platforms all use this strategy. Our laboratory is involved in imaging mitochondrial proteins using both the PALM and iPALM platforms available at our facility [5, 9]. However, the utility of the methods described here are likely to have general value when using similar super-resolution platforms.
3. Fluorescent super-resolution of mitochondria
Super-resolution fluorescence techniques are particularly well suited to address localization problems due to the extensive compartmentalization and size constraints within mitochondria. Mitochondrial diameters vary from 100–1500 nm, but are typically 200–500 nm. Within this diameter, the outer and inner membranes of the mitochondria are organized to create at least four physically distinct compartments, each with their respective functional macromolecular composition. Spatially, these compartments are separated by distances of about 20–100 nm, which exceed the spatial resolution imposed by the diffraction limit [10]. This is shown in Fig. 1 where relative scales of mitochondrial compartments are compared to a 2-dimensional representation of single fluorescent molecule PSF. Consequently, submitochondrial protein localization has been limited to approaches employing electron microscopy (EM).
Fig. 1.

A simulation of the relative space occupied by the diffraction of light from a single fluorescent protein. The white simulated point spread function as might be obtained from a fluorescence microscope is depicted in the center. The point source is represented as a black dot in the middle of the simulated PSF. This is overlaid onto an EM image of mitochondria from NIH3T3 cells. The lateral dimension of the simulated PSF is estimated from a 60X 1.45NA objective lens and is shown with the 200 nm scale bar.
Since mitochondria present these spatial challenges, these organelles have been a popular focal point for demonstrating the capabilities of several super-resolution techniques. PALM has been used to image the mitochondrial matrix, in both two and three dimensions [5, 11]. STED microscopy has been applied to the imaging of outer membrane, matrix, and inner mitochondrial membrane proteins [12, 13]. STORM has also been used to image the outer mitochondrial membrane relative to microtubules [14].
Here, we will focus on experimental design and early preparative considerations that are relevant to the imaging of mitochondrial proteins using PALM. Although there are relatively few of these microscopes currently available, Carl Zeiss, Inc. has recently offered a commercial version of this microscope as part of the ELYRA series, and more widespread use is anticipated. We therefore will not cover in detail procedures for microscope setup and operations. These have been described elsewhere [5, 15, 16], and the introduction of commercial microscopes should standardize these documents.
4. Expression of mitochondrially-targeted fluorescent fusion proteins
4.1 Fluorescent proteins for PALM
Single molecule super-resolution microscopy has been ushered into the forefront of imaging technology by the discovery and improvement of photoactivatable fluorescent proteins (PA-FPs) [17]. These proteins are able to change their spectral properties in response to specific wavelengths of light. The on and off switching characteristics of these proteins can be controlled by regulating the intensity of the activating light. Thus, individual molecules can be imaged out of a densely labeled region by controlling the rate at which the molecules turn from the “dark” to the visible state.
Table 1 displays a select list of PA-FPs with properties suitable for PALM. The choice of PA-FP is dictated by several considerations. One of these is the oligomeric state of the active PA-FP. Several years ago, multimeric PA-FPs dominated this list. Although this is not always an issue, considering how a dimer or tetramer may affect target protein behavior has to be taken into account. Table 1 also contains the molecular weights of the PA-FP candidates. Gene fusions with these partners can dramatically increase the mass of the target protein and may interfere with the normal function or subcellular distribution of the expressed protein. Careful control experiments are essential to verify that fusion proteins behave similarly to the endogenous protein. Another feature of PA-FPs is their relative brightness. Brightness is defined as the product of the molar extinction coefficient and quantum yield of a particular PA-FP, and is an indicator of relative photons potentially emitted. Brighter molecules are easier to image. However, bright molecules can be less attractive if they have a relatively low contrast ratio. Many of the PA-FPs display spontaneous photoconversion which occurs without purposeful activation. This increased background fluorescence can seriously compromise or eliminate the capacity to identify individual molecules, especially at higher labeling densities. Photobleaching rates also deserve consideration. Highly stable PA-FPs are chosen when long signal times are critical, as in second color detection during sequential detection schemes. However, high photostability can limit the frequency of molecule detection, as bleaching of each molecule is a prerequisite to imaging others. Finally, PA-FPs are chosen in pairs for two-color detection, and therefore should have complementary properties. For example, Shroff et al. [15] initially collected positional information from Eos as it was activated from a green to red emission. After Eos was photobleached, positional information was collected from Dronpa-labeled molecules. Other potential suitable pairs of PA-FPs include similar combinations of red and green emission detection. However, use of a green to red shifting PA-FPs such as Eos, Dendra, and KikGR makes photobleaching necessary prior to second color imaging. A significant advantage might be gained in using PA-mCherry, which has no green state that would interfere with Dronpa or PA-GFP data collection.
Table 1.
Selected PALM PA-FP candidates and relevant photo properties
| Fluorescent protein |
Molecular form and weighta |
Excitation/ Emisssion (nm) |
Relative Brightnessb |
Photo- stabilityc, |
Contrast ratio |
Reference |
|---|---|---|---|---|---|---|
| mPA-GFP | Monomer 26.9 kDa |
504/517 | 13746 | ++ | 70 | [26] |
| Dronpa | Monomer 25.5 kDa |
503/518 | 80750 | +++ | NR | [27] |
| PA-mCherry1 | Monomer 26.7 kDa |
564/595 | 8280 | ++ | 4000 | [28] |
| tdEos (G) | Dimer | 506/516 | 59150 | ++ | NR | [29, 30] |
| tdEos (R) | 52.9 kDa | 569/581 | 29760 | +++ | ||
| mEos2 (G) | Monomer 24 kDa |
506/519 | 47040 | ++ | NR | [30] |
| mEos2 (R) | 573/584 | 30360 | +++ | |||
| mKikGR (G) | Monomer | 505/515 | 33810 | + | ~400 | [31] |
| mKikGR (R) | 26.5 kDa | 580/591 | 17640 | ++ | ||
| Kaede (G) | Tetramer | 508/518 | 86944 | ++ | 2000 | [32] |
| Kaede (R) | 25.7 kDa | 572/580 | 19932 | +++ | ||
| Dendra2 (G) | Monomer | 490/507 | 22500 | ++ | 300 | [33] |
| Dendra2 (R) | 25.3 kDa | 553/573 | 19250 | +++ | ||
| PS-CFP2 (C) | Monomer | 402/468 | 8600 | ++ | 1500 | [34, 35] |
| PS-CFP2 (G) | 27 kDa | 490/511 | 10810 | ++ | ||
multimeric state as reported, molecular weights as calculated from protein sequence
brightness calculated as the product of extinction coefficient and quantum yield
Stability measurements are from reference [30] and from Zeiss online campus resource
NR, not reported
The current list of suitable PALM fluorophores is limited. However, the palette is bound to increase through both discovery of additional PA-FPs and through genetic engineering of those in existence. Caged dyes such as derivatives of fluorescein and rhodamine also have great potential for use in PALM. Post-fixation labeling of cells using secondary probes such as antibodies, oligonucleotides, and other methods should vastly increase the flexibility of PALM, notwithstanding some potential sacrifice in resolution.
4.2 Mitochondrial targeting of fluorescent fusion proteins
Next to consider are the details pertinent to the target gene as shown in Fig. 2. There are two general strategies applied here. Most often, an entire coding sequence for the mitochondrial protein of interest is fused to the PA-FP. In this manner, the localization signals along with any other functional domains of the target are likely preserved. Although there are exceptions, mitochondrial targeting signals are often located within the first 40 N-terminal amino acids. Therefore, appropriate mitochondrial targeting is usually accomplished by fusing the target gene upstream of the PA-FP, making certain to eliminate the termination codon and preserve the reading frame, as displayed in Fig. 2B and 2C. However, it will occasionally be necessary to preserve the C-terminal region of the target protein in those cases where critical domains are compromised by an adjacent PA-FP. Functional N-terminal targeting sequence information is then required to determine the PA-FP insertion site near the N-terminus, yet downstream of the appropriate targeting sequence (Fig. 2D). Sometimes the goal is to highlight a particular compartment of the mitochondria. For this purpose, only partial fragments of mitochondrial proteins are genetically fused to a PA-FP (Fig. 2A). For example, the initial 29 amino acids of the COX8 protein have been used in PALM to target both tdEos and dronpa to the mitochondrial matrix [5, 11, 18]. Similar strategies can be used to highlight other mitochondrial compartments with partial protein fusions.
Fig. 2.

Various mitochondrial fusion protein strategies. A nonfunctional matrix highlighter using only the cleavable mitochondrial localization sequence fused in frame to dronpa is shown in (A). (B) Illustrates a functional TFAM protein fusion with the N-terminus of mEos2. A similar example for the helicase Twinkle is shown in (C) to emphasize the relative scale of fusion proteins. A C-terminal Dronpa fusion is shown in (D), which splits the mature protein sequence from an N-terminal mitochondrial localization sequence (LS). The relative fusion cassettes are to scale based on amino acid sequence length.
4.3 Use of constitutive and regulated promoters
The choice of expression system used should also be carefully considered. Transient cell transfection procedures with vectors employing the constitutive CMV promoter are simple and yield extremely high protein expression levels. This can be useful, especially if the high expression is well tolerated by the cell. However, we have seen overexpression artifacts in these systems, and therefore use them with caution. Having the option of a regulated gene expression system is recommended. We have used the GeneSwitch system (Invitrogen), which uses the progesterone analog mifepristone as a gene expression inducer. Following transfection, applying drug selection for stable genome integration of the plasmid is usual. Each expression construct needs to be optimized for appropriate inducer concentration and time. A typical induction with the GeneSwitch system ranges from 150–200 pM mifepristone for 7–10 hours. Ecdysone-based expression systems (Millipore) may also be useful. Tetracycline analogs have been reported to inhibit mitochondrial translation [19, 20]. Although we have not verified those results in our system, these reports have discouraged us from using Tet-operator expression systems.
4.4 The need for reproducibly high transfection rates
When collecting image data for two PA-FPs, the target cells must be carrying genetic expression constructs for both fusion proteins. Since data collection is typically done in series, much time can be spent collecting data from a single reporter, only to find that the imaged cell is not carrying the second PA-FP reporter. This can be frustrating, as it may take 30 minutes or more to collect a data series from a single wavelength. In two color experiments, we typically select for stable transfectants for one reporter and then use this stable cell line to transiently transfect the second-color expression construct. We have also mixed two plasmids for simultaneous co-transfection. The Amaxa nucleofection system (Lonza), when optimized, yields transfection rates typically greater than 95%, and we have used this system with several cell lines. The conditions used for each cell line vary, and a series of optimization experiments is a prerequisite for success. However, there are a few points within the general procedure that have enhanced our success with this technique regardless of cell line choice. Here we describe our method for high efficiency transfection of cells derived from mouse NIH3T3 lines using the Amaxa system.
Bring plasmids, SG solution and 96 well shuttle-plate to room temperature.
Dissociate DMEM-grown cells from culture flasks using 0.25% Trypsin/EDTA and quickly neutralize with warm serum-containing medium. Cells should be growing logarithmically, at a low passage number, and with optimal viability.
Obtain a viable cell count. For each transfection well, spin down 8 × 10⁵ cells at room temp, for 7 min at 90 g in a 15 ml conical tube.
Gently resuspend cells in a volume of 20 µl of SG solution per 8 × 10⁵ cells within the pellet.
Place 1 µg of plasmid DNA (≤2 µl) in a microfuge tube, and add 20 µl of cell suspension. For co-transfections, add 0.5 µg of each plasmid to maintain the 1 µg final amount. Mix gently.
Transfer 20 µl of the mix per 96-shuttle well and initiate nucleofection program. We use EN158 for NIH3T3, 3T3Switch, and subclones derived from these lines.
Handle cells gently after nucleofection. The percentage of cells surviving the nucleofection procedure is low and gentle handling at this stage is important to maximize yields.
Add 80 µl of pre-warmed 37°C L15 medium with 10% FBS to each well and allow cells to recover for 10–15 min at 37°C. L15 enhances recovery relative to DMEM in our experience.
Gently transfer contents of shuttle wells to 35 mm plates or coverglass chambers containing 1–2 ml DMEM equilibrated to 37°C in a 5% CO2-humidified incubator.
After 4–5 hrs of recovery and cell attachment, remove and replace with fresh growth media.
For achieving a stably transfected population, allow to recover 24–48 hrs before applying selection.
For transient transfection, image cover slips after approximately 24 hrs (CMV promoters) or induce gene expression after about 20 hrs post nucleofection.
5. Whole cell PALM imaging
Unlike confocal microscopy, PALM is a wide-field microscopy technique. Thus light is collected from the entire specimen, regardless of focal plane. In wide-field microscopy, a common method to limit the Z-plane fluorescence is by angling the light source to achieve total internal reflection (TIRF). This optical strategy limits the fluorescence activation and detection to within an area of about 200 nm adjacent to the objective and coverslip. By limiting the analysis to this narrow band within the TIRF zone, fluorescence from areas within the cell at a higher plane of focus is eliminated. This background fluorescence would otherwise compromise the ability to locate single fluorescent molecules, thereby affecting the resolution. TIRF in PALM has been used most successfully to image structural proteins at the cellular basal layer [5, 15, 21, 22].
Unfortunately, mitochondria in cultured cells do not often occupy the basal area of the cell, thus limiting the TIRF strategy for whole cell analysis. There are two potential solutions to this problem. The most obvious is to choose a 3D method of PALM or FPALM [9, 11, 23]. However, since these microscopes are still largely in development, this is not yet a practical solution in most cases. An alternative solution is to limit the analysis of mitochondria to those areas of the cell that are peripheral to the cell body, thus limiting the confounding out-of-focus Z-plane light simply by imaging thinner areas of the cell. We have had limited success with this strategy, and have also imaged mitochondrial proteins within cultured neuronal extensions as a variation on the same strategy. Cell thickness in these areas is still large, but poorly localized molecules can be filtered from the final image to obtain quality data with this method, albeit with some loss of resolution. In this regard, it can be very helpful to promote cell spreading by coating the growth surface with fibronectin.
5.1 Cleaning, silanization, and coating of cover slips with fibronectin
Use high quality glass cover slips with smooth edges. We use round cover glass from Warner Instruments.
In a chemical hood, place the cover glass in a ceramic staining rack (Thomas Scientific # 8542E40) and immerse in 175 ml of cleaning solution made by mixing 5:1:1 (water : 14 N ammonium hydroxide : 50% hydrogen peroxide).
Cover the beaker, place on a heated stir plate in the hood, and heat to 80° C while stirring at 150 rpm. Continue heated stirring for 3–16 hrs.
Remove staining rack containing cover glass, place in a clean beaker and rinse continuously with milliQ water for 5 min.
Remove each cover glass with clean forceps and rinse individually with methanol. Air-dry, briefly pass through a flame to ensure evaporation, and store dry under dessication prior to silanization.
Place a clean ceramic staining rack into a beaker and cover with aluminum foil. Bake at 120°C for 1 hr.
Prepare an aliquot of hexamethyldisilazane (HMDS, Sigma cat # 379212-100). Fill a small plastic bag with nitrogen gas. Puncture the bag with a 21 gauge needle attached to a 3 ml syringe. Withdraw 2.5 cc of nitrogen gas. Insert 2.5 cc of nitrogen gas into the top of the HMDS container and withdraw 2.5 ml of HMDS. Inject HMDS into beaker through the aluminum foil. Return beaker to the oven and bake for an additional 1 hr. HMDS is flammable. Avoid inhalation of vapors. Consult MSDS for further cautions and handling procedures.
Cool the glass and place in 100% ethanol to store prior to fibronectin coating.
Prepare a solution of human plasma fibronectin (Millipore/Chemicon # FC010) at 15 µg/ml in PBS. Coat silanized cover glass with fibronectin solution overnight at 4°C. Do not allow the fibronectin to dry on the glass.
Cells are grown on glass by placing them into 35 mm or other suitable culture plates and seeding with cells. Use the coated glass within 1–3 days.
6. PALM analysis of cell sections
Limiting image analysis to peripheral mitochondria within whole cells as described above is perhaps overly restrictive for some lines of research. For example, we have been imaging proteins associated with the mitochondrial nucleoid, and it is not yet clear if there are functional differences between nucleoids located at various locations within the cell. Tissues cannot be analyzed with the peripheral mitochondria strategy either.
A higher resolution and less restrictive analysis of mitochondrial components can be obtained by imaging thin sections of cells. Since 100–200 nm thick sections can routinely be cut, the problem of extended Z-plane fluorescence is eliminated and all mitochondria are available for analysis regardless of location. However, standard procedures to prepare samples for sectioning can introduce other issues that are relevant to successful PALM. These techniques involve fixation and sometimes embedding. Preservation of cell ultrastructure needs to be achieved while maintaining the photoproperties of the expressed PA-FPs. It can be difficult to find this balance. We have used two methods to prepare cell sections.
6.1 Cryosectioning
The first is cryosectioning, as originally described by Tokuyasu [24]. This method is relatively simple and is a standard procedure in most EM facilities. There are several variations of this technique, and that used previously for PALM is recommended [5]. Use of glutaraldehyde and formaldehyde in the fixation procedure makes it necessary to treat with sodium borohydride to help reduce the autofluorescence inherent in using these fixatives. The autofluorescence in this case can be large, and can significantly increase non-specific flashing, especially when using the 561 nm laser.
Fix cells in PBS pH 7.4 with 0.1% glutaraldehyde and 4% paraformaldehyde (fresh) for 15 min at room temperature. Rinse with PBS.
Incubate cells in PBS with 50 mM glycine and 1% BSA for 15 min.
Scrape cells to dissociate then from flask into PBS with 1% BSA, pellet by centrifugation and remove supernatant.
Resuspend cells in 75 µl of warm 10% gelatin.
Cool the gelatin pellet on ice, remove, and infiltrate gelatin with 2.3 M sucrose in PBS overnight at 4°C.
Cut pellet into several smaller pieces and mount onto metal specimen pins.
Immerse in liquid nitrogen until well frozen, and transfer rapidly to the cooled cryo-chamber of an ultramicrotome.
Trim the block and cut 100–200 nm thick sections.
Transfer sections to cleaned, poly-L-lysine coated PALM cover glass. Glass cleaning can be done as outlined in steps 1–5 of section 5.1 above. An alternative cleaning procedure is to treat the glass with 0.5% hydrofluoric acid for 30 seconds, followed by an extensive rinse with MilliQ water. The cover glass is then blown dry with filtered compressed air and coated with 1% poly-L-lysine for 10 min at room temperature.
Incubate sections with freshly made 0.5% sodium borohydride pH 7.6 for 10 min. Rinse with PBS twice prior to PALM imaging.
6.2 High pressure freezing/freeze substitution and embedding in LR-white
We have more extensive experience using samples that have been high pressure frozen, freeze-substituted, and embedded in the acrylic resin LR White. This resin is used in immunoEM, and was chosen for its capacity to preserve antigen and therefore protein structure. It is feasible to use this resin for EM analysis of the embedded sample in addition to PALM. However, membrane lipids are often largely extracted in LR White resin by immunoEM processing, making subsequent membrane visualization difficult by EM [25]. Procedures designed to improve membrane preservation, such as post-fixation with osmium tetroxide, lead to inactivation of the PA-FP. For PALM, a critical modification of the standard LR White embedding procedure is to perform the infiltration and polymerization steps at −20° C using a cold polymerization accelerator to the benzoyl peroxide-catalyzed resin. This is done in place of heat or microwave mediated polymerization to avoid heat damage or UV inactivation of the PA-FP.
LR White is normally very stable after addition of the catalyst, benzoyl peroxide, for standard UV or heat polymerization. However, the cold polymerization used here places unusual demands on this resin. We have found that the shelf life of LR White for use at −20° C cold polymerization is greatly reduced. We purchase the uncatalyzed resin, and store it no more than one month after addition of the catalyst. When using glutaraldehyde or formaldehyde in the fixation steps, we routinely treat our LR White sections with 0.5% sodium borohydride pH 7.6 for 10 min in order to decrease background fluorescence as in the cryosection procedure. The sodium borohydride solution must be prepared fresh for each treatment. An example of a two color PALM image from a 100 nm LR White section showing the location of a mitochondrial nucleoid in NIH 3T3 cells expressing TFAM-mEos2/Cox8L-Dronpa is shown in Fig. 3.
Fig. 3.
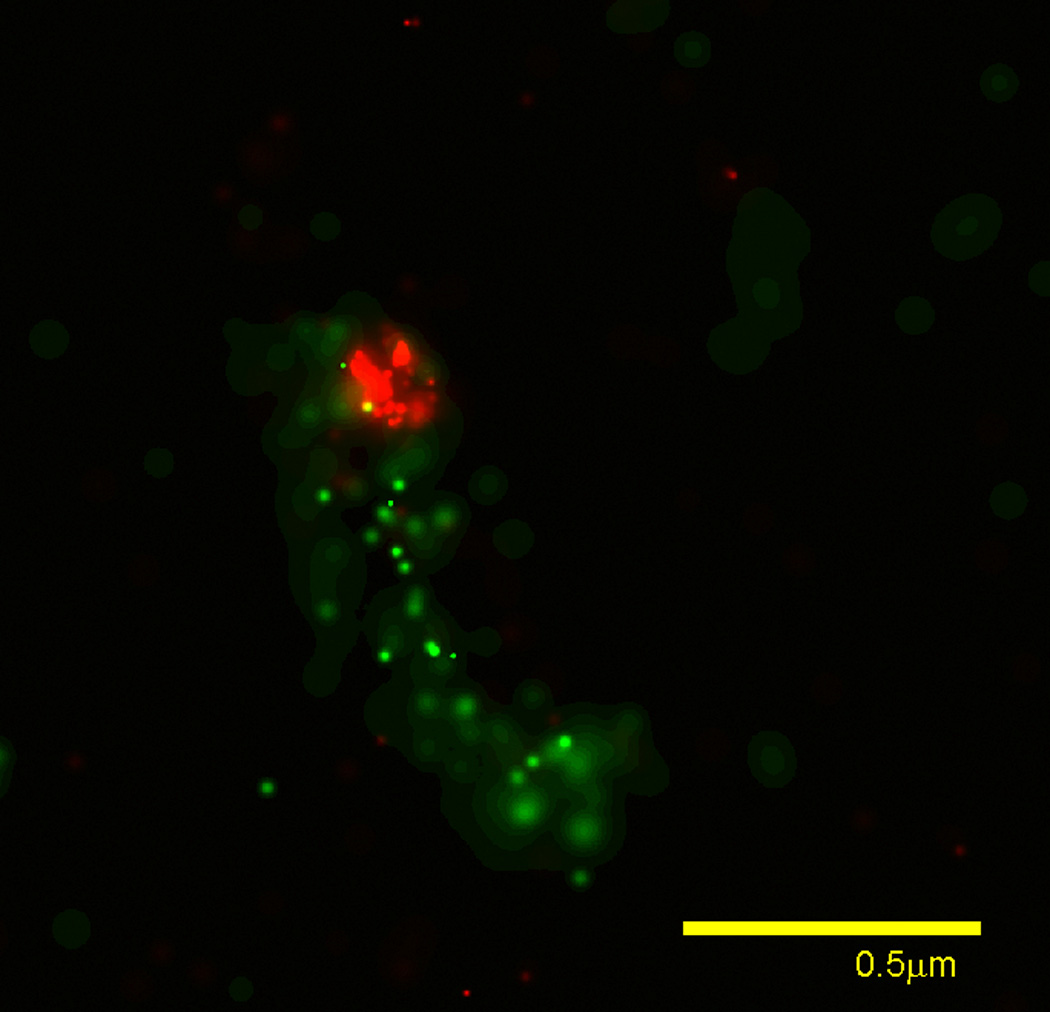
PALM image from an LR-white section. Mitochondrial DNA nucleoid localized TFAM-mEos (red) and matrix localized COX8L-dronpa (green) imaged from a 100 nm thick section of cold polymerized LR-white. Localized molecules are rendered based on confidence of localization as described [5].
6.2.1 Preparation of cell pellets for high pressure freezing
Plate transfected cells in a T25 cm2 flask or 2X 35mm plates. For T25 cm2 flask seeding, use an initial density to achieve 80% confluency at harvest. This will depend on the growth rate, but a typical seeding is ~ 5 × 10⁵ cells. We usually use this format for stably transfected cells. For transient transfection, use the cells from two wells of the Amaxa 96-well shuttle plate for each 35 mm plate to be seeded. Therefore, cells from 4 wells are required here. Change media after ~4 hrs.
At 20–24 hrs either harvest transiently transfected constitutively expressing cells, or induce expression with suitable regulated inducer. As mentioned above for the GeneSwitch system, a typical induction is with 175 pM mifepristone for 8 hrs.
Dissociate cells from vessel, pellet 5 min @ 800 g and aspirate as much of the supernatant as possible. Resuspend the pellet in 50 µl 20% BSA (Sigma, A3059), and transfer to 0.6 ml microfuge tube.
Centrifuge for 5 min @ 2000g, remove 50 µl supernatant, and mix the cells in remaining liquid. Place on ice.
For high pressure freezing, a 0.8 µl aliquot of the cell pellet is placed in the well of a 100 µm specimen platelet, covered with a flat top platelet (TechnoTrade International, Inc., #241 and #242), transferred to the specimen holder and high pressure frozen. After freezing, the samples are stored in a liquid nitrogen dewar until freeze-substitution.
- For LR White embedding for PALM, each sample is freeze-substituted in 1 ml of medium containing 1–2% glutaraldehyde and 0.1–0.5% uranyl acetate in 95% EtOH. Using a Leica AFS2 freeze-substitution unit, the samples are substituted using the following general profile:
Step Start temp End temp Time 1 −140° C −85° C 1.0 hr 2 −85° C −85° C variable: 24–60 hrs 3 −85° C −20° C 13.0 hrs 4 −20° C −20° C 6.0 hrs
6.2.2 Cold polymerization in LR White
Rinse samples 3X with 95% ethanol at −20 °C, 20 min steps. Pre-cool the 95% EtOH, 1:1 95% EtOH: LR white resin and 100% LR White resin in the indicated steps below for 45 min at −20° C prior to use.
Prepare LR White by adjusting pH to 7.0 using ethanolamine (Sigma-Aldrich). The amount of ethanolamine needed to adjust the pH must be determined for each batch of LR White resin. To do this make 20 ml of a 1:1 95% EtOH:LR White resin and add 2 µl aliquots of ethanolamine until the pH is ~7.0 using a pH meter. A pH of 6.85 to 6.95 is adequate for this purpose; subsequent 2 µl additions above pH 6.8–6.9 provide diminishing increments in pH adjustment, and lead to reduced efficiency of subsequent resin polymerization. Once determined, this quantity of ethanolamine, or volume based fraction thereof, is added to LR White resin (1:1 and 100%), in the subsequent steps. Use of pH paper is inadequate for this purpose due to difficulty in determining an accurate pH.
Infiltrate with 1:1 95% EtOH:pH adjusted LR White for 1 hr at −20°C, followed by 2 changes of pure resin at −20°C for 1 hr each, and a third and final change of pure resin overnight.
For −20°C polymerization, the samples are infiltrated for 2 changes of 3 hrs each with catalyzed resin to which 1.5 µl/ml LR White cold accelerator (Ted Pella, Inc., #18185) has been added. The samples are gently agitated once every hour. The samples are then transferred to resin with 7.5 µl/ml accelerator for 40 min with gentle agitation every 5 min.
Samples are then embedded in TAAB 133-P capsules (Ted Pella, Inc.µ133-P) with an ACLAR disk (Ted Pella, Inc., #10501) at the bottom and allowed to polymerize overnight at −20°C, followed by 1 hr at room temperature.
After removal from the molds, and between sectioning, the samples should be stored at −20°C.
Cut sections are treated as described above in steps 9 and 10 for cryosectioning (section 6.1).
5. Concluding remarks
PALM and other super-resolution microscopy methods are rapidly advancing. The methods here are therefore an early snapshot in the development of an emerging technology. There will undoubtedly be improvements at all levels. Discovery of new fluorescent proteins and genetically engineered improvements to those in existence will certainly increase the capacity of this technique. For example, PA-FPs may be engineered to retain their photoproperties in a manner that is consistent with their survival in various embedding conditions. Multimeric proteins have already been rationally mutated to behave more as monomers. Different colors are essential to expand the palette and therefore the number of proteins that can be followed simultaneously. Caged dyes may also be at the forefront by increasing fluorophore capacity and allowing postfixation labeling as an option. We continue to experiment with various mitochondrial and fluorescent proteins in order to find those combinations that are best suited to following mitochondrial processes. For example, it has been challenging to target genetically expressed fusion proteins to the inner mitochondrial membrane (due to low density incorporation or decreased cell viability). Further improvements in our ability to routinely use PALM in correlated imaging with electron microscopy is also within sight, as we continue to experiment with various resins and contrast methods that are consistent with preservation of PALM-friendly fluorescent proteins.
Footnotes
Publisher's Disclaimer: This is a PDF file of an unedited manuscript that has been accepted for publication. As a service to our customers we are providing this early version of the manuscript. The manuscript will undergo copyediting, typesetting, and review of the resulting proof before it is published in its final citable form. Please note that during the production process errors may be discovered which could affect the content, and all legal disclaimers that apply to the journal pertain.
Contributor Information
Timothy A. Brown, Howard Hughes Medical Institute, Janelia Farm Research Campus, 19700 Helix Drive, Ashburn, VA 20147 USA, brownt@janelia.hhmi.org, ph 571-209-4000 x3026, fax 571-209-4059
Richard D. Fetter, Howard Hughes Medical Institute, Janelia Farm Research Campus, 19700 Helix Drive, Ashburn, VA 20147 USA, fetterr@janelia.hhmi.org
Ariana N. Tkachuk, Howard Hughes Medical Institute, Janelia Farm Research Campus, 19700 Helix Drive, Ashburn, VA 20147 USA, tkachuka@janelia.hhmi.org
David A. Clayton, Howard Hughes Medical Institute, Janelia Farm Research Campus, 19700 Helix Drive, Ashburn, VA 20147 USA, claytond@janelia.hhmi.org
References
- 1.Huang B, Wang WQ, Bates M, Zhuang XW. Science. 2008;319:810–813. doi: 10.1126/science.1153529. [DOI] [PMC free article] [PubMed] [Google Scholar]
- 2.Hell SW, Wichmann J. Opt. Lett. 1994;19:780–782. doi: 10.1364/ol.19.000780. [DOI] [PubMed] [Google Scholar]
- 3.Hell SW. Science. 2007;316:1153–1158. doi: 10.1126/science.1137395. [DOI] [PubMed] [Google Scholar]
- 4.Gustafsson MGL. Proc. Natl. Acad. Sci. USA. 2005;102:13081–13086. doi: 10.1073/pnas.0406877102. [DOI] [PMC free article] [PubMed] [Google Scholar]
- 5.Betzig E, Patterson GH, Sougrat R, Lindwasser OW, Olenych S, Bonifacino JS, Davidson MW, Lippincott-Schwartz J, Hess HF. Science. 2006;313:1642–1645. doi: 10.1126/science.1127344. [DOI] [PubMed] [Google Scholar]
- 6.Hess ST, Girirajan TPK, Mason MD. Biophys. J. 2006;91:4258–4272. doi: 10.1529/biophysj.106.091116. [DOI] [PMC free article] [PubMed] [Google Scholar]
- 7.Bates M, Huang B, Dempsey GT, Zhuang XW. Science. 2007;317:1749. doi: 10.1126/science.1146598. [DOI] [PMC free article] [PubMed] [Google Scholar]
- 8.Egner A, Geisler C, Von Middendorff C, Bock H, Wenzel D, Medda R, Andresen M, Stiel AC, Jakobs S, Eggeling C, Schonle A, Hell SW. Biophys. J. 2007;93:3285. doi: 10.1529/biophysj.107.112201. [DOI] [PMC free article] [PubMed] [Google Scholar]
- 9.Shtengel G, Galbraith JA, Galbraith CG, Lippincott-Schwartz J, Gillette JM, Manley S, Sougrat R, Waterman CM, Kanchanawong P, Davidson MW, Fetter RD, Hess HF. Proc. Natl. Acad. Sci. USA. 2009;106:3125–3130. doi: 10.1073/pnas.0813131106. [DOI] [PMC free article] [PubMed] [Google Scholar]
- 10.Frey TG, Mannella CA. Trends Biochem. Sci. 2000;25:319–324. doi: 10.1016/s0968-0004(00)01609-1. [DOI] [PubMed] [Google Scholar]
- 11.Vaziri A, Tang JY, Shroff H, Shank CV. Proc. Natl. Acad. Sci. USA. 2008;105:20221–20226. doi: 10.1073/pnas.0810636105. [DOI] [PMC free article] [PubMed] [Google Scholar]
- 12.Schmidt R, Wurm CA, Jakobs S, Engelhardt J, Egner A, Hell SW. Nat. Meth. 2008;5:539–544. doi: 10.1038/nmeth.1214. [DOI] [PubMed] [Google Scholar]
- 13.Schmidt R, Wurm CA, Punge A, Egner A, Jakobs S, Hell SW. Nano Lett. 2009;9:2508–2510. doi: 10.1021/nl901398t. [DOI] [PubMed] [Google Scholar]
- 14.Huang B, Jones SA, Brandenburg B, Zhuang XW. Nat. Meth. 2008;5:1047–1052. doi: 10.1038/nmeth.1274. [DOI] [PMC free article] [PubMed] [Google Scholar]
- 15.Shroff H, Galbraith CG, Galbraith JA, White H, Gillette J, Olenych S, Davidson MW, Betzig E. Proc. Natl. Acad. Sci. USA. 2007;104:20308–20313. doi: 10.1073/pnas.0710517105. [DOI] [PMC free article] [PubMed] [Google Scholar]
- 16.Gould TJ, Verkhusha VV, Hess ST. Nat. Protocols. 2009;4:291–308. doi: 10.1038/nprot.2008.246. [DOI] [PMC free article] [PubMed] [Google Scholar]
- 17.Lippincott-Schwartz J, Patterson GH. Trends Cell Biol. 2009;19:555–565. doi: 10.1016/j.tcb.2009.09.003. [DOI] [PMC free article] [PubMed] [Google Scholar]
- 18.Rizzuto R, Simpson AWM, Brini M, Pozzan T. Nature. 1992;358:325–327. doi: 10.1038/358325a0. [DOI] [PubMed] [Google Scholar]
- 19.Van Den Bogert C, Holtrop M, Melis TE, Roefsema PR, Kroon AM. Biochem. Pharmacol. 1987;36:1555–1560. doi: 10.1016/0006-2952(87)90126-2. [DOI] [PubMed] [Google Scholar]
- 20.Jones CN, Miller C, Tenenbaum A, Spremulli LL, Saada A. Mitochon. 2009;9:429–437. doi: 10.1016/j.mito.2009.08.001. [DOI] [PubMed] [Google Scholar]
- 21.Manley S, Gillette JM, Patterson GH, Shroff H, Hess HF, Betzig E, Lippincott-Schwartz J. Nat. Meth. 2008;5:155–157. doi: 10.1038/nmeth.1176. [DOI] [PubMed] [Google Scholar]
- 22.Shroff H, Galbraith CG, Galbraith JA, Betzig E. Nat. Meth. 2008;5:417–423. doi: 10.1038/nmeth.1202. [DOI] [PMC free article] [PubMed] [Google Scholar]
- 23.Juette MF, Gould TJ, Lessard MD, Mlodzianoski MJ, Nagpure BS, Bennett BT, Hess ST, Bewersdorf J. Nat. Meth. 2008;5:527–529. doi: 10.1038/nmeth.1211. [DOI] [PubMed] [Google Scholar]
- 24.Tokuyasu KT. J. Cell Biol. 1973;57:551–565. doi: 10.1083/jcb.57.2.551. [DOI] [PMC free article] [PubMed] [Google Scholar]
- 25.Newman GR, Hobot JA. Resin microscopy and on-section immunocytochemistry. second ed. New York: Springer Verlag; 2001. Springer Lab Manuals. [Google Scholar]
- 26.Patterson GH, Lippincott-Schwartz J. Science. 2002;297:1873–1877. doi: 10.1126/science.1074952. [DOI] [PubMed] [Google Scholar]
- 27.Ando R, Mizuno H, Miyawaki A. Science. 2004;306:1370–1373. doi: 10.1126/science.1102506. [DOI] [PubMed] [Google Scholar]
- 28.Subach FV, Patterson GH, Manley S, Gillette JM, Lippincott-Schwartz J, Verkhusha VV. Nat. Meth. 2009;6:153–159. doi: 10.1038/nmeth.1298. [DOI] [PMC free article] [PubMed] [Google Scholar]
- 29.Nienhaus GU, Nienhaus K, Holzle A, Ivanshenko S, Renzi F, Oswalsd F, Wolff M, Schmitt F, Rocker C, Vallone B, Weidemann W, Heilker R, Nar H, Wiedenmann J. Photochem. Photobiol. 2006;82:351–358. doi: 10.1562/2005-05-19-RA-533. [DOI] [PubMed] [Google Scholar]
- 30.McKinney SA, Murphy CS, Hazelwood KL, Davidson MW, Looger LL. Nature Methods. 2009;6:131–133. doi: 10.1038/nmeth.1296. [DOI] [PMC free article] [PubMed] [Google Scholar]
- 31.Habuchi S, Tsutsui H, Kochaniak AB, Miyawaki A, van Oijen AM. PLoS One. 2008;3:e3944. doi: 10.1371/journal.pone.0003944. [DOI] [PMC free article] [PubMed] [Google Scholar]
- 32.Tsutsui H, Karasawa S, Shimizu H, Nukina N, Miyawaki A. Embo Rep. 2005;6:233–238. doi: 10.1038/sj.embor.7400361. [DOI] [PMC free article] [PubMed] [Google Scholar]
- 33.Gurskaya NG, Verkhusha VV, Shcheglov AS, Staroverov DB, Chepurnykh TV, Fradkov AF, Lukyanov S, Lukyanov KA. Nat. Biotech. 2006;24:461–465. doi: 10.1038/nbt1191. [DOI] [PubMed] [Google Scholar]
- 34.Chudakov DM, Verkhusha VV, Staroverov DB, Souslova EA, Lukyanov S, Lukyanov KA. Nat. Biotech. 2004;22:1435–1439. doi: 10.1038/nbt1025. [DOI] [PubMed] [Google Scholar]
- 35.Chudakov DM, Lukyanov S, Lukyanov KA. Nat. Protocols. 2007;2:2024–2032. doi: 10.1038/nprot.2007.291. [DOI] [PubMed] [Google Scholar]