

Abstract
We applied the hippocampal radial atrophy mapping technique to the baseline and follow‐up magnetic resonance image data of 169 amnestic mild cognitive impairment (MCI) participants in the imaging arm of the Alzheimer's Disease Cooperative Study MCI Donepezil/Vitamin E trial. Sixty percent of the subjects with none to mild hippocampal atrophy rated with the visual medial temporal atrophy rating scale (MTA score < 2) and 33.8% of the subjects with moderate to severe (MTA ≥ 2) hippocampal atrophy converted to Alzheimer's disease (AD) during 3‐year follow‐up. MTA ≥ 2 showed a trend for greater left sided hippocampal atrophy versus MTA < 2 groups at baseline (P corrected = 0.08). Higher MTA scores were associated with progressive atrophy of the subiculum and the CA1‐3 subregions. The MTA < 2 group demonstrated significant bilateral atrophy progression at follow‐up (left P corrected = 0.008; right P corrected = 0.05). Relative to MTA < 2 nonconverters, MTA < 2 converters showed further involvement of the subiculum and CA1 and additional involvement of CA2‐3 at follow‐up. Right CA1 atrophy was significantly associated with conversion to dementia (for 1 mm greater right CA1 radial distance subjects had 50% reduced hazard for conversion). Greater CA1 and subicular atrophy can be demonstrated early and is predictive of future conversion to AD, whereas CA2‐3 involvement becomes more evident as the disease progresses. Hum Brain Mapp, 2010. © 2010 Wiley‐Liss, Inc.
Keywords: mild cognitive impairment, conversion, hippocampal atrophy, medial temporal atrophy, magnetic resonance imaging, imaging biomarker
INTRODUCTION
Mild cognitive impairment (MCI) is an intermediate state between normal aging and dementia. MCI subjects convert to dementia at a rate of ∼10–15% annually [Petersen et al.,2001]. Alzheimer's type pathology is the most common finding in MCI on postmortem examination [Haroutunian et al.,1998; Jicha et al.,2006; Price and Morris,1999]. MCI frequently represents the first symptomatic stage of Alzheimer's dementia (AD), but those predestined to develop AD in the near future cannot yet be reliably identified on clinical grounds alone, as a sizeable subset of MCI patients harbor another neurodegenerative pathology [Jicha et al.,2006].
In recent years, research efforts have focused on the discovery and validation of disease‐associated clinical, imaging or laboratory features that would reliably predict the presence of AD‐type pathology and future conversion to AD. Dubois et al. [2007] recently proposed to reconsider the AD diagnostic construct. The authors proposed to diagnose AD in those elderly subjects who in addition to episodic memory impairment also have a positive AD‐associated biomarker such as medial temporal atrophy (MTA), low Abeta (β‐amyloid), and/or high‐tau protein levels in the cerebrospinal fluid or a positive amyloid‐imaging scan.
Hippocampal atrophy is commonly seen in subjects with amnestic MCI [Apostolova et al.,2006b; De Leon et al.,1997; Dickerson et al.,2001; Jack et al.,2004; Morra,2009a,b; Mueller and Dickerson,2008]. MCI patients with smaller hippocampi are at greater risk for conversion to AD [Apostolova et al.,2006b; Csernansky et al.,2005; Jack et al.,1999,2004]. Pathologic studies have consistently documented that hippocampal involvement in AD is nonuniform, with the CA1 involved early and showing the heaviest disease‐associated burden throughout the disease. [Braak and Braak,1991; Rossler et al.,2002; Schonheit et al.,2004; West et al.,2004]. Subfields CA2‐4 are involved relatively later and show lesser neurofibrillary pathology across the disease spectrum [Bobinski et al.,1995,1997; Schonheit et al.,2004]. Greater involvement of CA1 and subiculum has been implicated as a predictor of conversion to AD [Apostolova et al.,2006b].
Recently, DeCarli et al. [2007] applied a well‐established visual rating scale for MTA [Scheltens et al.,1995] to the baseline magnetic resonance image (MRI) data of the imaging arm of the 3‐year, double blind, placebo‐controlled Alzheimer's Disease Cooperative Study (ADCS) evaluating the efficacy of monotherapy with Donepezil or vitamin E for delaying progression of MCI to AD [Petersen et al.,2005]. The goal was to assess the usefulness of the MTA rating scale for predicting conversion to AD. A mean MTA score greater than two was associated with double the risk of progression to AD in amnestic MCI subjects (HR = 2.3, 95% CI = 1.09–4.92).
In this study, we extend the findings reported by DeCarli et al. [2007] using a new technique that enables inferences about disease involvement in named hippocampal subfields. We aimed to examine baseline regional hippocampal differences between subjects with no to mild hippocampal involvement (MTA < 2) versus those with more advanced hippocampal atrophy (MTA ≥ 2) and to visualize and examine the changes in hippocampal morphology associated with worsening in MTA rating. We hypothesized that higher MTA score at baseline would correspond to greater subicular and CA1 involvement. We also hypothesized that MCI subjects who converted to AD (MCIc) in the course of the study would have significantly greater atrophy of the subiculum and CA1 at baseline and involvement of the CA2‐3 subfields at follow‐up, relative to nonconverters (MCInc). An MTA score of two was chosen based on previous evidence that a score of three or higher is suggestive of AD [Scheltens et al.,1992].
METHODS
Subjects
Sixty‐nine North American sites of the ADCS MCI Donepezil/Vitamin E trial enrolled a total of 769 amnestic MCI subjects all of whom had insidious gradually progressive memory decline, a Logical Memory delayed recall score at least 1.5 standard deviation (SD) below an education‐adjusted norm, a Clinical Dementia Rating score of 0.5 and a Mini‐Mental State Examination (MMSE) score between 24 and 30. Subjects' consent was obtained according to the Declaration of Helsinki (BMJ 1991;302:1194) and the Ethical Committees of all participating institutions in which the clinical trial was performed. The demographic characteristics of the full clinical trial sample have been described in detail elsewhere [Petersen et al.,2005]. The primary outcome of the study was defined as conversion to possible or probable AD according to the National Institute of Neurologic and Communicative Disorders and Stroke and the AD and Related Disorders Association (NINCDS‐ADRDA) criteria [McKhann et al.,1984]. Twenty‐four of the 69 sites opted to participate in the MRI arm of the study. All enrollees at these 24 sites were approached for participation in the MRI substudy and those who were willing to participate and had no contraindications to MRI were included. The final sample of the MRI arm consisted of 194 participants who received in addition to all standard clinical trial procedures a baseline and a 3‐year MRI scan. The MCIc group received an additional scan at the time of conversion to AD.
Our goal was to examine the relationship between the independently performed MTA visual rating and hippocampal atrophy measured quantitatively with the radial atrophy method [Thompson et al.,2004]. The pool of eligible subjects consisted of the 190 subject cohort previously included in the MTA rating analyses and reported in DeCarli et al. [2007]. Of these 190 subjects, 169 had a baseline scan of sufficient quality to allow for accurate and reliable hippocampal tracing and constitute the final cohort of subjects used in our baseline analyses. Of these 169 subjects, 154 received MTA score < 2 (none to very mild atrophy) while 15 received MTA score ≥ 2 (moderate to severe atrophy) as reported in [DeCarli et al.,2007].
Our longitudinal analyses investigated the magnitude of change occurring among MTA < 2 subjects over a 3‐year period and compared atrophy progression among those who converted to AD (MCIc) versus those who did not (MCInc). These analyses included MTA < 2 subjects with traceable hippocampi who provided longitudinal imaging data (N = 111). Forty‐eight of 111 subjects converted to possible or probable AD (MCIc) while the remaining 63 did not convert (MCInc). The sample size of MTA ≥ 2 (N = 15) precluded MCIc versus MCInc comparisons in that group.
The demographic variables for each sample are shown in Table I.
Table I.
Demographic and cognitive variables
| Variable | Full sample | |||
|---|---|---|---|---|
| All subjects, N = 169 | MTA < 2, N = 154 | MTA ≥ 2, N = 15 | MTA < 2 versus MTA ≥ 2, P‐value | |
| Age at BL, mean (SD) | 73.0 (6.4) | 72.5 (6.2) | 78.2 (5.7) | 0.001 |
| Education, mean (SD) | 15.0 (2.9) | 15.0 (2.9) | 14.7 (3.5) | 0.7 |
| Gender, % male | 54.4% | 54.6% | 53.3% | 0.93 |
| ApoE4+, N (%) | 67.5% | 66.2% | 80% | 0.39 |
| MMSE at BL, mean (SD) | 27.5 (1.8) | 27.6 (1.8) | 26.6 (2.1) | 0.05 |
| MTA<2 with follow‐up scan | ||||
| All MTA < 2, N = 111 | MTA < 2 MCIc, N = 48 | MTA < 2 MCInc, N = 63 | MTA < 2 MCIc versus MCInc, P‐value | |
| Age at BL, mean (SD) | 71.9 (6.3) | 72.5 (6.5) | 71.6 (6.2) | 0.45 |
| Education, mean (SD) | 15.2 (3.0) | 15.0 (3.3) | 15.3 (2.8) | 0.58 |
| Male gender | 58.6% | 50.0% | 65.1% | 0.11 |
| ApoE4+, N (%) | 66.7% | 87.5% | 50.8% | <0.001 |
| MMSE at BL, mean (SD) | 27.6 (1.8) | 26.8 (1.7) | 28.3 (1.5) | <0.001 |
MRI Acquisition, Preprocessing, and Analyses
All MRI data was acquired at 1.5T. Of the 24 sites, 14 used General Electric, 9 Siemens, and 1 Philips scanner. In our analyses, we used the 3D coronal spoiled gradient echo (SPGR) or equivalent T1‐weighted scan with minimum full‐time echo, minimum repetition time, 124 partitions, 25° flip angle, and 1.6‐mm slice thickness. Each subject's T2‐weighted scan was inspected for strokes or significant white matter hyperintensities at the main image repository site (Mayo Clinic, Rochester, MN), and only scans devoid of such abnormalities were shared with the University of California Los Angeles research team. The data used were checked for quality and compliance with the imaging protocol as previously described elsewhere [Jack et al.,2008].
The ADCS and the UCLA Institutional Review Board reviewed and approved the analyses reported here. Baseline and follow‐up images were each registered separately to the ICBM53 standardized brain template using a nine‐parameter linear transformation [Collins et al.,1994] and subjected to intensity normalization [Shattuck et al.,2001]. The hippocampal formations were manually traced by one researcher (AEG) blinded to age, sex, and diagnosis. The tracing protocol has been reported elsewhere [Narr et al.,2001; Pantel et al.,2000]. Any anatomical ambiguity was resolved in consultation with two hippocampal neuroanatomic atlases [Duvernoy,1988; Mai et al.,2004]. The hippocampal contours were converted to 3D parametric surface mesh models and a medial core for each hippocampus was computed. The distance from each hippocampal surface point to the medial core was derived. Individual 3D distance maps were generated and used for statistical comparisons [Apostolova et al.,2006a,b].
Baseline comparisons
These analyses included all subjects with traceable hippocampi who had MTA rating available (N = 169).
-
1
Baseline MTA < 2 versus MTA ≥ 2 comparison: the two groups compared included those with MTA < 2 (N = 154) versus those with MTA ≥ 2 (N = 15). This analysis was originally conceived as an extension to the visual hippocampal grading reported by DeCarli et al. [2007]. We used multiple linear regression model with radial distance as the dependent and group diagnosis as the predictor variable while including, as covariates, those demographic variables that showed statistically significant between‐group differences and a significant effect on hippocampal radial distance (the latter was tested with a quadratic regression model).
-
2
3D comparison of the hippocampal atrophy associated with different MTA stages: we conducted an exploratory analysis of the changes in hippocampal morphology with incremental change of the MTA rating (i.e., greater atrophy on visual inspection). As MTA rating was only performed on the baseline data [see DeCarli et al. [2007]], only cross‐sectional analyses were possible. The following design was used: we separately divided the left and right 3D hippocampal models in five groups based on each hippocampus' average MTA score from four MTA raters. These five groups were an MTA = 0 group (average MTA score between 0 and 0.24), a MTA = 0.5 group (average MTA between 0.25 and 0.74), a MTA = 1 group (average MTA score between 0.75 and 1.24), a MTA = 1.5 group (average MTA score between 1.25 and 1.74), a MTA = 2 group (average MTA score between 1.75 and 2.24), and a MTA > 2 (average MTA score > 2.25). Using the MTA = 0 group as the reference group, we computed the percent difference in radial distance between each group and the reference group. We also entered the individual MTA score as covariate in a general linear model that predicted the 3D radial distance at each hippocampal surface point for each subject. An animation of the hippocampal morphometric changes with incremental worsening of the MTA score can be viewed as Supporting Information on the journal's website.
Longitudinal comparisons
These analyses were limited to those subjects who had minimal hippocampal atrophy (MTA < 2) and provided longitudinal imaging data.
-
1
MTA < 2 baseline versus follow‐up comparison: we first compared the baseline versus follow‐up hippocampal data of all subjects with MTA < 2. For the follow‐up comparison, we censored the imaging data for the MCIc group at time of conversion (i.e., we used their conversion as opposed to 3‐year follow‐up scan when available) as our goal was to study disease progression in the MCI stage. As the conversion scan was taken at the time of diagnosis of possible or probable AD, the time between baseline and follow‐up scanning was systematically shorter in converters versus nonconverters. We used a quadratic regression model to investigate for potential effect of time (between‐scan interval) on hippocampal atrophy (radial distance in mm). This analysis did not indicate an association between interval time and atrophy.
-
2
MTA < 2 baseline and follow‐up MCIc versus MCInc comparisons: we compared the MCIc versus MCInc groups at baseline and at follow‐up. As described earlier, we used the conversion scans of the MCIc group in the follow‐up comparison. For this and the MTA < 2 baseline MCInc versus follow‐up MCIc comparison analysis outlined below, we used multiple linear regression model with radial distance as the dependent and group diagnosis as the predictor variable while including those demographic variables that showed statistically significant between‐group differences as covariates.
-
3
MTA < 2 baseline MCInc versus follow‐up MCIc comparison: to more accurately determine and illustrate hippocampal atrophy progression in MCIc in the absence of a true disease‐free group (e.g., cognitively normal elderly), we compared the conversion hippocampal maps of the MCIc group to the baseline hippocampal maps of MCInc group. This way the baseline data of the MCInc group served as an internal control allowing us to demonstrate the interim disease‐associated hippocampal atrophy in MCIc.
Cox proportional hazards analysis
We analyzed the association between left and right CA1 atrophy (mean CA1 radial distance in mm) and future conversion to dementia using Cox proportional hazards model while adjusting for age, education, and gender. We also standardized and compared the predictive value of CA1 radial distance and MTA rating for future progression to AD.
All statistical significance maps were corrected for multiple comparisons by applying permutation testing on the suprathreshold area of statistics at a threshold of P < 0.01 for uncorrected and P < 0.05 for age/ApoE4 corrected maps. This approach has been described in detail elsewhere [Thompson et al.,2003,2004].
RESULTS
The demographic data is shown in Table I. The MTA ≥ 2 group was significantly older (P = 0.001) and had lower MMSE score (P = 0.05) relative to the MTA < 2 group at baseline. Over the 3‐year follow‐up period, 60% of the subjects with MTA ≥ 2 and 33.8% of the subjects with MTA < 2 converted to possible or probable AD. Within the MTA < 2 group, there were 48 MCIc and 63 MCInc. MCIc with MTA < 2 had larger proportion of ApoE‐4 carriers (P < 0.001) and lower MMSE at baseline (P < 0.001) relative to MCInc with MTA < 2. There were no significant education or gender differences in either comparison.
Results from the baseline MTA < 2 versus MTA ≥ 2 comparison are shown in Figure 1. We hypothesized that relative to MTA < 2 the MTA ≥ 2 subjects will have greater atrophy in CA1 and subiculum and possibly CA2/3. The 3D statistical maps revealed greater left‐sided hippocampal atrophy in MTA ≥ 2 versus MTA < 2 (left P corrected = 0.08, right P corrected = 0.4, corrected for age). The areas where trend‐level significant between‐group differences were seen showed 10–30% greater atrophy in MTA ≥ 2.
Figure 1.

Baseline MTA < 2 versus MTA ≥ 2 comparison. Top row—schematic representation of the hippocampal subfields based on Duvernoy [Duvernoy,1988] and West and Gunderson [1990]. Middle row—3D statistical maps showing areas where MTA ≥ 2 subjects show greater atrophy relative to MTA < 2 at baseline (significant areas appear in red and white; blue denotes P=0.1 or greater). Bottom row—ratio maps showing the quantitative between‐group differences (in %).
The maps of relative atrophy between MTA = 1, MTA = 2, and MTA > 2 versus MTA 0 are shown in Figure 2. An animation of the hippocampal morphometric changes with incremental worsening of the MTA score can be viewed as Supporting Information on the journal's website. Figure 2 and the animation show that even when no hippocampal atrophy can be visually appreciated [i.e., MTA = 1, when the only abnormality detectable by the human eye is the mildly dilated choroid fissure, see Korf et al. [2004]] the hippocampal formation has already undergone structural changes that could be ascertained with an advanced 3D mapping technique such as the radial distance technique. This finding is further supported by supplementary Figure 1 provided as Supporting Information on the journal's website, which documents the presence of significantly greater atrophy in MTA < 1 converters versus MTA < 1 nonconverters. The ratio maps of supplementary Figure 1 document that the majority of these atrophic changes localize to the CA1 and subicular areas.
Figure 2.
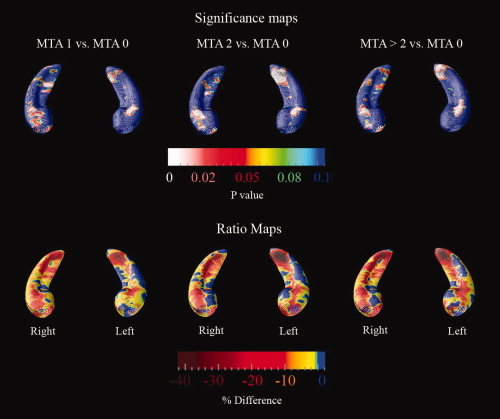
MTA subgroup comparisons. The top row maps show areas where significant between‐group differences were observed in the specific comparisons. The bottom row maps show the quantitative between‐group differences (in %). [Color figure can be viewed in the online issue, which is available at www.interscience.wiley.com.]
The correlations between MTA rating and hippocampal radial distance can be seen in Figure 3 (bottom row). Significant correlations between radial distance and MTA scores were seen in all hippocampal subfields bilaterally (middle row). After multiple comparison correction the correlations of MTA with left and right hippocampal radial distance remained significant (left P corrected = 0.0001, right P corrected = 0.0003), see middle row of supplementary Figure 2 provided as Supporting Information on the journal's website.
Figure 3.

Correlation between MTA rating and hippocampal radial distance at baseline. The top row shows a schematic representation of the hippocampal subfields based on Duvernoy [1988] and West and Gunderson [1990]. [Color figure can be viewed in the online issue, which is available at www.interscience.wiley.com.]
In the MTA < 2 baseline versus follow‐up comparison, we tested the hypothesis that there will be interim increase in hippocampal atrophy affecting CA1 and subiculum. The 3D statistical maps in supplementary Figure 2 revealed (middle row) more significant left‐sided interim hippocampal atrophy (left P corrected = 0.008, right P corrected = 0.05). The quantitative maps shown in the bottom row of supplementary Figure 2 provided as Supporting Information on the journal's website revealed that areas showing significant change underwent 5–10% atrophy over the course of the study. Changes over time appeared in the subiculum as well as CA1‐3.
With the MTA < 2 baseline and follow‐up MCIc versus MCInc comparisons, we tested the hypothesis that MCI subjects predestined to progress to AD (MCIc) will have significantly greater atrophy of the subiculum and CA1 at both time points and new CA2‐3 atrophy at follow‐up relative to MCInc group. The 3D significance maps can be seen in Figure 4. The hippocampi showed statistically significant between group differences both at baseline (left P corrected = 0.002; right P corrected = 0.006, corrected for ApoE4 status) and at follow‐up (left P corrected = 0.002; right P corrected = 0.0003, corrected for ApoE4 status). MCIc showed greater involvement of the subiculum and CA1‐3 relative to MCInc at both time points. Statistically significant areas showed 10–20% difference.
Figure 4.

MTA < 2 MCIc versus MCInc comparison. Top row—schematic representation of the hippocampal subfields based on Duvernoy [1988] and West and Gunderson [1990]. Middle rows—3D statistical maps of the baseline and follow‐up MCIc versus MCInc comparisons. Bottom rows—quantitative between‐group difference between MCIc and MCInc at baseline and follow‐up (in %). [Color figure can be viewed in the online issue, which is available at www.interscience.wiley.com.]
Our goal in the MTA < 2 baseline MCInc versus follow‐up MCIc comparison was to develop a map sequence that will best show disease progression in MCIc. To accomplish this, we used the MCInc at baseline as a reference group for both the baseline (MCIc at baseline) and the follow‐up (MCIc at follow‐up) comparison. Thus, the regional increases in hippocampal atrophy from the top row images to the middle row images of Figure 5 represents the absolute disease‐associated changes in the MCIc cohort. In addition to progressive involvement of the CA1 and subiculum, the CA2‐3 area was progressively involved in the MCIc group. The areas with most pronounced interim atrophy progression showed 3–10% radial distance loss.
Figure 5.

These maps illustrate the absolute spread of hippocampal atrophy in MCIc from baseline (top row) to follow‐up (second row). The bottom row 3D maps show the interim 3‐year hippocampal atrophy in the MCIc group alone (in %). [Color figure can be viewed in the online issue, which is available at www.interscience.wiley.com.]
Cox Proportional Hazards Analysis
Our Cox proportional hazards models showed that atrophy of the right but not left CA1 area was associated with conversion to dementia. In the unadjusted model, a person with 1 mm greater right CA1 radial distance had 50% reduced hazard for future conversion to dementia (hazard ratio HR = 0.5, 95% CI = 0.28–0.91, P = 0.02) relative to those with 1 mm smaller radial distance. After adjusting for age, education and gender the hazard was similar (HR = 0.53, 95% CI = 0.29–1.0, P = 0.048). In models using standardized CA1 and standardized MTA measures (recoded so that lower scores correspond to atrophy) adjusting for age, gender, and education to predict conversion to AD, a one SD decrease in right CA1 was associated with a 34% increased hazard of conversion (HR = 0.74, 95% CI = 0.56–0.998, P = 0.048) and a one SD decrease in MTA is associated with a 68% increased hazard of conversion (HR = 0.59, 95% CI = 0.46–0.78, P < 0.001). However, in our dataset, CA1 radial distance and MTA rating showed different distributions such that one SD decrease in MTA actually corresponds to a 1.44 SD decrease in CA1. A 1.44 SD decrease in CA1 in turn correspond to a 55% increased hazard of conversion.
DISCUSSION
Several imaging analyses of the ADCS MCI Donepezil/Vitamin E trial have been previously conducted. Jack et al. [2008] using the region‐of‐interest technique reported no significant difference in annualized hippocampal atrophy rates between the placebo, donepezil, and vitamin E groups. MCIc had greater annualized atrophy rate relative to MCInc [−6.8% (3.3) vs. −3.9% (1.4), resp.; P < 0.0001].
Fleisher et al. [2008] analyzed the predictive value of hippocampal volumes for conversion to AD. The authors reported that hippocampal volumes provide the highest predictive accuracy when compared with demographic and clinical variables (age, family history of AD, education, sex, delayed 10‐word list recall, New York University delayed Paragraph recall and ADAS‐cog total score), ventricular and whole brain volumes. The final best multivariate predictive model (accuracy 78.8; 95% CI = 0.7–0.9), however, did not include any of the imaging variables: it consisted of the three cognitive variables. The authors concluded that more advanced imaging analysis techniques need to be tested to ascertain their potential utility as predictive biomarkers for epidemiological and clinical trial studies.
DeCarli et al. [2007] used the imaging arm of the ADCS MCI Donepezil/Vitamin E study to assess the utility of the visual MTA rating scale for predicting conversion to AD and reported that an MTA score ≥ 2 doubles the risk for future conversion to AD (HR = 2.3, 95% CI = 1.1–4.9; P = 0.03). These MTA ratings were used in the present analyses.
Our work extends the previously reported findings [DeCarli et al.,2007; Fleisher et al.,2008] and improves our understanding of the subfield specific changes occurring in the hippocampus during the MCI state. Our baseline analyses (baseline MTA < 2 vs. MTA ≥ 2 comparison and the 3D comparison of the hippocampal atrophy associated with different MTA stages: see supplementary Figures 1 and 2 and the animation provided as Supporting Information on the Journal's website) demonstrate that subjects with MTA rating ≥2 have 10–30% greater hippocampal atrophy in the subiculum and CA1 region. Next, we confirmed that visually rated hippocampal atrophy is associated with regionally pronounced changes. We also found that amnestic MCI subjects with minimal MTA rating where the only visually appreciable abnormality is increased width of the choroid fissure while the temporal horn and the height of the hippocampus is considered within normal limits (i.e., MTA = 1 [see detailed MTA rating description in Korf et al. [2004]] already show regionally pronounced hippocampal changes that cannot be easily captured by visual rating (see Figure 1 and the animation provided as supplementary material).
As one can predict relative to MTA < 1 nonconverters MTA < 1 converters show atrophic changes in the subiculum and CA1 (supplementary Figure 1). MTA rating was significantly related to atrophic changes in all hippocampal subfields (Figure 3).
Although MCIc showed bilaterally progressive atrophy of the hippocampal formations (see Figures 4 and 5) only the right CA1 radial distance showed a significant association with progression to dementia in the Cox proportional hazard regression analysis. The predictive value of the MTA rating scale and CA1 radial distance while controlling for age, gender, and education shows promise for the use of both of these measures in AD imaging analyses and in clinical trials. Detection of subtle hippocampal changes with the radial atrophy technique has also been reported in cognitively normal elderly 3 years prior to diagnosis of MCI and 7 years prior to diagnosis of AD [Apostolova et al.,2008].
The MTA < 2 baseline versus follow‐up comparison conducted irrespective of conversion status (supplementary Figure 2) revealed more significant left‐sided interim hippocampal atrophy. However, once the cohort was split and compared based on their conversion status, the changes in the right hippocampus showed a statistically greater interim change relative to the left, consistent with our Cox proportional hazard regression results. Whether this finding reflects a fundamental feature of the biology of AD or simply reflects a bias of this particular sample of subjects will need to be ascertained in future studies.
By restricting our longitudinal analyses to the MTA < 2 group, we focused our analyses on the earliest possible hippocampal changes. This allowed us to better detect how hippocampal atrophy evolves with time. We observed a subfield‐specific spread that agrees with the one documented in the pathologic literature [Schonheit et al.,2004]. The data from our MTA < 2 MCIc versus MCInc analyses presented in Figures 4 and 5 provides support for our hypothesis of prominent early atrophy in CA1 and subiculum with subsequent greater involvement of the CA2‐3 subfields. These findings build upon evidence reported previously by our group and others [Apostolova et al.,2006a,b, 2008; Csernansky et al.,2000].
The left‐sided lateralization of the disease process in our analyses with more significant left‐sided between group differences could result from ascertainment bias. The cognitive testing in this clinical trial was heavily biased toward verbally mediated tasks and thus much more sensitive to left‐sided pathology.
Strengths of our study include the selection of a large well‐defined prospectively collected and exceptionally well‐characterized longitudinal MCI sample and the use of a sensitive state‐of‐the‐art hippocampal analytic technique. Neither the schematic subfield representation used in this manuscript nor any of the other automated/semiautomated or manual approaches reported in the literature that obtain subfield specific information have been validated by a direct imaging/histopathological correlation study and therefore subfield assignments used in these studies are speculative. Another limitation of any clinical trial sample is that subjects enrolled in clinical trials are frequently healthier than the general diseased population, as patients with multiple medical problems are excluded. Likewise, any potential disease heterogeneity may be underrepresented, given the strict inclusion/exclusion criteria. Epidemiological MRI datasets may be better positioned to answer questions about disease course as such datasets aim to enroll a representative sample of the general healthy/diseased population. Nevertheless, studying clinical trial samples has tremendous value. Clinical trials aim to enrol a “clean” subject pool with a specific tightly defined clinical presentation, minimal co‐morbidities, and carefully mandated allowable medication regimens. Thus, in principle, an imaging biomarker may prove very useful in epidemiological studies but may fail to deliver in clinical trial settings [Fleisher et al.,2008; Fox et al.,2005]. Techniques such as ours may be used to study disease progression and describe disease biomarker behavior in a typical randomized double‐blind placebo‐controlled study cohort. They can also inform the selection of biomarkers for future experimental therapeutic studies. Limitations of the MTA scale have been published elsewhere [DeCarli et al.,2007].
Supporting information
Additional supporting information may be found in the online version of this article.
Supporting Figure 1
Supporting Figure 2
This article was published online on 8 February 2010. An error was subsequently identified. This notice is included in the online version to indicate that this has been corrected 20 September 2010.
REFERENCES
- Apostolova LG, Dinov ID, Dutton RA, Hayashi KM, Toga AW, Cummings JL, Thompson PM ( 2006a): 3D comparison of hippocampal atrophy in amnestic mild cognitive impairment and Alzheimer's disease. Brain 129 ( Pt 11): 2867–2873. [DOI] [PubMed] [Google Scholar]
- Apostolova LG, Dutton RA, Dinov ID, Hayashi KM, Toga AW, Cummings JL, Thompson PM ( 2006b): Conversion of mild cognitive impairment to Alzheimer disease predicted by hippocampal atrophy maps. Arch Neurol 63: 693–699. [DOI] [PubMed] [Google Scholar]
- Apostolova LG, Mosconi L, Thompson PM, Green AE, Hwang KS, Ramirez A, Mistur R, Tsui WH, de Leon MJ ( 2008): Subregional hippocampal atrophy predicts future decline to Alzheimer's dementia in cognitively normal subjects. Neurobiol Aging (epub ahead of print). doi: 10.1016/j.neurobiolaging. 2008.08.008. [DOI] [PMC free article] [PubMed] [Google Scholar]
- Bobinski M, Wegiel J, Wisniewski HM, Tarnawski M, Reisberg B, Mlodzik B, de Leon MJ, Miller DC ( 1995): Atrophy of hippocampal formation subdivisions correlates with stage and duration of Alzheimer disease. Dementia 6: 205–210. [DOI] [PubMed] [Google Scholar]
- Bobinski M, Wegiel J, Tarnawski M, Bobinski M, Reisberg B, de Leon MJ, Miller DC, Wisniewski HM ( 1997): Relationships between regional neuronal loss and neurofibrillary changes in the hippocampal formation and duration and severity of Alzheimer disease. J Neuropathol Exp Neurol 56: 414–420. [DOI] [PubMed] [Google Scholar]
- Braak H, Braak E ( 1991): Neuropathological stageing of Alzheimer‐related changes. Acta Neuropathol (Berl) 82: 239–259. [DOI] [PubMed] [Google Scholar]
- Collins DL, Neelin P, Peters TM, Evans AC ( 1994): Automatic 3D intersubject registration of MR volumetric data in standardized Talairach space. J Comput Assist Tomogr 18: 192–205. [PubMed] [Google Scholar]
- Csernansky JG, Wang L, Joshi S, Miller JP, Gado M, Kido D, McKeel D, Morris JC, Miller MI ( 2000): Early DAT is distinguished from aging by high‐dimensional mapping of the hippocampus. Dementia of the Alzheimer type. Neurology 55: 1636–1643. [DOI] [PubMed] [Google Scholar]
- Csernansky JG, Wang L, Swank J, Miller JP, Gado M, McKeel D, Miller MI, Morris JC ( 2005): Preclinical detection of Alzheimer's disease: Hippocampal shape and volume predict dementia onset in the elderly. Neuroimage 25: 783–792. [DOI] [PubMed] [Google Scholar]
- De Leon MJ, George AE, Golomb J, Tarshish C, Convit A, Kluger A, De Santi S, McRae T, Ferris SH, Reisberg B, Ince C, Rusinek H, Bobinski M, Quinn B, Miller DC, Wisniewski HM ( 1997): Frequency of hippocampal formation atrophy in normal aging and Alzheimer's disease. Neurobiol Aging 18: 1–11. [DOI] [PubMed] [Google Scholar]
- DeCarli C, Frisoni GB, Clark CM, Harvey D, Grundman M, Petersen RC, Thal LJ, Jin S, Jack CR Jr, Scheltens P ( 2007): Qualitative estimates of medial temporal atrophy as a predictor of progression from mild cognitive impairment to dementia. Arch Neurol 64: 108–115. [DOI] [PubMed] [Google Scholar]
- Dickerson BC, Goncharova I, Sullivan MP, Forchetti C, Wilson RS, Bennett DA, Beckett LA, DeToledo‐Morrell L ( 2001): MRI‐derived entorhinal and hippocampal atrophy in incipient and very mild Alzheimer's disease. Neurobiol Aging 22: 747–754. [DOI] [PubMed] [Google Scholar]
- Dubois B, Feldman HH, Jacova C, Dekosky ST, Barberger‐Gateau P, Cummings J, Delacourte A, Galasko D, Gauthier S, Jicha G, et al. ( 2007): Research criteria for the diagnosis of Alzheimer's disease: Revising the NINCDS‐ADRDA criteria. Lancet Neurol 6( 8): 734–46. [DOI] [PubMed] [Google Scholar]
- Duvernoy H. ( 1988): The human hippocampus. An atlas of applied anatomy. Munich: J.F. Bergmann Verlag. [Google Scholar]
- Fleisher AS, Sun S, Taylor C, Ward CP, Gamst AC, Petersen RC, Jack CR Jr, Aisen PS, Thal LJ ( 2008): Volumetric MRI vs clinical predictors of Alzheimer disease in mild cognitive impairment. Neurology 70: 191–199. [DOI] [PubMed] [Google Scholar]
- Fox NC, Black RS, Gilman S, Rossor MN, Griffith SG, Jenkins L, Koller M ( 2005): Effects of Abeta immunization (AN1792) on MRI measures of cerebral volume in Alzheimer disease. Neurology 64: 1563–1572. [DOI] [PubMed] [Google Scholar]
- Haroutunian V, Perl DP, Purohit DP, Marin D, Khan K, Lantz M, Davis KL, Mohs RC ( 1998): Regional distribution of neuritic plaques in the nondemented elderly and subjects with very mild Alzheimer disease. Arch Neurol 55: 1185–1191. [DOI] [PubMed] [Google Scholar]
- Jack CR Jr, Petersen RC, Xu YC, O'Brien PC, Smith GE, Ivnik RJ, Boeve BF, Waring SC, Tangalos EG, Kokmen E ( 1999): Prediction of AD with MRI‐based hippocampal volume in mild cognitive impairment. Neurology 52: 1397–1403. [DOI] [PMC free article] [PubMed] [Google Scholar]
- Jack CR Jr, Shiung MM, Gunter JL, O'Brien PC, Weigand SD, Knopman DS, Boeve BF, Ivnik RJ, Smith GE, Cha RH, Tangalos EG, Petersen RC ( 2004): Comparison of different MRI brain atrophy rate measures with clinical disease progression in AD. Neurology 62: 591–600. [DOI] [PMC free article] [PubMed] [Google Scholar]
- Jack CR Jr, Petersen RC, Grundman M, Jin S, Gamst A, Ward CP, Sencakova D, Doody RS, Thal LJ ( 2008): Longitudinal MRI findings from the vitamin E and donepezil treatment study for MCI. Neurobiol Aging 29: 1285–1295. [DOI] [PMC free article] [PubMed] [Google Scholar]
- Jicha GA, Parisi JE, Dickson DW, Johnson K, Cha R, Ivnik RJ, Tangalos EG, Boeve BF, Knopman DS, Braak H, Petersen RC ( 2006): Neuropathologic outcome of mild cognitive impairment following progression to clinical dementia. Arch Neurol 63: 674–681. [DOI] [PubMed] [Google Scholar]
- Korf ES, Wahlund LO, Visser PJ, Scheltens P ( 2004): Medial temporal lobe atrophy on MRI predicts dementia in patients with mild cognitive impairment. Neurology 63: 94–100. [DOI] [PubMed] [Google Scholar]
- Mai JK, Paxinos G, Assheuer JK. ( 2004): Atlas of the Human Brain. San Diego, CA: Elsevier Academic Press. [Google Scholar]
- McKhann G, Drachman D, Folstein M, Katzman R, Price D, Stadlan EM ( 1984): Clinical diagnosis of Alzheimer's disease: Report of the NINCDS‐ADRDA Work Group under the auspices of Department of Health and Human Services Task Force on Alzheimer's Disease. Neurology 34: 939–944. [DOI] [PubMed] [Google Scholar]
- Morra JH, Tu Z, Apostolova LG, Green AE, Avedissian C, Madsen SK, Parikshak N, Hua X, Toga AW, Jack CR Jr, Schuff N, Weiner MW, Thompson PM ( 2009a): Automated 3D mapping of hippocampal atrophy and its clinical correlates in 400 subjects with Alzheimer's disease, mild cognitive impairment and elderly controls. Hum Brain Mapp 30: 2766–2788. [DOI] [PMC free article] [PubMed] [Google Scholar]
- Morra JH, Tu Z, Apostolova LG, Green AE, Avedissian C, Madsen SK, Parikshak N, Toga AW, Jack CR Jr, Schuff N, Weiner MW, Thompson PM ( 2009b). Automated mapping of hippocampal atrophy in 1‐year repeat MRI data from 490 subjects with Alzheimer's disease, mild cognitive impairment, and elderly controls. Neuroimage 45 ( 1 Suppl.): S3–S15. [DOI] [PMC free article] [PubMed] [Google Scholar]
- Mueller SG, Dickerson BC. ( 2008): Atrophy accelerates with conversion from mild cognitive impairment to Alzheimer disease. Neurology 70 ( 19, Pt 2): 1728–1729. [DOI] [PubMed] [Google Scholar]
- Narr KL, Thompson PM, Sharma T, Moussai J, Blanton R, Anvar B, Edris A, Krupp R, Rayman J, Khaledy M, Toga AW ( 2001): Three‐dimensional mapping of temporo‐limbic regions and the lateral ventricles in schizophrenia: Gender effects. Biol Psychiatr 50: 84–97. [DOI] [PubMed] [Google Scholar]
- Pantel J, O'Leary DS, Cretsinger K, Bockholt HJ, Keefe H, Magnotta VA, Andreasen NC ( 2000): A new method for the in vivo volumetric measurement of the human hippocampus with high neuroanatomical accuracy. Hippocampus 10: 752–758. [DOI] [PubMed] [Google Scholar]
- Petersen RC, Doody R, Kurz A, Mohs RC, Morris JC, Rabins PV, Ritchie K, Rossor M, Thal L, Winblad B ( 2001): Current concepts in mild cognitive impairment. Arch Neurol 58: 1985–1992. [DOI] [PubMed] [Google Scholar]
- Petersen RC, Thomas RG, Grundman M, Bennett D, Doody R, Ferris S, Galasko D, Jin S, Kaye J, Levey A, Pfeiffer E, Sano M, van Dyck CH, Thal LJ ( 2005): Vitamin E and donepezil for the treatment of mild cognitive impairment. N Engl J Med 352: 2379–2388. [DOI] [PubMed] [Google Scholar]
- Price JL, Morris JC ( 1999): Tangles and plaques in nondemented aging and “preclinical” Alzheimer's disease. Ann Neurol 45: 358–368. [DOI] [PubMed] [Google Scholar]
- Rossler M, Zarski R, Bohl J, Ohm TG ( 2002): Stage‐dependent and sector‐specific neuronal loss in hippocampus during Alzheimer's disease. Acta Neuropathol 103: 363–369. [DOI] [PubMed] [Google Scholar]
- Scheltens P, Leys D, Barkhof F, Huglo D, Weinstein HC, Vermersch P, Kuiper M, Steinling M, Wolters EC, Valk J ( 1992): Atrophy of medial temporal lobes on MRI in “probable” Alzheimer's disease and normal ageing: Diagnostic value and neuropsychological correlates. J Neurol Neurosurg Psychiatry 55: 967–972. [DOI] [PMC free article] [PubMed] [Google Scholar]
- Scheltens P, Launer LJ, Barkhof F, Weinstein HC, van Gool WA ( 1995): Visual assessment of medial temporal lobe atrophy on magnetic resonance imaging: Interobserver reliability. J Neurol 242: 557–560. [DOI] [PubMed] [Google Scholar]
- Schonheit B, Zarski R, Ohm TG ( 2004): Spatial and temporal relationships between plaques and tangles in Alzheimer‐pathology. Neurobiol Aging 25: 697–711. [DOI] [PubMed] [Google Scholar]
- Shattuck DW, Sandor‐Leahy SR, Schaper KA, Rottenberg DA, Leahy RM ( 2001): Magnetic resonance image tissue classification using a partial volume model. Neuroimage 13: 856–876. [DOI] [PubMed] [Google Scholar]
- Thompson PM, Hayashi KM, de Zubicaray G, Janke AL, Rose SE, Semple J, Herman D, Hong MS, Dittmer SS, Doddrell DM, Toga AW ( 2003): Dynamics of gray matter loss in Alzheimer's disease. J Neurosci 23: 994–1005. [DOI] [PMC free article] [PubMed] [Google Scholar]
- Thompson PM, Hayashi KM, De Zubicaray GI, Janke AL, Rose SE, Semple J, Hong MS, Herman DH, Gravano D, Doddrell DM, Toga AW ( 2004): Mapping hippocampal and ventricular change in Alzheimer disease. Neuroimage 22: 1754–1766. [DOI] [PubMed] [Google Scholar]
- West MJ, Gundersen HJ ( 1990): Unbiased stereological estimation of the number of neurons in the human hippocampus. J Comp Neurol 296: 1–22. [DOI] [PubMed] [Google Scholar]
- West MJ, Kawas CH, Stewart WF, Rudow GL, Troncoso JC ( 2004): Hippocampal neurons in pre‐clinical Alzheimer's disease. Neurobiol Aging 25: 1205–1212. [DOI] [PubMed] [Google Scholar]
Associated Data
This section collects any data citations, data availability statements, or supplementary materials included in this article.
Supplementary Materials
Additional supporting information may be found in the online version of this article.
Supporting Figure 1
Supporting Figure 2