

Abstract
Structural imaging based on magnetic resonance is an integral part of the clinical assessment of patients with suspected Alzheimer dementia. Prospective data on the natural history of change in structural markers from preclinical to overt stages of Alzheimer disease are radically changing how the disease is conceptualized, and will influence its future diagnosis and treatment. Atrophy of medial temporal structures is now considered to be a valid diagnostic marker at the mild cognitive impairment stage. Structural imaging is also included in diagnostic criteria for the most prevalent non-Alzheimer dementias, reflecting its value in differential diagnosis. In addition, rates of whole-brain and hippocampal atrophy are sensitive markers of neurodegeneration, and are increasingly used as outcome measures in trials of potentially disease-modifying therapies. Large multicenter studies are currently investigating the value of other imaging and nonimaging markers as adjuncts to clinical assessment in diagnosis and monitoring of progression. The utility of structural imaging and other markers will be increased by standardization of acquisition and analysis methods, and by development of robust algorithms for automated assessment.
Introduction
Clinical and neuropathological studies have greatly advanced our knowledge of the pathophysiology and progression of Alzheimer disease (AD). This disease is associated with progressive accumulation of abnormal proteins (amyloid-β [Aβ] and hyperphosphorylated tau) in the brain, which leads to progressive synaptic, neuronal and axonal damage. Neurobiological changes occur years before symptoms appear, with a stereotypical pattern of early medial temporal lobe (entorhinal cortex and hippocampus) involvement, followed by progressive neocortical damage.1,2 The delay in emergence of the cognitive correlates of these changes suggests that the toxic effects of tau and/or Aβ progressively erode ‘brain reserve’ until a clinical threshold is surpassed and amnestic symptoms develop. For example, amnestic mild cognitive impairment (MCI)—memory disturbance in the absence of dementia—is followed by more-widespread cognitive deficits in multiple domains until a disability threshold is reached and traditional diagnostic criteria for probable AD are fulfilled.3 The prospect of disease-modifying drugs that can slow or prevent disease progression has prompted increased interest in identifying individuals with AD earlier and more accurately.
Several studies have shown that structural MRI estimates of tissue damage or loss in characteristically vulnerable brain regions, such as the hippocampus and entorhinal cortex, are predictive of progression of MCI to AD. Moreover, the clinical utility of MRI in differentiating AD from other pathologies, such as vascular or non-Alzheimer neurodegeneration, has been established. Finally, MRI-based estimates of progression; for example, atrophy rates, might be used to assess potential disease-modifying drugs in phase II and III trials.
In this article, we review current knowledge on structural MRI changes in AD, focusing particularly on measures of atrophy in typical late-onset sporadic AD. We also address other promising biomarkers that can set structural loss in the broader context of molecular, metabolic and functional changes at different stages of the disease. Current and future methods to measure regional atrophy in clinical settings have been reviewed elsewhere.4–6
Atrophy as a neurodegeneration marker
MRI-based measures of atrophy are regarded as valid markers of disease state and progression for several reasons. Atrophy seems to be an inevitable, inexorably progressive concomitant of neurodegeneration. The topography of brain tissue loss correlates well with cognitive deficits, both cross-sectionally and longitudinally. Structural brain changes map accurately upstream to Braak stages of neurofibrillary tangle deposition7,8 and downstream to neuropsychological deficits.9,10 The earliest sites of tau deposition and MRI-based atrophic changes typically lie along the perforant (polysynaptic) hippocampal pathway (entorhinal cortex, hippocampus and posterior cingulate cortex), consistent with early memory deficits.11,12 Later, atrophy in temporal, parietal and frontal neocortices is associated with neuronal loss, as well as language, praxic, visuospatial and behavioral impairments.13,14
Key points.
Brain atrophy detected by high-resolution MRI is correlated with both tau deposition and neuropsychological deficits, and is a valid marker of Alzheimer disease (AD) and its progression
The degree of atrophy of medial temporal structures such as the hippocampus is a diagnostic marker for AD at the mild cognitive impairment stage
Structural imaging markers are included in diagnostic criteria for non-AD dementias, such as vascular dementia, frontotemporal degeneration, dementia with Lewy bodies, and Creutzfeldt–Jakob disease, and can aid differential diagnosis
Whole-brain and hippocampal atrophy rates are sensitive markers of progression of neurodegeneration, and are increasingly used as surrogate outcomes in trials of potentially disease-modifying drugs
In the near future, imaging and cerebrospinal fluid markers of amyloid deposition and glucose metabolism could be integrated with automated assessment of structural markers for optimal diagnosis and monitoring
Rates of change in several structural measures, including whole-brain,15–19 entorhinal cortex,20 hippocampus9,21–23 and temporal lobe volumes,24,25 as well as ventricular enlargement,9,21,23,26 correlate closely with changes in cognitive performance, supporting their validity as markers of disease progression. The appropriate use of an atrophy marker in the clinic requires that its dynamics are known at the different stages of the disease, and that its relationship with the dynamics of other imaging and biological markers is understood. Atrophy measures change with disease progression over a wide range of AD disease severity. From MCI to well into the moderate dementia stage of AD, structural markers are more sensitive to change than are markers of Aβ deposition (as assessed through imaging or cerebrospinal fluid [CSF] analysis).18,27 In the asymptomatic to MCI stages, however, indirect evidence indicates that amyloid markers show more-substantial abnormalities than do structural markers (Figure 1).16,28–33
Figure 1.

Natural progression of cognitive and biological markers of Alzheimer disease: a theoretical model. Some markers are sensitive to disease state and useful for diagnosis; others are more sensitive to disease progression and useful as surrogate markers in clinical trials. a | Known natural history of cognitive markers implies that memory tests, which change relatively early in the disease course (1) and soon reach the maximal level of impairment (2), are useful for diagnosis at the MCI stage, but are less useful for tracking later disease progression (3). Verbal comprehension tests start to change later in the disease course: during MCI they show mild or no impairment (4), and are of limited use in diagnosis. These markers become more sensitive at the dementia stage, when the slope of change steepens (5). b | Amyloid markers (cerebrospinal fluid amyloid-β42 and PET amyloid tracer uptake) represent the earliest detectable changes in the Alzheimer disease course,28 but have already plateaued by the MCI stage.27 Functional and metabolic markers detected by task-dependent activation on functional MRI and 18F-fluorodeoxyglucose PET are abnormal by the MCI stage,29 and continue to change well into the dementia stage.30 Structural changes come later,27,31 following a temporal pattern mirroring tau pathology deposition.11,32 Abbreviations: AD, Alzheimer disease; MCI, mild cognitive impairment; NINCDS–ADRDA, National Institute of Neurological and Communicative Disorders and Stroke–Alzheimer's Disease and Related Disorders Association.
Macrostructural loss (atrophy) is accompanied by microstructural (dendritic, myelin and axonal) loss and metabolite changes, all of which are measurable with other magnetic resonance-based sequences. Magnetic resonance spectroscopy,34 diffusion-weighted imaging (DWI),35 fiber tracking,36 and magnetization transfer imaging37,38 are all either sensitive to early change or can add complementary information to atrophy measures. other MRI-based techniques, such as tissue perfusion with arterial spin labeling39,40 or functional measures of resting-state networks (particularly the default mode network),41,42 show promise as diagnostic markers, but have not yet been subjected to thorough validation. None of these techniques yet has an established role in clinical practice.
Diagnosing incipient Alzheimer disease
The key role of imaging in AD diagnosis is highlighted by the inclusion of imaging markers in proposed new criteria for earlier diagnosis of AD.43 These criteria build on traditional National Institute of Neurological and Communicative Disorders and Stroke–Alzheimer's Disease and Related Disorders Association criteria by keeping the requirement for objective memory deficits but removing the requirement that disability (dementia) must already be present. Instead, at least one of the following three markers is required: medial temporal atrophy, temporoparietal hypometabolism, and abnormal neuronal CSF markers (tau and/or Aβ). These criteria imply that structural imaging and other markers can reliably detect AD before dementia occurs; that is, at an MCI stage (Box 1).
Box 1. Early diagnosis of Alzheimer disease.
The concept of mild cognitive impairment (MCI) was developed in the 1990s to capture patients with early clinical signs of Alzheimer disease (AD) who did not yet fulfill the criteria for dementia. The amnestic variant of MCI features the following: memory complaints, preferably qualified by an informant; memory impairment for age, as indexed by low cognitive performance in one or more neuropsychological tests that tap into learning abilities (for example, prose recall, word list); preserved general cognitive function (for example, Mini-Mental State Examination score of 24 out of 30 or above); intact activities of daily living; and no dementia. About two-thirds of all patients with amnestic MCI harbor the pathological features of AD and develop the clinical syndrome of Alzheimer dementia within 5 years, whereas the remaining one-third have non-progressive or very slowly progressive causes of cognitive impairment (for example, depression or age-related cognitive impairment). Proposed new diagnostic criteria for AD developed in 200743 suggested that the disease can be recognized at the MCI stage if the patient is positive for at least one of the following four markers: medial temporal atrophy on MRI; temporoparietal cortical hypometabolism on 18F-fluorodeoxyglucose PET; abnormality of cerebrospinal fluid markers (tau, amyloid-β42 or phospho-tau); and positivity on amyloid imaging with PET. These criteria need to be validated before being applied in clinical populations.
Of all the MRI markers of AD (Box 2),44 hippocampal atrophy assessed on high-resolution T1-weighted MRI is the best established and validated. The simplest way to assess atrophy of the medial temporal lobes is by visual inspection of coronal T1-weighted MRI. Several rating scales to quantify the degree of atrophy have been developed and are widely used. Visual rating scales provide ≈80–85% sensitivity and specificity to distinguish patients with AD from those with no cognitive impairment, and only slightly lower sensitivity and specificity levels for diagnosing amnestic MCI. These scales also have good predictive power to anticipate decline in MCI.45–48 Visual rating also correlates well with underlying pathology and has high diagnostic accuracy against a pathologically verified diagnosis of AD.49
Box 2. Structural MRI-based markers of Alzheimer disease.
Current clinical MRI scanners with 1.5T or 3T magnets allow acquisition of high-resolution digital images of the brain in exquisite structural detail, with excellent tissue contrast and spatial resolution of ≤1 mm. Atrophy of target structures can be estimated through procedures with varying levels of human input. Visual rating scales allow atrophy of medial temporal lobe structures to be categorized into discrete levels of increasing severity. Structures with definite boundaries can be labeled by manual outlining and volumes can be computed. Automated algorithm pipelines can align an individual digital brain to a reference template on a voxel-by-voxel basis and automatically label brain structures on the basis of prior knowledge of a digital atlas. In either case, volumes can be normalized to head size and compared with a normative population. A variety of voxel-based techniques treat the information of each voxel with mathematical models, which allow the production of maps of density, volume or other features of the brain tissue, and derived maps of significance, variance and other statistical measures.
Despite its convoluted structure, the boundaries of the hippocampus (and adjacent CSF spaces) are easier for human operators or automated algorithms to recognize than the amygdala, entorhinal cortex or parahippocampal gyrus. This is because the anatomical boundaries of the hippocampus are distinct on high-resolution T1-weighted MRI scans around most of the surface of this structure. Hippocampal volume measured in vivo by MRI correlates with Braak stage and neuronal counts.50–52 At the mild dementia stage of AD, hippocampal volume is already reduced by 15–30% relative to controls,38 and in the amnestic variant of MCI the volume is reduced by 10–15%53 (a meta-analysis of hippocampal MRI studies is provided elsewhere54). A recent meta-analysis estimated that medial temporal atrophy has ≈73% sensitivity and ≈81% specificity for predicting whether patients with amnestic MCI will convert to dementia.55 If medial temporal atrophy is measured with a continuous metric such as hippocampal volume, specificity might be increased, but at the cost of reduced sensitivity. If hippocampal atrophy is used as an inclusion criterion for clinical trials in MCI, a trade-off ensues between a relatively low proportion of screened negatives with a more-contaminated sample of screened positives and a higher proportion of screened negatives but a ‘cleaner’ group to treat and follow (Figure 2). Indeed, contamination of MCI groups with non-Alzheimer cases might in part explain the failure of some trials with cholinesterase inhibitors in patients with MCI.56 Enrichment of MCI groups with true AD cases in clinical trials of drugs aiming to delay the development of dementia might lead to a significant increase in study power.57
Figure 2.

Progressive enrichment of a mild cognitive impairment cohort with future converters to Alzheimer dementia by screening for low hippocampal volume. Figures are computed from 339 patients with mild cognitive impairment from the North American Alzheimer's Disease Neuroimaging Initiative study with known conversion status at 12 month follow-up. The threshold for screening refers to the percentile of the distribution of hippocampal volume (average of right and left) in healthy elderly individuals. With an increasingly restrictive threshold, the ratio between true positives and false positives increases from 0.7 to 1.8, but the ratio of screened negatives to screened positives increases from 0.0 to 3.0.
Despite the evidence reported above, medial temporal atrophy is not sufficiently accurate on its own to serve as an absolute diagnostic criterion for the clinical diagnosis of AD at the MCI stage. High specificity is required to minimize a false-positive diagnosis of AD, and medial temporal atrophy by itself lacks the specificity to confidently exclude other dementias.58 To enhance the accuracy of structural markers, other structural and nonstructural measures can be added in an algorithmic formula to diagnose AD. Studies that included pathological confirmation of the diagnosis have shown that parietal atrophy combined with medial temporal lobe atrophy on MRI carries positive predictive value for diagnosing AD.59 Moreover, in 59 patients with amnestic MCI, 33 of whom converted to dementia in 19 months on average, those with both medial temporal atrophy (as rated visually45) and abnormal CSF biomarkers had a fourfold higher risk of progression to dementia than patients with either abnormality alone.60 Prediction of dementia was almost perfect (94% positive predictive value),60 but replication is still needed. CSF and MRI measures provided better prediction than either measure alone, although MRI measures were more accurate in a head-to-head comparison.8
Other atrophy markers have been suggested for early diagnosis of AD or to enrich MCI trials, but their validity and added value for predicting decline remains to be confirmed. These markers include analysis of whole-brain patterns of atrophy through use of support vector machines,61 the AD-specific structural abnormality index (STAND) score,10,62 patterns of hippocampal subfield atrophy63 structural changes in cholinergic nuclei of the basal forebrain,64 deformation-based morphometry of the gray and white matter,24 and measures of the lateral temporal and parietal cortex.65
Diagnosing non-Alzheimer conditions
For any diagnostic marker to be useful in practice, its capacity to separate two or more conditions that can be confused on clinical grounds is a necessary but not sufficient requirement. Clinical usefulness requires that the marker provides incremental benefit over and above that provided by clinical assessment. Remarkably few attempts have been made to investigate the incremental diagnostic value of imaging markers in the differential diagnosis of the dementias,66,67 and the section that follows should be interpreted in the light of this limitation.
Neurodegenerative diseases
Imaging is recognized as having an important role in differentiating the various causes of dementia (Table 1). Several MRI features have positive predictive value for non-AD dementias, and have been incorporated into diagnostic criteria. The National Institute of Neurological Disorders and Stroke–Internationale pour la Recherche et l'Enseignement en Neurosciences criteria for vascular dementia,68 for example, require demonstration of vascular changes on structural imaging.
Table 1.
MRI in the diagnostic criteria of non-Alzheimer dementias
| Disease | Diagnostic criteria | MRI marker | Implementation |
|---|---|---|---|
| Vascular dementia | NINDS–AIREN, Romàn et al. (1993)68 | Strategic infarct or extensive white matter changes | Mandatory |
| Frontotemporal degeneration | Neary et al. (1998)138 | Focal frontal or temporal atrophy | Supportive |
| Dementia with Lewy bodies | McKeith et al. (2005)72 | Preserved medial temporal lobes (relative to Alzheimer disease) | Supportive |
| Multiple system atrophy | Gilman et al. (2008)75 | Atrophy of putamen, middle cerebellar peduncle, pons and/or cerebellum | Additional feature |
| Creutzfeldt–Jakob disease | Collie et al. (2001);79 Tschampa et al. (2005)80 | Cortical diffusion changes; pulvinar sign | Diagnostic |
Abbreviation: NINDS–AIREN, National Institute of Neurological Disorders and Stroke–Association Internationale pour la Recherche et I'Enseignement en Neurosciences.
Consensus criteria for frontotemporal lobar degeneration (FTLD) include frontal and/or temporal atrophy as supportive features,64 and relatively good correlations have been observed between the FTLD subtype and the pattern of atrophy. Semantic dementia is associated with anterior (often asymmetrical) temporal lobe atrophy, progressive nonfluent aphasia is associated with left perisylvian loss, and behavioral variant frontotemporal dementia is associated with frontal atrophy.69–71 Focal or asymmetrical frontal or temporal atrophy reduce the likelihood of a diagnosis of AD.61,64
Consensus criteria for the clinical diagnosis of dementia with Lewy bodies (DLB) include relative preservation of medial temporal lobe structures on computed tomography or MRI,72,73 although substantial overlap between DLB and AD with regard to atrophy in this region73 detracts from the usefulness of this marker in individual cases. This overlap contributes to a blurring of the boundary between DLB and AD, but molecular imaging of the dopaminergic system can help to differentiate these two conditions.74
The most recent criteria for multiple system atrophy feature atrophy of the putamen, middle cerebellar peduncle, pons and/or cerebellum, as observed on MRI, as additional features of both the parkinsonian and cerebellar variants.75 Some studies indicate that T2-signal changes in the basal ganglia and brainstem on 1.5 T MRI, including posterior putaminal hypointensity, hyperintense lateral putaminal rim, the ‘hot cross bun’ sign,76 and middle cerebellar peduncle hyperintensities,77,78 could aid the diagnosis of this condition.
In Creutzfeldt–Jakob disease, MRI changes are almost pathognomonic, with characteristic patterns of high signal being observed in the basal ganglia on fluid-attenuated inversion recovery imaging, as well as changes in the striatum or cortical ribbon on DWI.79–81 This remarkable specificity of MRI for prion diseases is emphasized by the fact that variant CJD is associated with a very specific pattern of thalamic changes (the pulvinar sign) that even distinguishes it from sporadic CJD.82
Subcortical cerebrovascular disease
Absence of vascular changes on MRI essentially excludes a diagnosis of vascular dementia according to internationally accepted criteria.68 However, a large proportion of patients with progressive cognitive deterioration show varying degrees of small-vessel disease, which manifests on T2-weighted MRI as white matter changes and one or more lacunes.83 Most individuals with progressive cognitive deterioration probably have a mixed etiology of AD and cerebrovascular changes.83,84 Estimating the proportion of cognitive impairment that is attributable to neurodegenerative versus cerebrovascular components is difficult, but nevertheless important. The larger the contribution of cerebrovascular disease, the greater the therapeutic emphasis on addressing vascular risk factors.
Clinical and epidemiological studies have shown that despite their high prevalence and tendency to progress,85,86 white matter changes account for a small fraction of the massive cognitive impairment in patients with progressive dementia,38,87 and that neurodegeneration is a more relevant determinant of cognitive decline than are white matter changes.88 A crude but meaningful estimate is that the cross-sectional contribution of severe white matter changes is equivalent to ≈0.5 points on the Mini-Mental State Examination (MMSE) in people with cognitive impairment, and the contribution of these changes to progression of cognitive deterioration is around 12 times smaller than the contribution of neurodegenerative changes (Figure 3).87 Lacunes and other silent brain infarcts more than double the risk of dementia occurring within 5 years,89 and could decrease cognitive reserve in patients who are accumulating plaques and tangles.90
Figure 3.

Effect of severe WMLs on the progression of cognitive deterioration. The rate of global cognitive decline in elderly individuals with severe WMLs is only marginally greater than that in healthy elderly people. The rate of decline in patients with Alzheimer dementia is about 12-fold greater than that in patients with severe WMLs. The confidence areas indicated by the dotted lines denote 95% confidence limits of the slope and the limits of the interquartile range of the intercept. Abbreviation: WMLs, white matter lesions. Permission obtained from Nature Publishing Group © Frisoni, G. B. et al. Nat. Clin. Pract. Neurol. 3, 620–627 (2007).
Crucially, many studies of cerebrovascular factors in clinical populations of MCI and AD have, by design, excluded individuals with risk factors, history, or presence of indicators of cerebrovascular disease on MRI. To better understand the potential independent or synergistic contributions of neurodegenerative AD and cerebrovascular changes to cognitive impairment, studies focusing on both gray matter and white matter measures must be performed in representative populations. Such studies should include direct comparisons of, for example, hippocampal volume or three-dimensional cortical thinning—and possibly also amyloid imaging on PET—with cerebrovascular disease signal changes.
An intriguing imaging development has been the recognition of so-called microbleeds—small dot-like lesions with low signal in T2⋆ images that indicate hemosiderin deposition. Studies have indicated that the prevalence of microbleeds in AD is at least 20%,91 or possibly higher if more-sensitive MRI sequences or higher field strengths are used, and may have prognostic significance.92 The contribution of microbleeds to the patient's cognitive profile and decline is poorly understood. A correlation between microbleeds and CSF Aβ levels was recently documented,93 but the relative roles of amyloid and non-amyloid angiopathy in cognitive impairment remain a matter for debate.63
Tracking progression in clinical trials
The search for a valid marker to track disease progression should be viewed in the context of the development of drugs with potential disease-modifying effects. A valid marker of disease activity that has higher measurement precision than the currently used outcomes (cognitive and functional scales) might provide a surrogate outcome measure. For a biomarker to be accepted as a surrogate outcome in a clinical drug trial, it must both be correlated with the clinical outcome and fully capture the net effect of the intervention on the clinical efficacy outcome.94,95 Imaging outcomes could potentially allow meaningfully powered phase II and III clinical trials with significantly smaller patient groups and/or shorter follow-up times than are currently possible,96 thereby providing a boost to the efficacy of drug development programs. No widely accepted, valid surrogate outcome of disease progression currently exists, although preliminary data indicate that imaging measures could provide adequate power to clinical trials with far smaller samples of patients than are required if traditional cognitive and functional measures are used.21,24,96
The sensitivity of a marker to track disease progression depends on the steepness of the slope of change during the disease stage of interest, intrinsic measurement precision, and its statistical effect size: markers that have plateaued to maximal impairment or have not yet changed appreciably (ceiling and floor effects, respectively) are likely to be poor markers of progression (Figure 1).32 Sample sizes increase with the square of the SD of the rate of change of measurements in the relevant clinical group, so precision and reduced variance are key requirements to reduce sample sizes. For use in clinical trials, markers should be sensitive to change, but should also have high biological plausibility and be related to the core clinical or biological features of the disease. The available evidence indicates that structural markers fulfill many of these requirements and are, therefore, reasonable candidates for monitoring disease progression.9,15–19,21–25,97 In one clinical trial, a putative disease modifier reduced the rate of decline on serial MRI but provided no significant clinical benefit with regard to cognition.98 This finding is, perhaps, consistent with the suggestion that brain atrophy is a more precise indicator of disease progression than are clinical scales, but it raises questions regarding the clinical significance of small changes in imaging markers.23,96,99 For validation purposes, imaging changes suggesting a disease-modifying effect will need to predict longer-term clinical outcomes.
In mild AD (for example, MMSE score >20), hippocampal atrophy rates are 3–6% per year, compared with 0.3–2.2% per year in normal aging (Table 2). Hippocampal atrophy rates diverge from normal ≈5.5 years before the dementia threshold is crossed;100 that is, at a time when patients are at the MCI stage101 or soon before.28,102 The rate of atrophy correlates with CSF tau protein concentrations at baseline, offering a valuable indicator of disease progression.103 Different landmarks and tracing procedures have led to different hippocampal volume estimates,104 however, making drug effects difficult to compare across clinical trials. The variance and estimation error for atrophy rates depends on the interscan time interval: shorter interscan intervals (<12 months) give larger variances.105 Typically reported SDs of hippocampal atrophy rates in AD are 2.5–3.5% per year for a 1 year study, falling to 2.0–2.5% per year for an 18–24 month study.106 Many published studies used manual outlining of the hippocampus; however, semi-automated measures have been introduced in recent years.107,108 Fully automated (template-based) measures109–111 have not yet been used in large trials.
Table 2.
Rates of brain atrophy and ventricular enlargement in Alzheimer disease
| Reference | Patients with Alzheimer disease | Healthy elderly individuals | ||
|---|---|---|---|---|
| Number of individuals | Rate (% change per year)* | Number of individuals | Rate (% change per year)* | |
| Hippocampus | ||||
| Jack et al. (2003)26 | 192 | 5.5 ± 3.3 | Not done | Not done |
| Jack et al. (2004)21 | 32 slow progressors | 3.0/4.5 | 40 | 1.4/1.2 |
| 33 fast progressors | 3.6/3.2 | |||
| Fox et al. (2005)112 | 57 | 3.2 ± 3.5 | Not done | Not done |
| Kaye et al. (2005)123 | 27 mild | 2.9 ± 7.8 | 88 | 2.2 ± 6.0 |
| 17 moderate | 3.2 ± 6.8 | |||
| Schott et al. (2005)105 | 38 | 4.7 ± 2.4 | 19 | 0.9 ± 1.0 |
| Barnes et al. (2007)139 | 36 | 4.5 ± 2.9 | 19 | 0.3 ± 0.9 |
| Ridha et al. (2008)23 | 52 | 3.4 ± 3.5 | Not done | Not done |
| Henneman et al. (2009)140 | 64 | 4.0 ± 1.2 | 34 | 2.2 ± 1.4 |
| Morra et al. (2009)110 | 97 | 5.6 (4.2 to 6.0) | 148 | 0.7 (−0.3 to 1.7) |
| Whole brain | ||||
| Jack et al. (2004)21 | 32 slow progressors | 0.6/0.7 | 40 | 0.4/0.3 |
| 33 fast progressors | 1.4/1.1 | |||
| Schott et al. (2005)105 | 38 | 2.2 (−0.2 to 4.5) | 19 | 0.7 (−0.2 to 1.7) |
| Sluimer et al. (2008)141 | 65 | 1.9 ± 0.9 | 10 | 0.5 ± 0.5 |
| Henneman et al. (2009)140 | 64 | 1.9 ± 0.9 | 33 | 0.6 ± 0.6 |
| Ventricles | ||||
| Jack et al. (2003)26 | 192 | 16.1 (−13.1 to 53.5) | Not done | Not done |
| Jack et al. (2004)21 | 32 slow progressors | 4.3/3.3 | 40 | 1.7/0.9 |
| 33 fast progressors | 6.4/3.7 | |||
| Schott et al. (2005)105 | 38 | 9.4 (0.1 to 19.1) | 19 | 3.1 (−4.1 to 10.4) |
| Ridha et al. (2008)23 | 52 | 12.8 ± 9.9 | Not done | Not done |
| Nestor et al. (2008)99 | 104 | 5.7 ± 4.9‡ | 152 | 1.5 ± 4.3‡ |
Only studies with 30 or more patients are shown (for a more comprehensive table see Supplementary Table 1 online).
Figures denote mean ± SD, median/ interquartile range or mean (95% CI).
Change over 6 months.
Rates of whole-brain atrophy in AD diverge from normal ≈4 years before the dementia threshold is crossed100 and, with few exceptions, have been estimated at 1.4–2.2% per year, whereas rates of atrophy during normal aging (for a mean age of 70 years) do not usually exceed 0.7% per year (Table 2). As with hippocampal atrophy, this differential between disease-related atrophy and normal aging offers the possibility of providing evidence for a therapeutic effect. The SD of the brain atrophy rate in AD is typically ≈1% per year for a single-center study when assessed over 1 year or more.106 The seemingly surprising finding of greater whole-brain atrophy rates in the treated patients of the AN1792 vaccination trial112 can be interpreted in light of the limited prior knowledge of the structural effects of the drug in an Aβ-laden brain.113 Ongoing efforts aim to bridge this knowledge gap by developing disease markers in animal models that are homologous to the markers shown to be sensitive to disease progression in human trials.114
Ventricular enlargement is a highly reproducible measure of disease progression, owing to the high contrast between the CSF and the surrounding brain tissue on T1-weighted images. The ventricles expand by 5–16% per year in patients with AD and 1.5–3.0% per year in healthy elderly individuals (Table 2). The relatively low error variance gives this measure excellent power to detect consistent changes over short follow-up intervals (for example, 6 months),99,105 but this relative advantage over whole-brain measures dissipates if the follow-up interval is extended to 1 year or more.105 The high accuracy and feasibility of ventricular dilation measurement, even on CT,115,116 make this an excellent candidate measure for trials where MRI is not available or feasible.
Sample sizes required for brain, hippocampal and temporal lobe measures are similar. Around 100–200 individuals per treatment arm should provide 90% power to detect a 20% slowing of atrophy.24,25,105,117 By also screening out AD patients with low CSF tau or high Aβ42 levels or high hippocampal volumes, and by accounting for baseline covariates (age, baseline hippocampal volume, and apolipoprotein E genotype), the necessary sample size for a 1 year trial that uses hippocampal atrophy as an outcome measure has been estimated to be as low as 50 individuals per arm.118 Rates of whole-brain and hippocampal atrophy and ventricular enlargement have been included in several clinical trials of candidate disease modifiers in AD26,98,113,119–121 To support disease-modification claims, virtually all phase III clinical trials now include serial structural MRI scans from which rates of atrophy are computed. However, power estimates for trials and drug registration are still based on traditional clinical cognitive and functional tests, owing to the requirements of regulatory agencies and concerns over surrogate outcomes. This current situation can be partly attributed to the lack of a close relationship between markers and the fundamental features of AD neuropathology; that is, plaques and tangles (Table 3). Indeed, hippocampal atrophy, ventricular dilation and whole-brain atrophy are not specific to AD, or even to neurodegeneration, as these findings are also present to some degree in healthy aging.99,122,123 The three-dimensional pattern of gray matter loss or cortical thinning might, however, be more disease specific (Figure 4), and cortical thinning correlates cross-sectionally and prospectively with clinical symptoms.124,125
Table 3.
Available evidence of validity of disease markers by clinical aim
| Marker | Tools for measurement | Criteria | ||||||
|---|---|---|---|---|---|---|---|---|
| Specific* | Validated‡ | Precise§ | Reliable | Noninvasive | Simple to perform | Inexpensive | ||
| Diagnosing incipient Alzheimer disease | ||||||||
| Medial temporal atrophy on visual rating | Visual rating scales | No | Yes | Moderately sensitive to early disease but poorly specific | Yes | Yes | Yes | Yes |
| Hippocampal atrophy on volumetry | Manual tracing, automated tools | No | Yes | Moderately sensitive to early disease but poorly specific | Yes | Yes | Y/N | No |
| Entorhinal and parahippocampal atrophy on volumetry | Manual tracing, thickness measurement | No | No | Moderately sensitive to early disease but poorly specific | Y/N | Yes | No | No |
| Three-dimensional atrophy patterns | Support vector machines, STAND score | Yes | Yes | Yes | Y/N | Yes | Yes | Y/N |
| Tracking progression in clinical trials | ||||||||
| Hippocampal atrophy rate | Manual tracing, automated tools | No | NA | NA | Yes | Yes | Y/N | NA |
| Cortical thinning pattern | Freesurfer, cortical pattern matching, CIVET algorithm | Yes | NA | NA | Yes | Yes | Y/N | NA |
| Ventricular dilation rate | Threshold-based semi-automated measure, boundary shift integral | No | NA | NA | Yes | Yes | Yes | Yes |
| Whole-brain atrophy rate | Boundary shift integral, SIENAX software | No | NA | NA | Yes | Yes | No | NA |
Diagnosis is considered as a one-time assessment. Criteria for validity were originally developed for diagnosis142 and adapted here to track disease progression.
Able to detect a fundamental feature of Alzheimer disease neuropathology.
Validated in neuropathologically confirmed Alzheimer disease cases.
Able to detect Alzheimer disease early in its course and distinguish it from other dementias.
Abbreviations: NA, not applicable; STAND, structural abnormality index; Y/N, moderately or uncertain.
Figure 4.
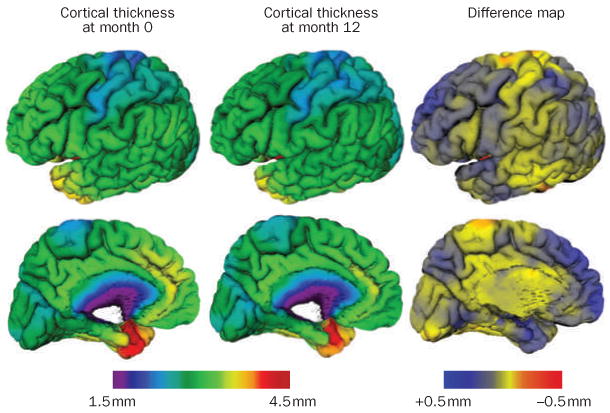
Cortical thinning in patients with mild cognitive impairment. Measurements were performed between baseline and 12 months in the left hemisphere of eight patients with mild cognitive impairment (mean age 72 years, Mini-Mental State Examination score 27.4) taken from the Alzheimer's Disease Neuroimaging Initiative data set who would develop Alzheimer dementia 12–24 months after the baseline measurement. The difference map shows thinning in the range of 0.5 mm in the medial temporal cortex and frontal, parietal and temporal neocortices, with relative sparing of the sensorimotor strip and visual cortex. The thinning maps closely with the known progression of neurofibrillary tangles and neurodegeneration at autopsy. Maps were obtained with the CIVET algorithm.143
Contrary to the assumptions of many studies performed to date, atrophy is not a linear phenomenon. In familial AD mutation carriers, whole-brain atrophy accelerates by ≈0.3% per year in the years leading up to diagnosis (for example, before the MMSE score falls below 23 out of 30).117 Whole-brain and hippocampal atrophy accelerate in sporadic AD during the transition from normality to cognitive impairment,126 and as individuals with MCI progress to AD dementia.127 Cross-sectional data indicate that the pattern of accelerated atrophy coincides with functional networks that are progressively affected by the disease.128 The acceleration of atrophy may be followed by deceleration.14,128 Mapping and modelling the dynamics of the three-dimensional pattern of atrophy over the disease course by use of nonlinear models is likely to provide an in vivo marker of the progression of neuropathology.
Conclusions and future perspectives
Structural imaging based on MRI is an integral component of the clinical assessment of patients with suspected AD. Structural MRI markers now support earlier and more-precise diagnosis and measurement of progression. The presence of atrophy of medial temporal structures is a partially validated candidate marker for early diagnosis of the disease at the MCI stage. Rates of whole-brain and hippocampal atrophy are sensitive and powerful markers of progression of neurodegeneration and, as a result, are increasingly used, along with clinical metrics, as outcomes in clinical trials of potential disease-modifying therapies. Measures of cortical thinning and automated classification approaches that assess the overall pattern of atrophy seem to show promise for the diagnosis of AD.10
The newly proposed diagnostic criteria for AD43 must be validated in multiple large data sets. Positive test results for all imaging and biochemical markers might be highly specific for AD,60,129,130 but the yield of combinations of the less invasive techniques (for example, structural MRI, 18F-fluorodeoxyglucose PET131 and PET amyloid imaging132), less costly approaches (for example, structural MRI and CSF biomarkers), or other relatively new or less validated MRI markers (for example, spectroscopy of the posterior cingulate cortex133 and diffusion changes in the temporal lobe134) will need to be evaluated empirically. Standardized operating procedures—for example, for manual hippocampal volumetry135—and automated algorithm pipelines will facilitate the comparison and integration of results across laboratories and studies, and will enable the generation of normative values. Such values are needed to achieve the ultimate goal of individual diagnosis with a single cross-sectional MRI scan by comparing it with a large number of normal scans, as has been done in other imaging modalities.136 Large multicenter studies will be needed to compare different imaging and nonimaging markers.137
The natural evolution of structural brain changes, and their relationship with nonstructural markers, should be investigated at the asymptomatic stage preceding MCI. Descriptive studies of the longitudinal changes in both structural and nonstructural markers in patients who have undergone accurate clinical assessment will help to identify the most accurate combination of markers for early diagnosis, and to estimate the time window within which the slope of change (and variance in that slope) renders the marker suitable for tracking disease progression and acting as an outcome measure in clinical trials. Validation of the many automated algorithms claiming to provide accurate marker measures will contribute to wider clinical use and, ultimately, replacement of human ratings and tracing. Defining the time course of marker change will also shed light on the contributions to cognitive impairment of genetic and/or neurodevelopmental effects, normal aging, and neurodegenerative changes. The development of homologous animal and human markers of disease progression will aid the accurate prediction of drug effects in human trials.
Structural imaging changes lie at the crossroads between the molecular pathology of AD and the clinical and cognitive decline that follow from that pathology. Structural imaging is well placed to contribute to improved early diagnosis of AD and to the search for treatments to slow or prevent this devastating disease.
Review criteria.
Articles were selected on the basis of the authors' personal knowledge and the following PubMed searches: “(MR OR MRI) AND atrophy AND Alzheimer*[ti] AND (diagnosis[ti] OR diagnostic[ti])”; “(MR OR MRI) AND atrophy AND (“frontotemporal dementia”[ti] OR “frontal lobe dementia”[ti] OR “frontotemporal lobar degeneration”[ti] OR “dementia with Lewy bodies”[ti] OR “Lewy body dementia”[ti] OR “progressive supranuclear”[ti] OR “Steel–Richardson”[ti] OR “multiple system atrophy”[ti] OR “Parkinson dementia”[ti])”; and “(MR OR MRI) AND (longitudinal OR prospective OR serial) AND atrophy AND Alzheimer*[ti]”; and “(MR OR MRI) AND (“subcortical cerebrovascular” OR (“white matter” [ti] AND (hyperintensities[ti] OR changes[ti] OR lesions[ti]))) AND cognit*[ti]”. Reference lists of the identified papers were examined for further leads. The search was limited to full-text manuscripts published in English over the past 15 years. The final selection was based on relevance, as judged by the authors.
Supplementary Material
Acknowledgments
Anna Caroli, Enrica Cavedo, Rossana Ganzola, Marco Lorenzi, Michela Pievani, Annapaola Prestia, Alberto Redolfi and Cristina Scarpazza helped in the literature review, Rossana Ganzola helped in the typesetting of the manuscript, and Alberto Redolfi produced the maps of Figure 4. G. B. Frisoni was supported by FP7 neuGRID, outGRID and IMI Pharma-Cog. N. C. Fox is supported by Medical Research Council grants G0801306 and G0601846, NIH grant U01 AG024904, Alzheimer Research Trust grant ART/RF/2007/1 and the National Institute for Health Research. C. R. Jack is supported by National Institute on Aging grant AG11378 and the Alexander Family Alzheimer's Disease Research Professorship. P. M. Thompson was supported by NIH grants EB007813, EB008281, EB008432, HD050735, AG020098, P41 RR013642 and M01 RR000865.
Footnotes
Competing interests: N. C. Fox declares associations with the following companies: Abbott Laboratories, Elan Pharmaceuticals, Eisai, Eli Lilly, GE Healthcare, IXICO, Lundbeck, Pfizer, Sanofi-Aventis, Wyeth Pharmaceuticals. See the article online for full details of the relationships. The other authors declare no competing interests.
Supplementary information: Supplementary information is linked to the online version of the paper at www.nature.com/nrneurol
Contributor Information
Giovanni B. Frisoni, IRCCS Centro San Giovanni di Dio FBF, via Pilastroni 1, 25125 Brescia, Italy
Nick C. Fox, Dementia Research Center, UCL Institute of Neurology, Box 16, Queen Square, London WC1N 3BG, UK
Clifford R. Jack, Jr, Mayo Clinic, 200 1st Street SW, Rochester, MN 55905, USA.
Philip Scheltens, Alzheimer Center and Department of Neurology, VU University Medical Center, Postbus 7057, 1007 MB Amsterdam, The Netherlands.
Paul M. Thompson, Laboratory of Neuro Imaging, Department of Neurology, 225E Neuroscience Research Building, 635 Charles Young Drive, UCLA School of Medicine, Los Angeles, CA 90095, USA
References
- 1.Braak H, Braak E. Neuropathological staging of Alzheimer-related changes. Acta Neuropathol. 1991;82:239–259. doi: 10.1007/BF00308809. [DOI] [PubMed] [Google Scholar]
- 2.Delacourte A, et al. The biochemical pathway of neurofibrillary degeneration in aging and Alzheimer's disease. Neurology. 1999;52:1158–1165. doi: 10.1212/wnl.52.6.1158. [DOI] [PubMed] [Google Scholar]
- 3.McKhann G, et al. Clinical diagnosis of Alzheimer's disease: report of the NINCDS–ADRDA Work Group under the auspices of Department of Health and Human Services Task Force on Alzheimer's Disease. Neurology. 1984;34:939–944. doi: 10.1212/wnl.34.7.939. [DOI] [PubMed] [Google Scholar]
- 4.Bosscher L, Scheltens P. In: Evidence-Based Dementia Practice. Qizilbash N, et al., editors. Blackwell; Oxford: 2002. pp. 154–162. [Google Scholar]
- 5.Frisoni GB, et al. Neuroimaging tools to rate regional atrophy, subcortical cerebrovascular disease, and regional cerebral blood flow and metabolism: consensus paper of the EADC. J Neurol Neurosurg Psychiatry. 2003;74:1371–1381. doi: 10.1136/jnnp.74.10.1371. [DOI] [PMC free article] [PubMed] [Google Scholar]
- 6.Ramani A, Jensen JH, Helpern JA. Quantitative MR imaging in Alzheimer disease. Radiology. 2006;241:26–44. doi: 10.1148/radiol.2411050628. [DOI] [PubMed] [Google Scholar]
- 7.Whitwell JL, et al. MRI correlates of neurofibrillary tangle pathology at autopsy: a voxel-based morphometry study. Neurology. 2008;71:743–749. doi: 10.1212/01.wnl.0000324924.91351.7d. [DOI] [PMC free article] [PubMed] [Google Scholar]
- 8.Vemuri P, et al. MRI and CSF biomarkers in normal, MCI, and AD subjects: predicting future clinical change. Neurology. 2009;73:294–301. doi: 10.1212/WNL.0b013e3181af79fb. [DOI] [PMC free article] [PubMed] [Google Scholar]
- 9.Thompson PM, et al. Mapping hippocampal and ventricular change in Alzheimer disease. Neuroimage. 2004;22:1754–1766. doi: 10.1016/j.neuroimage.2004.03.040. [DOI] [PubMed] [Google Scholar]
- 10.Vemuri P, et al. Antemortem MRI based structural abnormality index (STAND)-scores correlated with postmortem Braak neurofibrillary tangle stage. NeuroImage. 2008;4:559–567. doi: 10.1016/j.neuroimage.2008.05.012. [DOI] [PMC free article] [PubMed] [Google Scholar]
- 11.Thompson PM, et al. Dynamics of gray matter loss in Alzheimer's disease. J Neurosci. 2003;23:994–1005. doi: 10.1523/JNEUROSCI.23-03-00994.2003. [DOI] [PMC free article] [PubMed] [Google Scholar]
- 12.Scahill RI, Schott JM, Stevens JM, Rossor MN, Fox NC. Mapping the evolution of regional atrophy in Alzheimer's disease: unbiased analysis of fluid-registered serial MRI. Proc Natl Acad Sci USA. 2002;99:4703–4707. doi: 10.1073/pnas.052587399. [DOI] [PMC free article] [PubMed] [Google Scholar]
- 13.Frisoni GB, et al. The pilot European Alzheimer's Disease Neuroimaging Initiative of the European Alzheimer's Disease Consortium. Alzheimers Dement. 2008;4:255–264. doi: 10.1016/j.jalz.2008.04.009. [DOI] [PMC free article] [PubMed] [Google Scholar]
- 14.McDonald CR, et al. Regional rates of neocortical atrophy from normal aging to early Alzheimer disease. Neurology. 2009;73:457–465. doi: 10.1212/WNL.0b013e3181b16431. [DOI] [PMC free article] [PubMed] [Google Scholar]
- 15.Fox NC, Scahill RI, Crum WR, Rossor MN. Correlation between rates of brain atrophy and cognitive decline in AD. Neurology. 1999;52:1687–1689. doi: 10.1212/wnl.52.8.1687. [DOI] [PubMed] [Google Scholar]
- 16.Josephs KA, et al. β-amyloid burden is not associated with rates of brain atrophy. Ann Neurol. 2008;63:204–212. doi: 10.1002/ana.21223. [DOI] [PMC free article] [PubMed] [Google Scholar]
- 17.Schott JM, et al. Neuropsychological correlates of whole brain atrophy in Alzheimer's disease. Neuropsychologia. 2008;46:1732–1737. doi: 10.1016/j.neuropsychologia.2008.02.015. [DOI] [PubMed] [Google Scholar]
- 18.Sluimer JD, et al. Whole-brain atrophy rate and CSF biomarker levels in MCI and AD: a longitudinal study. Neurobiol Aging. doi: 10.1016/j.neurobiolaging.2008.06.016. [DOI] [PubMed] [Google Scholar]
- 19.Sluimer JD, et al. Whole-brain atrophy rate and cognitive decline: longitudinal MR study of memory clinic patients. Radiology. 2008;248:590–598. doi: 10.1148/radiol.2482070938. [DOI] [PubMed] [Google Scholar]
- 20.Cardenas VA, et al. Brain atrophy associated with baseline and longitudinal measures of cognition. Neurobiol Aging. doi: 10.1016/j.neurobiolaging.2009.04.011. [DOI] [PMC free article] [PubMed] [Google Scholar]
- 21.Jack CR, Jr, et al. Comparison of different MRI brain atrophy rate measures with clinical disease progression in AD. Neurology. 2004;62:591–600. doi: 10.1212/01.wnl.0000110315.26026.ef. [DOI] [PMC free article] [PubMed] [Google Scholar]
- 22.Morra JH, et al. Automated 3D mapping of hippocampal atrophy and its clinical correlates in 400 subjects with Alzheimer's disease, mild cognitive impairment, and elderly controls. Hum Brain Mapp. 2009;30:2766–2788. doi: 10.1002/hbm.20708. [DOI] [PMC free article] [PubMed] [Google Scholar]
- 23.Ridha BH, et al. Volumetric MRI and cognitive measures in Alzheimer disease: comparison of markers of progression. J Neurol. 2008;255:567–574. doi: 10.1007/s00415-008-0750-9. [DOI] [PubMed] [Google Scholar]
- 24.Hua X, et al. Optimizing power to track brain degeneration in Alzheimer's disease and mild cognitive impairment with tensor-based morphometry: an ADNI study of 515 subjects. NeuroImage. 2009;48:668–681. doi: 10.1016/j.neuroimage.2009.07.011. [DOI] [PMC free article] [PubMed] [Google Scholar]
- 25.Ho A, et al. Comparing 3 Tesla and 1.5 Tesla MRI for tracking Alzheimer's disease progression with tensor-based morphometry. Hum Brain Mapp. doi: 10.1002/hbm.20882. in press. [DOI] [PMC free article] [PubMed] [Google Scholar]
- 26.Jack CR, Jr, et al. MRI as a biomarker of disease progression in a therapeutic trial of milameline for AD. Neurology. 2003;60:253–260. doi: 10.1212/01.wnl.0000042480.86872.03. [DOI] [PMC free article] [PubMed] [Google Scholar]
- 27.Jack CR, Jr, et al. Serial PIB and MRI in normal, mild cognitive impairment and Alzheimer's disease: implications for sequence of pathological events in Alzheimer's disease. Brain. 2009;132:1355–1365. doi: 10.1093/brain/awp062. [DOI] [PMC free article] [PubMed] [Google Scholar]
- 28.Pike KE, et al. β-amyloid imaging and memory in non-demented individuals: evidence for preclinical Alzheimer's disease. Brain. 2007;130:2837–2844. doi: 10.1093/brain/awm238. [DOI] [PubMed] [Google Scholar]
- 29.Minoshima S, et al. Metabolic reduction in the posterior cingulate cortex in very early Alzheimer's disease. Ann Neurol. 1997;42:85–94. doi: 10.1002/ana.410420114. [DOI] [PubMed] [Google Scholar]
- 30.Engler H, et al. Two-year follow-up of amyloid deposition in patients with Alzheimer's disease. Brain. 2006;129:2856–2866. doi: 10.1093/brain/awl178. [DOI] [PubMed] [Google Scholar]
- 31.Ridha BH, et al. Tracking atrophy progression in familial Alzheimer's disease: a serial MRI study. Lancet Neurol. 2006;5:828–834. doi: 10.1016/S1474-4422(06)70550-6. [DOI] [PubMed] [Google Scholar]
- 32.Fox NC, et al. Imaging of onset and progression of Alzheimer's disease with voxel-compression mapping of serial magnetic resonance images. Lancet. 2001;358:201–205. doi: 10.1016/S0140-6736(01)05408-3. [DOI] [PubMed] [Google Scholar]
- 33.Jack CR, et al. Hypothetical model of dynamic biomarkers of the Alzheimer's pathological cascade. Lancet Neurol. 2010;9:119–128. doi: 10.1016/S1474-4422(09)70299-6. [DOI] [PMC free article] [PubMed] [Google Scholar]
- 34.Adalsteinsson E, Sullivan EV, Kleinhans N, Spielman DM, Pfefferbaum A. Longitudinal decline of the neuronal marker N-acetyl aspartate in Alzheimer's disease. Lancet. 2000;355:1696–1697. doi: 10.1016/s0140-6736(00)02246-7. [DOI] [PubMed] [Google Scholar]
- 35.Kantarci K, et al. DWI predicts future progression to Alzheimer's disease in amnestic mild cognitive impairment. Neurology. 2005;64:902–904. doi: 10.1212/01.WNL.0000153076.46126.E9. [DOI] [PMC free article] [PubMed] [Google Scholar]
- 36.Taoka T, et al. Diffusion anisotropy and diffusivity of white matter tracts within the temporal stem in Alzheimer disease: evaluation of the “tract of interest” by diffusion tensor tractography. AJNR Am J Neuroradiol. 2006;27:1040–1045. [PMC free article] [PubMed] [Google Scholar]
- 37.Ridha BH, et al. Magnetization transfer ratio in Alzheimer disease: comparison with volumetric measurements. Am J Neuroradiol. 2007;28:965–970. [PMC free article] [PubMed] [Google Scholar]
- 38.van der Flier WM, et al. Medial temporal lobe atrophy and white matter hyperintensities are associated with mild cognitive deficits in non-disabled elderly people: the LADIS study. J Neurol Neurosurg Psychiatry. 2005;76:1497–1500. doi: 10.1136/jnnp.2005.064998. [DOI] [PMC free article] [PubMed] [Google Scholar]
- 39.Johnson NA, et al. Pattern of cerebral hypoperfusion in Alzheimer disease and mild cognitive impairment measured with arterial spin-labeling MR imaging: initial experience. Radiology. 2005;234:851–859. doi: 10.1148/radiol.2343040197. [DOI] [PMC free article] [PubMed] [Google Scholar]
- 40.Alsop DC, Press DZ. Activation and baseline changes in functional MRI studies of Alzheimer disease. Neurology. 2007;69:1645–1646. doi: 10.1212/01.wnl.0000265395.87983.66. [DOI] [PubMed] [Google Scholar]
- 41.Buckner RL, et al. Molecular, structural, and functional characterization of Alzheimer's disease: evidence for a relationship between default activity, amyloid, and memory. J Neurosci. 2005;25:7709–7717. doi: 10.1523/JNEUROSCI.2177-05.2005. [DOI] [PMC free article] [PubMed] [Google Scholar]
- 42.Sperling RA, et al. Amyloid deposition is associated with impaired default network function in older persons without dementia. Neuron. 2009;63:178–188. doi: 10.1016/j.neuron.2009.07.003. [DOI] [PMC free article] [PubMed] [Google Scholar]
- 43.Dubois B, et al. Research criteria for the diagnosis of Alzheimer's disease: revising the NINCDS–ADRDA criteria. Lancet Neurol. 2007;6:734–746. doi: 10.1016/S1474-4422(07)70178-3. [DOI] [PubMed] [Google Scholar]
- 44.Modrego PJ. Predictors of conversion to dementia of probable Alzheimer type in patients with mild cognitive impairment. Curr Alzheimer Res. 2006;3:161–170. doi: 10.2174/156720506776383103. [DOI] [PubMed] [Google Scholar]
- 45.Scheltens P, et al. Atrophy of medial temporal lobes on MRI in “probable” Alzheimer's disease and normal ageing: diagnostic value and neuropsychological correlates. J Neurol Neurosurg Psychiatry. 1992;55:967–972. doi: 10.1136/jnnp.55.10.967. [DOI] [PMC free article] [PubMed] [Google Scholar]
- 46.Korf ES, Wahlund LO, Visser PJ, Scheltens P. Medial temporal lobe atrophy on MRI predicts dementia in patients with mild cognitive impairment. Neurology. 2004;63:94–100. doi: 10.1212/01.wnl.0000133114.92694.93. [DOI] [PubMed] [Google Scholar]
- 47.DeCarli C, et al. Alzheimer's Disease Cooperative Study Group. Qualitative estimates of medial temporal atrophy as a predictor of progression from mild cognitive impairment to dementia. Arch Neurol. 2007;64:108–115. doi: 10.1001/archneur.64.1.108. [DOI] [PubMed] [Google Scholar]
- 48.Duara R, et al. Medial temporal lobe atrophy on MRI scans and the diagnosis of Alzheimer disease. Neurology. 2008;71:1986–1992. doi: 10.1212/01.wnl.0000336925.79704.9f. [DOI] [PMC free article] [PubMed] [Google Scholar]
- 49.Burton EJ, et al. Medial temporal lobe atrophy on MRI differentiates Alzheimer's disease from dementia with Lewy bodies and vascular cognitive impairment: a prospective study with pathological verification of diagnosis. Brain. 2009;132:195–203. doi: 10.1093/brain/awn298. [DOI] [PubMed] [Google Scholar]
- 50.Bobinski M, et al. The histological validation of post mortem magnetic resonance imaging-determined hippocampal volume in Alzheimer's disease. Neuroscience. 2000;95:721–725. doi: 10.1016/s0306-4522(99)00476-5. [DOI] [PubMed] [Google Scholar]
- 51.Gosche KM, Mortimer JA, Smith CD, Markesbery WR, Snowdon DA. Hippocampal volume as an index of Alzheimer neuropathology: findings from the Nun Study. Neurology. 2002;58:1476–1482. doi: 10.1212/wnl.58.10.1476. [DOI] [PubMed] [Google Scholar]
- 52.Jack CR, Jr, et al. Antemortem MRI findings correlate with hippocampal neuropathology in typical aging and dementia. Neurology. 2002;58:750–757. doi: 10.1212/wnl.58.5.750. [DOI] [PMC free article] [PubMed] [Google Scholar]
- 53.Shi F, Liu B, Zhou Y, Yu C, Jiang T. Hippocampal volume and asymmetry in mild cognitive impairment and Alzheimer's disease: meta-analyses of MRI studies. Hippocampus. 2009;19:1055–1064. doi: 10.1002/hipo.20573. [DOI] [PubMed] [Google Scholar]
- 54.Barnes J, et al. Automatic calculation of hippocampal atrophy rates using a hippocampal template and the boundary shift integral. Neurobiol Aging. 2007;28:1657–1663. doi: 10.1016/j.neurobiolaging.2006.07.008. [DOI] [PubMed] [Google Scholar]
- 55.Yuan Y, Gu ZX, Wei WS. Fluorodeoxyglucose-positron-emission tomography, single-photon emission tomography, and structural MR imaging for prediction of rapid conversion to Alzheimer disease in patients with mild cognitive impairment: a meta-analysis. Am J Neuroradiol. 2009;30:404–410. doi: 10.3174/ajnr.A1357. [DOI] [PMC free article] [PubMed] [Google Scholar]
- 56.Visser PJ, Scheltens P, Verhey FR. Do MCI criteria in drug trials accurately identify subjects with predementia Alzheimer's disease? J Neurol Neurosurg Psychiatry. 2005;76:1348–1354. doi: 10.1136/jnnp.2004.047720. [DOI] [PMC free article] [PubMed] [Google Scholar]
- 57.Hampel H, Broich K. Enrichment of MCI and early Alzheimer's disease treatment trials using neurochemical and imaging candidate biomarkers. J Nutr Health Aging. 2009;13:373–375. doi: 10.1007/s12603-009-0048-3. [DOI] [PubMed] [Google Scholar]
- 58.van de Pol LA, et al. Hippocampal atrophy on MRI in frontotemporal lobar degeneration and Alzheimer's disease. J Neurol Neurosurg Psychiatry. 2006;77:439–442. doi: 10.1136/jnnp.2005.075341. [DOI] [PMC free article] [PubMed] [Google Scholar]
- 59.Likeman M, et al. Visual assessment of atrophy on magnetic resonance imaging in the diagnosis of pathologically confirmed young-onset dementias. Arch Neurol. 2005;62:1410–1415. doi: 10.1001/archneur.62.9.1410. [DOI] [PubMed] [Google Scholar]
- 60.Bouwman FH, et al. CSF biomarkers and medial temporal lobe atrophy predict dementia in mild cognitive impairment. Neurobiol Aging. 2007;28:1070–1074. doi: 10.1016/j.neurobiolaging.2006.05.006. [DOI] [PubMed] [Google Scholar]
- 61.Klöppel S, et al. Automatic classification of MR scans in Alzheimer's disease. Brain. 2008;131:681–689. doi: 10.1093/brain/awm319. [DOI] [PMC free article] [PubMed] [Google Scholar]
- 62.Vemuri P, et al. Alzheimer's disease diagnosis in individual subjects using structural MR images: validation studies. Neuroimage. 2008;39:1186–1197. doi: 10.1016/j.neuroimage.2007.09.073. [DOI] [PMC free article] [PubMed] [Google Scholar]
- 63.Mueller SG, Weiner MW. Selective effect of age, Apo e4, and Alzheimer's disease on hippocampal subfields. Hippocampus. 2009;19:558–564. doi: 10.1002/hipo.20614. [DOI] [PMC free article] [PubMed] [Google Scholar]
- 64.Teipel SJ, et al. Measurement of basal forebrain atrophy in Alzheimer's disease using MRI. Brain. 2005;128:2626–2644. doi: 10.1093/brain/awh589. [DOI] [PubMed] [Google Scholar]
- 65.Karas G, et al. Amnestic mild cognitive impairment: structural MR imaging findings predictive of conversion to Alzheimer disease. Am J Neuroradiol. 2008;29:944–949. doi: 10.3174/ajnr.A0949. [DOI] [PMC free article] [PubMed] [Google Scholar]
- 66.Scheltens P, Fox N, Barkhof F, De Carli C. Structural magnetic resonance imaging in the practical assessment of dementia: beyond exclusion. Lancet Neurol. 2002;1:13–21. doi: 10.1016/s1474-4422(02)00002-9. [DOI] [PubMed] [Google Scholar]
- 67.Geroldi C, et al. The added value of neuropsychologic tests and structural imaging for the etiologic diagnosis of dementia in Italian expert centers. Alzheimer Dis Assoc Disord. 2008;22:309–320. doi: 10.1097/wad.0b013e3181871a47. [DOI] [PubMed] [Google Scholar]
- 68.Román GC, et al. Vascular dementia: diagnostic criteria for research studies. Report of the NINDS–AIREN International Workshop. Neurology. 1993;43:250–260. doi: 10.1212/wnl.43.2.250. [DOI] [PubMed] [Google Scholar]
- 69.Neary D, Snowden J, Mann D. Frontotemporal dementia. Lancet Neurol. 2005;4:771–780. doi: 10.1016/S1474-4422(05)70223-4. [DOI] [PubMed] [Google Scholar]
- 70.Pereira JM, et al. Atrophy patterns in histologic vs clinical groupings of frontotemporal lobar degeneration. Neurology. 2009;72:1653–1660. doi: 10.1212/WNL.0b013e3181a55fa2. [DOI] [PMC free article] [PubMed] [Google Scholar]
- 71.Rohrer JD, et al. Patterns of cortical thinning in the language variants of frontotemporal lobar degeneration. Neurology. 2009;72:1562–1569. doi: 10.1212/WNL.0b013e3181a4124e. [DOI] [PMC free article] [PubMed] [Google Scholar]
- 72.McKeith IG, et al. Diagnosis and management of dementia with Lewy bodies: third report of the DLB Consortium. Neurology. 2005;65:1863–1872. doi: 10.1212/01.wnl.0000187889.17253.b1. [DOI] [PubMed] [Google Scholar]
- 73.Barber R, Ballard C, McKeith IG, Gholkar A, O'Brien JT. MRI volumetric study of dementia with Lewy bodies: a comparison with AD and vascular dementia. Neurology. 2000;54:1304–1309. doi: 10.1212/wnl.54.6.1304. [DOI] [PubMed] [Google Scholar]
- 74.McKeith I, et al. Sensitivity and specificity of dopamine transporter imaging with 123I-FP-CIT SPECT in dementia with Lewy bodies: a phase III, multicentre study. Lancet Neurol. 2007;6:305–313. doi: 10.1016/S1474-4422(07)70057-1. [DOI] [PubMed] [Google Scholar]
- 75.Gilman S, et al. Second consensus statement on the diagnosis of multiple system atrophy. Neurology. 2008;71:670–676. doi: 10.1212/01.wnl.0000324625.00404.15. [DOI] [PMC free article] [PubMed] [Google Scholar]
- 76.Schrag A, et al. Differentiation of atypical parkinsonian syndromes with routine MRI. Neurology. 2000;54:697–702. doi: 10.1212/wnl.54.3.697. [DOI] [PubMed] [Google Scholar]
- 77.Watanabe H, et al. Progression and prognosis in multiple system atrophy: an analysis of 230 Japanese patients. Brain. 2002;125:1070–1083. doi: 10.1093/brain/awf117. [DOI] [PubMed] [Google Scholar]
- 78.Paviour DC, Price SL, Jahanshahi M, Lees AJ, Fox NC. Regional brain volumes distinguish PSP, MSA-P, and PD: MRI-based clinico-radiological correlations. Mov Disord. 2006;21:989–996. doi: 10.1002/mds.20877. [DOI] [PubMed] [Google Scholar]
- 79.Collie DA, et al. MRI of Creutzfeldt–Jakob disease: imaging features and recommended MRI protocol. Clin Radiol. 2001;56:726–739. doi: 10.1053/crad.2001.0771. [DOI] [PubMed] [Google Scholar]
- 80.Tschampa HJ, et al. MRI in the diagnosis of sporadic Creutzfeldt–Jakob disease: a study on inter-observer agreement. Brain. 2005;128:2026–2033. doi: 10.1093/brain/awh575. [DOI] [PubMed] [Google Scholar]
- 81.Macfarlane RG, Wroe SJ, Collinge J, Yousry TA, Jäger HR. Neuroimaging findings in human prion disease. J Neurol Neurosurg Psychiatry. 2007;78:664–670. doi: 10.1136/jnnp.2006.094821. [DOI] [PMC free article] [PubMed] [Google Scholar]
- 82.Zeidler M, et al. The pulvinar sign on magnetic resonance imaging in variant Creutzfeldt–Jakob disease. Lancet. 2000;355:1412–1418. doi: 10.1016/s0140-6736(00)02140-1. [DOI] [PubMed] [Google Scholar]
- 83.DeCarli C, et al. Cerebrovascular and brain morphologic correlates of mild cognitive impairment in the National Heart, Lung, and Blood Institute Twin Study. Arch Neurol. 2001;58:643–647. doi: 10.1001/archneur.58.4.643. [DOI] [PubMed] [Google Scholar]
- 84.Black SE, Patterson C, Feightner J. Preventing dementia. Can J Neurol Sci. 2001;28:S56–S66. doi: 10.1017/s0317167100001219. [DOI] [PubMed] [Google Scholar]
- 85.de Groot JC, et al. Cerebral white matter lesions and cognitive function: the Rotterdam Scan Study. Ann Neurol. 2000;47:145–151. doi: 10.1002/1531-8249(200002)47:2<145::aid-ana3>3.3.co;2-g. [DOI] [PubMed] [Google Scholar]
- 86.Schmidt R, Petrovic K, Ropele S, Enzinger C, Fazekas F. Progression of leukoaraiosis and cognition. Stroke. 2007;38:2619–2625. doi: 10.1161/STROKEAHA.107.489112. [DOI] [PubMed] [Google Scholar]
- 87.Frisoni GB, Galluzzi S, Pantoni L, Filippi M. The effect of white matter lesions on cognition in the elderly—small but detectable. Nat Clin Pract Neurol. 2007;3:620–627. doi: 10.1038/ncpneuro0638. [DOI] [PubMed] [Google Scholar]
- 88.Schmidt R, et al. White matter lesion progression, brain atrophy, and cognitive decline: the Austrian stroke prevention study. Ann Neurol. 2005;58:610–616. doi: 10.1002/ana.20630. [DOI] [PubMed] [Google Scholar]
- 89.Vermeer SE, et al. Silent brain infarcts and the risk of dementia and cognitive decline. N Engl J Med. 2003;348:1215–1222. doi: 10.1056/NEJMoa022066. [DOI] [PubMed] [Google Scholar]
- 90.Snowdon DA, et al. Brain infarction and the clinical expression of Alzheimer disease. The Nun Study. JAMA. 1997;277:813–817. [PubMed] [Google Scholar]
- 91.Cordonnier C, et al. Prevalence and severity of microbleeds in a memory clinic setting. Neurology. 2006;66:1356–1360. doi: 10.1212/01.wnl.0000210535.20297.ae. [DOI] [PubMed] [Google Scholar]
- 92.Henneman WJ, et al. MRI biomarkers of vascular damage and atrophy predicting mortality in a memory clinic population. Stroke. 2009;40:492–498. doi: 10.1161/STROKEAHA.108.516286. [DOI] [PubMed] [Google Scholar]
- 93.Goos JD, et al. Patients with Alzheimer disease with multiple microbleeds: relation with cerebrospinal fluid biomarkers and cognition. Stroke. 2009;40:3455–3460. doi: 10.1161/STROKEAHA.109.558197. [DOI] [PubMed] [Google Scholar]
- 94.Fleming TR. Surrogate endpoints and FDA's accelerated approval process. Health Aff (Millwood) 2005;24:67–78. doi: 10.1377/hlthaff.24.1.67. [DOI] [PubMed] [Google Scholar]
- 95.Prentice RL. Surrogate endpoints in clinical trials: definition and operational criteria. Stat Med. 1989;8:431–440. doi: 10.1002/sim.4780080407. [DOI] [PubMed] [Google Scholar]
- 96.Fox NC, Cousens S, Scahill R, Harvey RJ, Rossor MN. Using serial registered brain magnetic resonance imaging to measure disease progression in Alzheimer disease: power calculations and estimates of sample size to detect treatment effects. Arch Neurol. 2000;57:339–344. doi: 10.1001/archneur.57.3.339. [DOI] [PubMed] [Google Scholar]
- 97.Evans MC, et al. Volume changes in Alzheimer's disease and mild cognitive impairment: cognitive associations. Eur Radiol. doi: 10.1007/s00330-009-1581–1585. [DOI] [PubMed] [Google Scholar]
- 98.Gauthier S, et al. Effect of tramiprosate in patients with mild-to-moderate Alzheimer's disease: exploratory analyses of the MRI subgroup of the Alphase study. J Nutr Health Aging. 2009;13:550–557. doi: 10.1007/s12603-009-0106-x. [DOI] [PubMed] [Google Scholar]
- 99.Nestor SM, et al. Ventricular enlargement as a possible measure of Alzheimer's disease progression validated using the Alzheimer's disease neuroimaging initiative database. Brain. 2008;131:2443–2454. doi: 10.1093/brain/awn146. [DOI] [PMC free article] [PubMed] [Google Scholar]
- 100.Ridha BH, et al. Tracking atrophy progression in familial Alzheimer's disease: a serial MRI study. Lancet Neurol. 2006;5:828–834. doi: 10.1016/S1474-4422(06)70550-6. [DOI] [PubMed] [Google Scholar]
- 101.Chételat G, et al. Using voxel-based morphometry to map the structural changes associated with rapid conversion in MCI: a longitudinal MRI study. Neuroimage. 2005;27:934–946. doi: 10.1016/j.neuroimage.2005.05.015. [DOI] [PubMed] [Google Scholar]
- 102.Driscoll I, et al. Longitudinal pattern of regional brain volume change differentiates normal aging from MCI. Neurology. 2009;72:1906–1913. doi: 10.1212/WNL.0b013e3181a82634. [DOI] [PMC free article] [PubMed] [Google Scholar]
- 103.Hampel H, et al. Correlation of cerebrospinal fluid levels of tau protein phosphorylated at threonine 231 with rates of hippocampal atrophy in Alzheimer disease. Arch Neurol. 2005;62:770–773. doi: 10.1001/archneur.62.5.770. [DOI] [PubMed] [Google Scholar]
- 104.Geuze E, Vermetten E, Bremner JD. MR-based in vivo hippocampal volumetrics: 1. Review of methodologies currently employed. Mol Psychiatry. 2005;10:147–159. doi: 10.1038/sj.mp.4001580. [DOI] [PubMed] [Google Scholar]
- 105.Schott JM, et al. Measuring atrophy in Alzheimer disease: a serial MRI study over 6 and 12 months. Neurology. 2005;65:119–124. doi: 10.1212/01.wnl.0000167542.89697.0f. [DOI] [PubMed] [Google Scholar]
- 106.Fox NC, Kennedy J. Structural imaging markers for therapeutic trials in Alzheimer's disease. J Nutr Health Aging. 2009;13:350–352. doi: 10.1007/s12603-009-0040-y. [DOI] [PubMed] [Google Scholar]
- 107.Schuff N, et al. MRI of hippocampal volume loss in early Alzheimer's disease in relation to ApoE genotype and biomarkers. Brain. 2009;132:1067–1077. doi: 10.1093/brain/awp007. [DOI] [PMC free article] [PubMed] [Google Scholar]
- 108.van de Pol LA, et al. Improved reliability of hippocampal atrophy rate measurement in mild cognitive impairment using fluid registration. Neuroimage. 2007;34:1036–1041. doi: 10.1016/j.neuroimage.2006.10.033. [DOI] [PubMed] [Google Scholar]
- 109.Colliot O, et al. Discrimination between Alzheimer disease, mild cognitive impairment, and normal aging by using automated segmentation of the hippocampus. Radiology. 2008;248:194–201. doi: 10.1148/radiol.2481070876. [DOI] [PubMed] [Google Scholar]
- 110.Morra JH, et al. Validation of a fully automated 3D hippocampal segmentation method using subjects with Alzheimer's disease mild cognitive impairment, and elderly controls. Neuroimage. 2008;43:59–68. doi: 10.1016/j.neuroimage.2008.07.003. [DOI] [PMC free article] [PubMed] [Google Scholar]
- 111.Khan AR, Wang L, Beg MF. FreeSurfer-initiated fully-automated subcortical brain segmentation in MRI using Large Deformation Diffeomorphic Metric Mapping. Neuroimage. 2008;41:735–746. doi: 10.1016/j.neuroimage.2008.03.024. [DOI] [PMC free article] [PubMed] [Google Scholar]
- 112.Fox NC, et al. Effects of Aβ immunization (AN1792) on MRI measures of cerebral volume in Alzheimer disease. Neurology. 2005;64:1563–1572. doi: 10.1212/01.WNL.0000159743.08996.99. [DOI] [PubMed] [Google Scholar]
- 113.Frisoni GB, Delacourte A. Neuroimaging outcomes in clinical trials in Alzheimer's disease. J Nutr Health Aging. 2009;13:209–212. doi: 10.1007/s12603-009-0060-7. [DOI] [PubMed] [Google Scholar]
- 114.Prediction of cognitive properties of new drug candidates for neurodegenerative diseases in early clinical development (PHARMA-COG) 2008 No authors listed. online http://www.centroalzheimer.org/sito/ip_pharma_cog.php.
- 115.Luxenberg JS, Haxby JV, Creasey H, Sundaram M, Rapoport SI. Rate of ventricular enlargement in dementia of the Alzheimer type correlates with rate of neuropsychological deterioration. Neurology. 1987;37:1135–1140. doi: 10.1212/wnl.37.7.1135. [DOI] [PubMed] [Google Scholar]
- 116.DeCarli C, et al. Longitudinal changes in lateral ventricular volume in patients with dementia of the Alzheimer type. Neurology. 1992;42:2029–2036. doi: 10.1212/wnl.42.10.2029. [DOI] [PubMed] [Google Scholar]
- 117.Chan D, et al. Change in rates of cerebral atrophy over time in early-onset Alzheimer's disease: longitudinal MRI study. Lancet. 2003;362:1121–1122. doi: 10.1016/S0140-6736(03)14469-8. [DOI] [PubMed] [Google Scholar]
- 118.Schuff N, et al. Hippocampal Measurements for ADNI. 2009 online http://www.adni-info.org/images/stories/SteeringCommittee2009/DataPresentations/02_weiner%20sunday%20adni%20hipp%20apri%20l%2026%202009%20final2.pdf.
- 119.Hashimoto M, et al. Does donepezil treatment slow the progression of hippocampal atrophy in patients with Alzheimer's disease? Am J Psychiatry. 2005;162:676–682. doi: 10.1176/appi.ajp.162.4.676. [DOI] [PubMed] [Google Scholar]
- 120.Krishnan KR, et al. Randomized, placebo-controlled trial of the effects of donepezil on neuronal markers and hippocampal volumes in Alzheimer's disease. Am J Psychiatry. 2003;160:2003–2011. doi: 10.1176/appi.ajp.160.11.2003. [DOI] [PubMed] [Google Scholar]
- 121.Jack CR, Jr, et al. Members of the Alzheimer's Disease Cooperative Study (ADCS). Longitudinal MRI findings from the vitamin E and donepezil treatment study for MCI. Neurobiol Aging. 2008;29:1285–1295. doi: 10.1016/j.neurobiolaging.2007.03.004. [DOI] [PMC free article] [PubMed] [Google Scholar]
- 122.Fox NC, Freeborough PA. Brain atrophy progression measured from registered serial MRI: validation and application to Alzheimer's disease. J Magn Reson Imaging. 1997;7:1069–1075. doi: 10.1002/jmri.1880070620. [DOI] [PubMed] [Google Scholar]
- 123.Kaye JA, et al. Asynchronous regional brain volume losses in presymptomatic to moderate AD. J Alzheimers Dis. 2005;8:51–56. doi: 10.3233/jad-2005-8106. [DOI] [PubMed] [Google Scholar]
- 124.Apostolova LG, et al. 3D mapping of Mini-Mental State Examination performance in clinical and pre-clinical Alzheimer's disease. Alzheimer Dis Assoc Disord. 2006;20:224–231. doi: 10.1097/01.wad.0000213857.89613.10. [DOI] [PubMed] [Google Scholar]
- 125.Apostolova LG, Thompson PM. Mapping progressive brain structural changes in early Alzheimer's disease and mild cognitive impairment. Neuropsychologia. 2008;46:1597–1612. doi: 10.1016/j.neuropsychologia.2007.10.026. [DOI] [PMC free article] [PubMed] [Google Scholar]
- 126.Fotenos AF, Snyder AZ, Girton LE, Morris JC, Buckner RL. Normative estimates of cross-sectional and longitudinal brain volume decline in aging and AD. Neurology. 2005;64:1032–1039. doi: 10.1212/01.WNL.0000154530.72969.11. [DOI] [PubMed] [Google Scholar]
- 127.Jack CR, Jr, et al. Atrophy rates accelerate in amnestic mild cognitive impairment. Neurology. 2008;70:1740–1752. doi: 10.1212/01.wnl.0000281688.77598.35. [DOI] [PMC free article] [PubMed] [Google Scholar]
- 128.Frisoni GB, Prestia A, Rasser PE, Bonetti M, Thompson PM. In vivo mapping of incremental cortical atrophy from incipient to overt Alzheimer's disease. J Neurol. 2009;256:916–924. doi: 10.1007/s00415-009-5040-7. [DOI] [PubMed] [Google Scholar]
- 129.Frisoni GB, et al. Preliminary evidence of validity of the revised criteria for Alzheimer disease diagnosis: report of 2 cases. Alzheimer Dis Assoc Disord. doi: 10.1097/WAD.0b013e3181a1fd34. [DOI] [PubMed] [Google Scholar]
- 130.Bouwman FH, et al. New research criteria for the diagnosis of Alzheimer's disease applied in a memory clinic population. Alzheimers Dement. 2008;4:327–328. doi: 10.1159/000315542. [DOI] [PubMed] [Google Scholar]
- 131.Landau SM, et al. Associations between cognitive, functional, and FDG-PET measures of decline in AD and MCI. Neurobiol Aging. doi: 10.1016/j.neurobiolaging.2009.07.002. [DOI] [PMC free article] [PubMed] [Google Scholar]
- 132.Okello A, et al. Conversion of amyloid positive and negative MCI to AD over 3 years: an 11C-PIB PET study. Neurology. 2009;73:754–760. doi: 10.1212/WNL.0b013e3181b23564. [DOI] [PMC free article] [PubMed] [Google Scholar]
- 133.Kantarci K, et al. Alzheimer disease: postmortem neuropathologic correlates of antemortem 1H MR spectroscopy metabolite measurements. Radiology. 2008;248:210–220. doi: 10.1148/radiol.2481071590. [DOI] [PMC free article] [PubMed] [Google Scholar]
- 134.Zhang Y, et al. White matter damage in frontotemporal dementia and Alzheimer's disease measured by diffusion MRI. Brain. 2009;132:2579–2592. doi: 10.1093/brain/awp071. [DOI] [PMC free article] [PubMed] [Google Scholar]
- 135.SOPs: harmonization of protocols for the manual tracing of the hippocampus development and validation of a unified standard protocol: an EADC–ADNI joint effort. 2008 No authors listed. http://www.centroalzheimer.org/sito/ip_sops_e.php.
- 136.Herholz K, et al. Discrimination between Alzheimer dementia and controls by automated analysis of multicenter FDG PET. Neuroimage. 2002;17:302–316. doi: 10.1006/nimg.2002.1208. [DOI] [PubMed] [Google Scholar]
- 137.Miller G. Alzheimer's biomarker initiative hits its stride. Longitudinal Alzhemer's studies go global. Science. 2009;326:386–389. doi: 10.1126/science.326_386. [DOI] [PubMed] [Google Scholar]
- 138.Neary D, et al. Frontotemporal lobar degeneration: a consensus on clinical diagnostic criteria. Neurology. 1998;51:1546–1554. doi: 10.1212/wnl.51.6.1546. [DOI] [PubMed] [Google Scholar]
- 139.Barnes J, et al. A meta-analysis of hippocampal atrophy rates in Alzheimer's disease. Neurobiol Aging. 2009;30:1711–1723. doi: 10.1016/j.neurobiolaging.2008.01.010. [DOI] [PMC free article] [PubMed] [Google Scholar]
- 140.Henneman WJ, et al. Hippocampal atrophy rates in Alzheimer disease: added value over whole brain volume measures. Neurology. 2009;72:999–1007. doi: 10.1212/01.wnl.0000344568.09360.31. [DOI] [PMC free article] [PubMed] [Google Scholar]
- 141.Sluimer JD, et al. Whole-brain atrophy rate in Alzheimer disease: identifying fast progressors. Neurology. 2008;70:1836–1841. doi: 10.1212/01.wnl.0000311446.61861.e3. [DOI] [PubMed] [Google Scholar]
- 142.The Ronald and Nancy Reagan Research Institute of the Alzheimer's Association and National Institute on Aging Working Group. Neurobiol Aging. Vol. 19. 1998. Consensus Report of the Working Group on: “Molecular and Biochemical Markers of Alzheimer's Disease”; pp. 109–116. [PubMed] [Google Scholar]
- 143.Lerch JP, et al. Focal decline of cortical thickness in Alzheimer's disease identified by computational neuroanatomy. Cereb Cortex. 2005;15:995–1001. doi: 10.1093/cercor/bhh200. [DOI] [PubMed] [Google Scholar]
Associated Data
This section collects any data citations, data availability statements, or supplementary materials included in this article.