

Abstract
The location and extent of brain changes that support recovery in chronic stroke is probably related to the structural integrity of the remaining cortex. However, little is known about the specifics of this relationship and how it influences treatment outcome in chronic stroke. To examine this issue, the current study examined frank brain damage and changes in cortical activation as predictors of language-treatment outcome in patients with chronic aphasia caused by stroke. Twenty-six patients received multiple MRI sessions before and after 30 h of aphasia treatment targeting anomia, an impairment in the ability to name common objects. Improved naming was associated with increased brain activation in the anterior and posterior regions of the left hemisphere, whereas damage to the posterior portion of the left middle temporal lobe and the temporal-occipital junction had a particularly negative effect on treatment outcome. Specifically, patients whose brain damage included regions commonly associated with lexical retrieval and phonological processing (e.g., Brodmann's areas 37 and 39) were less likely to show treatment-related improvement in correct naming compared with cases where the same areas were intact. These findings suggest that brain changes associated with improved naming ability in chronic aphasia rely on preservation and recruitment of eloquent cortex in the left hemisphere. In general, it seems likely that a similar relationship between cortical preservation and recruitment may also pertain to recovery from other functional impairments in chronic stroke.
Introduction
Recovery from stroke can vary substantially among patients, even in cases where the initial severity of impairment may be similar (Lazar and Antoniello, 2008; Lazar et al., 2008). Although much effort has been devoted to understanding acute-stroke recovery, relatively little is known about factors that contribute to behavioral improvement once the stroke has reached the chronic phase. One of the most salient impairments following stroke is aphasia, a language disorder caused by damage to the left hemisphere's language regions. Whereas a number of aphasic patients experience some return of language functioning in the first few days, weeks, and even months following stroke, it is thought that relatively limited recovery occurs after this initial phase (Sarno and Levita, 1979).
Although the long-term prognosis for chronic aphasia can be grim, emerging evidence suggests that behavioral language treatment can spur improvement in communication ability among chronic patients (Bhogal et al., 2003). Similar to the course of early stroke recovery, patients' responses to aphasia treatment vary widely (Kertesz and McCabe, 1977). Given that improvement in language processing somehow has to be supported by cortical brain changes, it is logical to suggest that aphasia recovery is associated with favorable brain changes whereas negative treatment outcomes reflect lack of change or, perhaps, brain changes that halt recovery.
The primary purpose of this study was to study functional brain changes associated with treatment outcome in patients with chronic aphasia using functional MRI (fMRI). A secondary exploratory analysis was performed to detect whether frank cortical damage to one or more regions has a greater effect on treatment-assisted anomia recovery compared with comparable damage to other brain regions. Twenty-six patients with left hemisphere stroke and chronic aphasia underwent fMRI twice before and twice after 2 weeks of intensive language treatment targeting anomia. During each fMRI run, patients attempted to name pictures of common objects shown on an MRI-compatible computer screen. Changes in treatment-related naming performance were correlated with changes in cortical activity and lesion location.
Materials and Methods
Patients.
Twenty-six patients (14 women) with chronic stroke and concomitant aphasia were included. The mean patient age was 59.7 (SD = 12.3). All had sustained a single event ischemic stroke to the left hemisphere at least 8 months before study inclusion. All participants underwent behavioral assessment using an extensive neuropsychological battery that included the Western Aphasia Battery (WAB) (Kertesz, 1982) and several other tests of memory, speech praxis, and semantic processing. The neuropsychological battery was administered in the weeks leading up to the actual treatment. As would be expected in a sample of stroke patients with different lesion locations and sizes, aphasia severity and type varied considerably. All participants were assigned an aphasia quotient (AQ), a measure of aphasia severity on the WAB that ranges from 0 to 100. A score of >93.6 indicates language performance within normal limits. The mean AQ for the group was 60.4 (SD = 25.6). Of the 26 patients, 11 had anomic aphasia, 10 had Broca's aphasia, three had conduction aphasia, one had Wernicke's aphasia, and one had transcortical motor aphasia. Several patients enrolled in the current study also participated in work reported by Fridriksson et al. (2009, 2010). Each participant provided informed consent for study participation as approved by the University of South Carolina internal review board.
Aphasia treatment and outcome measure.
All patients underwent aphasia treatment specifically targeting anomia, an impairment that occurs in all cases of aphasia. Originally formulated by Linebaugh and Lehner (1977) and later refined by Wambaugh and colleagues (2001, 2003), the treatment, usually referred to as a “cueing hierarchy,” is based on using verbal cues of increasing cueing strength to elicit correct naming of colored pictures shown on a computer screen. A total of 160 pictures was used and split into two comparable sets controlled for various linguistic factors such as word frequency, concreteness, length, and phonological complexity, as well as semantic typicality and category. Each set was targeted using either a semantic- or phonologic-based cueing hierarchy. The treatment was administered in a one-on-one setting by a speech-language pathologist in a quiet room.
Specifically, the treatment proceeded in the following manner: the patient was presented with pictures one at a time and instructed to name each picture. In the case of an incorrect response, the clinician would provide a verbal cue; if the picture still was not correctly named, the next levels of the cueing hierarchy were presented until successful naming resulted. The final level of the hierarchy (i.e., the strongest cue) relied on direct speech repetition of the targeted word. Following correct picture naming, the next picture in the set of 80 was presented, and the process was repeated.
With three exceptions, each patient received 3 h of treatment per weekday for 2 weeks for a total of 30 h of treatment in which 15 h were devoted to each of the two cueing hierarchies. Two patients with nonfluent aphasia and one with fluent aphasia received only 2 h of treatment per day. In regard to all other aspects of the study, these patients' participation was identical to that of the remaining patients (for a detailed report on each of the three patients, see Fridriksson et al., 2007). Half of the patients started the first week with the phonological cueing hierarchy and then switched to the semantic cueing hierarchy in the second week of treatment; the other half received the opposite order of treatment. The order of cueing hierarchies was randomized. A one-week break was taken between the 2 weeks of treatment to allow for administration of fMRI.
During fMRI scanning, patients completed a behavioral task that involved overt naming of half of the pictures targeted in treatment. Naming attempts were recorded and later scored off-line by a speech-language pathologist. Task performance during fMRI scanning was used as the outcome measure to assess changes in naming performance associated with treatment. Naming attempts were scored based on criteria established for the Philadelphia Naming Test (Roach et al., 1996). To optimize statistical power, this study focused only on anomia recovery defined as an improvement in correct naming.
Each patient completed six fMRI sessions during the study: two sessions during the week before treatment started, two sessions during the one-week treatment break, and two final sessions during the week after completion of the second week of treatment. To better appreciate intersession consistency in naming ability, a factor that can vary considerably among aphasic patients (Howard et al., 1984), the mean of the two sessions before treatment initiation, the two sessions administered between the two treatment phases, and the two sessions following the end of treatment was calculated. Assessing naming performance twice at these three different time points made it possible to estimate within-patient variability in naming performance when no treatment occurred between each of the two naming sessions. To do so, the mean of the difference between each pair of sessions at the three time points was calculated. Effectively, this mean represented the intrapatient variability in naming.
Again, the current study focused on the overall improvement in correct naming by comparing naming performance during the first two fMRI sessions before treatment started to that of the last two fMRI sessions once the 2 weeks of anomia treatment were completed. Thus, the overall change in naming pretreatment and posttreatment was divided by each patient's intrasession variability so that the effect of treatment was standardized on a case-by-case basis according to each patient's variability in naming.
To better explain this procedure, the following provides an example of how correct naming data from one patient were treated: pretreatment, session (S)1 = 24, S2 = 14; treatment phase 1, S3 = 28, S4 = 33; treatment phase 2, S5 = 47, S6 = 38. The absolute difference between each of the session pairs was as follows: S1 and S2 = 10; S3 and S4 = 5; S5 and S6 = 9. This resulted in a mean difference of 8. Accordingly, for this patient, the standardized difference in naming before and after treatment was (42.5 − 19)/8 = 2.94 (i.e., mean of S5 and S6 minus mean of S1 and S2, divided by the intrapatient variability). This procedure was followed for each of the patients' scores related to correct naming.
MRI data collection.
The day of the week as well as time of day was held constant for MRI administration for each patient. Only very minor deviations from this schedule occurred. Structural MRI was primarily administered during the first two MRI sessions once fMRI scanning was completed. All patients were scanned using a 3T Siemens Trio system equipped with a 12-element head-coil. fMRI data were collected using T2*-MRI echoplanar imaging with sparse sampling and the following parameters: 120 full brain volumes collected in 20 min; 90° flip angle; repetition time (TR) = 10 s; acquisition time (TA) = 2 s; echo time (TE) = 30 ms; in-plane resolution 3.25 × 3.25 mm; slice thickness = 3.25 mm (no gap); 32 axial slices collected in planes aligned parallel to the AC-PC line. For the purpose of lesion demarcation and coregistration of images, a three-dimensional T2-MRI sequence covering the whole head and with a resolution of 1 mm3 was used (field of view = 256 × 256 mm, 160 sagittal slices, variable degree flip angle, TR = 3200 ms, TE = 352 ms).
The same behavioral task was administered during each of the six fMRI sessions. It has been used extensively in the past with aphasic patients (Fridriksson et al., 2006, 2007, 2009, 2010). In short, the task involved overt naming of 80 pictures that were randomly selected from the two sets of pictures targeted in treatment. The pictures were projected onto a screen at the back end of the scanner bore and seen by the patients via a mirror mounted on the head-coil. Picture presentation was randomized and 40 additional abstract pictures were included to establish a baseline for the fMRI data analysis. Patients were instructed to name the object pictures but say nothing for the abstract pictures. As fMRI data collection relied on sparse sampling when a new brain volume was collected every 10 s, it was possible to present the pictures during the 8 s silent period created by using a TA of only two seconds. Thus, the majority of naming attempts occurred during this silent period. This method has an added advantage of minimizing head movement during overt speech and allows for relatively clear recording of naming responses (using a nonferrous microphone) for off-line scoring. To improve modeling of the hemodynamic response, the interstimulus interval was randomized with a mean of 6 s and a range of ± 3 s.
fMRI data analyses.
All fMRI data were analyzed using FSL (FMRIB's Software Library) version 4.1 (Smith et al., 2004). To appreciate how change in cortical activation may be associated with anomia recovery, the fMRI data were subjected to a three-level analysis. The first level was used to determine cortical modulation associated with correct naming attempts for each of the fMRI sessions administered before and after treatment. The second level contrasted the fMRI sessions before treatment with the two fMRI sessions administered upon treatment completion. Specifically, this second level analysis created a single statistical map for each patient that represented the change in cortical activation from pretreatment to posttreatment (i.e., fMRI sessions 1 and 2 contrasted with fMRI sessions 5 and 6). The third and final level included a regression analysis in which data from all participants were combined to predict treatment outcome (i.e., change in correct naming). The specifics of each analysis level are listed below.
The first-level fMRI data analysis (i.e., extracting brain activity associated with naming on session-by-session basis), including each patients' fMRI runs, used the following steps: motion correction; nonbrain removal; spatial smoothing using a Gaussian kernel with 8 mm full-width half-maximum, grand-mean intensity normalization of the entire four-dimensional dataset by a single multiplicative factor; and high-pass temporal filtering (Gaussian-weighted least-squares straight line fitting, with σ = 80.0 s). The hemodynamic response was modeled using a gamma function and a temporal derivative. A first-level statistical contrast of correctly named pictures versus viewed abstract pictures was computed using general linear modeling with local autocorrelation correction. Time points in which patients correctly named a picture were contrasted with abstract pictures (baseline), resulting in a single corresponding statistical map for each fMRI session for each patient. For the purpose of fMRI data registration in standard space, skull-stripped high-resolution T2-MRI images were first coregistered to the standard brain template [in Montreal Neurological Institute (MNI) space with 2 mm isotropic voxels] included in FSL, using lesion weighting and detailed visual inspection for accuracy (Jenkinson and Smith, 2001). Then, each patient's fMRI images were coregistered to their own T2-MRI template in standard space.
In the second-level analysis (comparing brain activation before and after treatment on patient-by-patient basis), the first two fMRI runs were contrasted with the final two fMRI runs using a two-tailed test. As this level involved within-subjects' comparisons, it used a fixed-effects model by forcing the random effects variance to zero in a local analysis of mixed effects (Beckmann et al., 2003; Woolrich et al., 2004). The results from this analysis yielded a COPE (contrast of parameter estimates, a measure of the degree of difference in activation before and after treatment) map representing change in brain activation associated with correct naming.
The third and final step involved a regression analysis in which the COPE maps created in the second-level analyses were entered to predict treatment related change in naming. The independent factor here was change in cortical activation before and after treatment and the dependent factor was standardized change in naming before and after treatment. Specifically, the final step identified brain areas in which the magnitude of activation was indicative of the change in picture naming. The third-level analysis used FLAME (FMRIB's Local Analysis of Mixed Effects), in which the group mean was included as a cofactor of no interest. Z (Gaussianised T/F) statistic images were thresholded using clusters determined by Z > 2.3 and a (corrected) cluster significance threshold of p = 0.05 (Worsley, 2001; Beckmann et al., 2003). In cases where patients provided fewer than five correct naming responses during a given fMRI run, the corresponding COPE maps were not included in the third-level analysis. This decision was based on observational evidence suggesting that <5 responses (e.g., 2–3 responses) typically do not yield statistically significant results using the default statistical threshold in FSL as a criterion in the first-level analysis.
Structural MRI analysis.
The exploratory analysis of structural damage as a predictor of anomia treatment outcome relied on Nonparametric Mapping (Rorden et al., 2007), a software package designed for lesion-symptom mapping. As above, the dependent factor was standardized change in naming; the independent factor was structural damage as demarcated on T2-MRI. The crucial question here was whether patients with common damage to specific brain region(s) tended to respond poorly to treatment compared with those patients in which the same region remained intact following stroke. Patients' lesions were drawn in native space (MRIcron) (Rorden and Brett, 2000) on T2-MRI and then warped into standard space using the same transformation matrix generated to coregister the T2-MRI in standard space with lesion masking. Then, a t test was performed on a voxel-by-voxel basis to examine the relationship between localized damage and change in correct naming when lesion size was entered as a cofactor (Bates et al., 2003). The Talairach Daemon was used to verify anatomical location of the results revealed in the functional and structural MRI analyses. Moreover, the Brodmann's area map included in MRIcron was consulted for qualitative inspection of the results.
Results
Behavioral data
All patients completed all facets of the study, including the pretreatment neuropsychological battery, six MRI sessions, and 2 weeks of anomia treatment. A comparison of the first two naming sessions (mean correct naming = 25.71, SD = 22.44) to the last two naming sessions (mean correct naming = 32.44, SD = 26.77) revealed statistically significant increase in correct naming (t(25) = 4.12, p = 0.000, two-tailed). Not surprisingly, the response to the anomia treatment varied widely among the patients (Fig. 1). Of the 10 patients who showed the greatest increase in correct naming, six had anomic aphasia and four had Broca's aphasia. Although this study did not address the difference in naming improvement following the semantic versus the phonological cueing hierarchy, it is worth noting that patients responded very similarly to each approach. In fact, a strong correlation was revealed between improvement in correct naming following the semantic and phonological cueing hierarchies (r(26) = 0.80, p = 0.000).
Figure 1.

Change in correct naming (y-axis) attempts for each patient (x-axis) reported in the order of response to treatment.
Primary outcome: fMRI results
A positive relationship was revealed between treatment-assisted increase in correct naming and modulation of cortical areas in the left posterior and anterior hemisphere (Fig. 2). That is, patients whose activation increased in the areas highlighted in Figure 2 were more likely to improve with respect to correct naming compared with those with limited change in cortical activation or, as importantly, damage to these same regions. Voxels with the highest Z scores (local maxima) are listed in Table 1. To further highlight how localized increase in left hemisphere brain activation was associated with naming improvement, the bottom of Figure 2 includes a graph that specifically illustrates this relationship. The Z scores depicted on the y-axis were extracted using Featquery, part of the FSL software package (Smith et al., 2004) that allows for post hoc analyses of fMRI data. Specifically, the mean Z score for all voxels included in the activated region was determined on a patient-by-patient basis using Featquery. A strong relationship was revealed between changes in activation in the anterior and posterior clusters listed in Table 1 (r(19) = 0.90, p = 0.0001). That is, patients who experienced a treatment-related increase in cortical regions included in the anterior cluster also showed a corresponding activation increase in the posterior cluster. Data from 19 of 26 patients were included in the fMRI analysis. fMRI data from one patient were excluded from the analysis due to excessive head motion. Data from the remaining six patients were excluded because they did not correctly name more than five items in one or more fMRI sessions (see Experimental Procedures for inclusion criteria for the fMRI data analysis).
Figure 2.
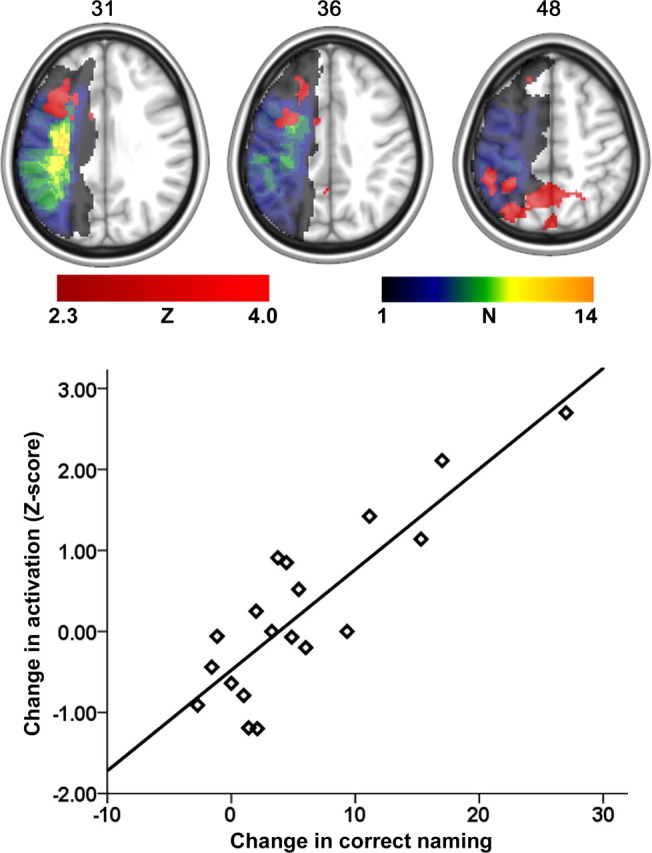
Brain areas where a greater increase in cortical activity was associated with an increase in correct naming (red color scale). The lesion overlay map for those patients who were included in the fMRI analysis is shown in the multicolor scale. The greatest lesion overlap among the 19 patients was found in the left insula (N = 14). The axial slice number in MNI space is shown to the top of each slice. The graph at the bottom shows the nature of the relationship between improved naming (x-axis) and the mean activation increase across the activated clusters shown in the axial images on top. It is important to note here that the graph was included to emphasize how the changed scores illustrated in Figure 1 related to a change in left hemisphere activation.
Table 1.
Local maxima (voxels with the highest Z score) for different activation clusters revealed in the fMRI analysis and the lesion-recovery analysis
| Anatomical brain location | Z | Coordinates in MNI space |
BA | Number with damage | Number with activation change | ||
|---|---|---|---|---|---|---|---|
| x | y | z | |||||
| Local maxima for the fMRI analysis | |||||||
| Posterior cluster (n = 1697) | |||||||
| Superior parietal lobule | 3.11 | −30 | −70 | 48 | 7 | 1 | 6 |
| Precuneus | 3.06 | −12 | −64 | 48 | 7 | 1 | 5 |
| Inferior parietal lobule | 3.01 | −48 | −40 | 48 | 40 | 4 | 5 |
| Anterior cluster (n = 954) | |||||||
| Middle frontal gyrus | 2.96 | −20 | 28 | 36 | 9 | 2 | 5 |
| Pars opercularis | 2.92 | −38 | 13 | 31 | 44 | 3 | 5 |
| Precentral gyrus | 2.87 | −32 | 4 | 36 | 6 | 7 | 4 |
| Local maximum for the lesion-recovery analysis (n = 697) | |||||||
| Posterior temporal lobe | 2.20 | −36 | −66 | 16 | 37, 39 | 9 | – |
n, Number of voxels included in each cluster; Z, value for the voxel with the highest Z score in the listed cortical area. N with damage shows the number of patients with damage at the listed MNI coordinate; N with activation change shows the number of patients who had a greater activation change than Z = 1.0 at the given anatomical location (designated by the standard coordinate).
Secondary outcome: structural MRI results
Data from all 26 patients were included in the structural MRI analysis of change in correct naming. The greatest lesion overlap for all patients was found in the left insula, where 19 patients had damage. The strongest lesion predictor (i.e., the voxel with the highest Z score) of limited improvement in correct naming was found at the junction of Brodmann's areas (BA) 37 and 39 in the posterior portion of the middle temporal lobe (Z = 2.20, uncorrected) (Table 1; Fig. 3). Utilizing statistical significance threshold of p = 0.05 (uncorrected), the lesion cluster shown in Figure 3 included portions of BA 37, BA 39, and BA 19. That is, patients with damage to these regions (N = 12) were less likely to improve correct naming compared with those whose same areas were spared (N = 14). A bar graph was included in Figure 3 to further demonstrate the relationship between naming improvement and lesion location.
Figure 3.
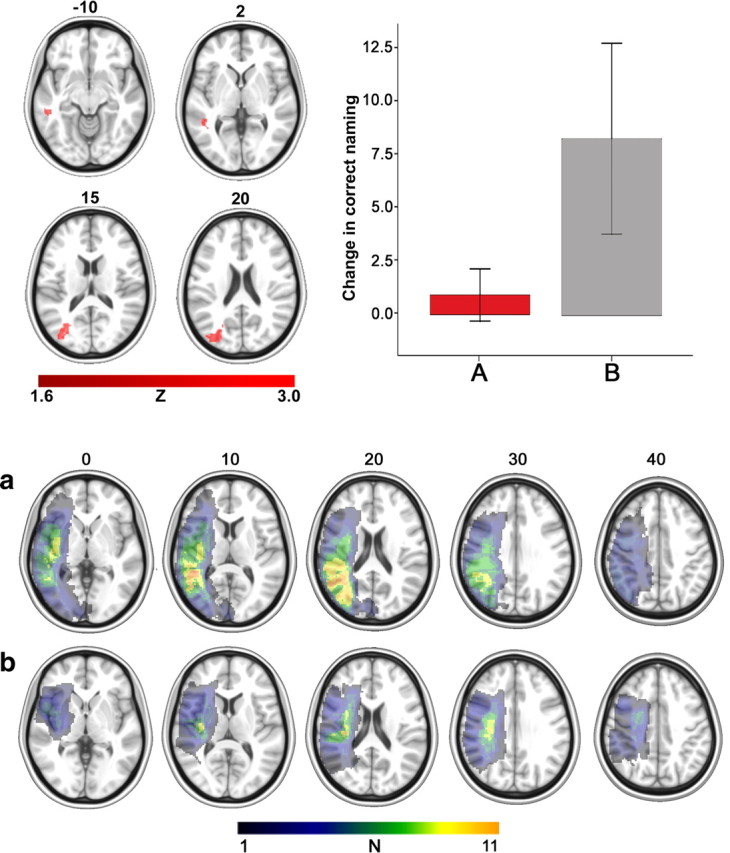
Top, left, The results from the lesion-recovery analysis showing where cortical damage (red color scale) had a particularly negative effect on improved naming. Top, right, The bar graph depicts improvement in naming for those patients whose lesion did (A, red bar) or did not (B, gray bar) at least partially include the posterior areas highlighted in the four axial images on the left. The y-axis denotes changed scores for improved naming and the error bars depict SE. The red bar on the left includes data corresponding to change in correct naming for patients (mean naming improvement = 0.93, SD = 2.13, range = −1.64–4.88) whose brain damage at least partially included the posterior lesion shown in the four axial images in the top panel. The gray bar on the right corresponds to patients (mean naming improvement = 8.33, SD = 8.4, range = −2.73–27) whose lesion did not include the same posterior region. A post hoc t test (two-tailed) revealed a significant difference in improved naming among the two groups (t(24) = 2.96, p = 0.007). Bottom, a, Lesion overlay map from the 12 patients whose lesion at least partially included the posterior areas (as shown by the red bar in the graph) (greatest lesion overlay overlap in BA 37). b, Corresponding lesion overlay maps for the 14 patients whose same area was spared (as shown by the gray bar in the graph) (greatest lesion overlap in the posterior portion of BA 48). The color scale for the lesion overlay map has an upper limit of 11, representing the greatest overlap among the patients.
Of the 14 patients whose lesion did not at least partially include BAs 19, 37, and 39, two had an improvement score that fell below the mean of the group with damage to these areas; moreover, six of the 14 had a score that fell within the scoring range of patients with lesions in these areas.
Discussion
This study examined treatment-related change in brain activation as a predictor of anomia treatment outcome in patients with aphasia. Twenty-six patients with aphasia underwent two fMRI sessions before 30 h of anomia treatment and two fMRI sessions after treatment. Treatment-related increase in correct naming was associated with increased cortical activity in the left hemisphere; specifically in the parietal lobe and the premotor cortex, including the superior portion of Broca's area. That is, patients who showed greater improvement in correct naming also experienced greater increase in left hemisphere cortical activation compared with their counterparts whose correct naming outcome was less favorable. A secondary exploratory analysis was conducted to examine the effect of localized brain damage upon treatment-assisted anomia recovery. The results suggest that damage to posterior portions of the left temporal lobe and adjacent occipital regions has a particularly negative effect upon improvement in correct naming when the effect of lesion size is factored out.
Crucially, this study relied on an fMRI data analysis that was predicated on the principle that brain regions that support anomia recovery in aphasia will show a change in cortical activation that corresponds to the magnitude of change in naming performance (i.e., correct naming). Accordingly, patients who show limited benefit from anomia treatment either have damage that involves these recovery-specific regions or, as importantly, experience limited or no functional changes in the same areas. Based on this assumption, it is possible to combine fMRI data from patients with various lesion locations and extent of damage in the same analysis. That is, no differences in activation would be expected in brain regions not modulated by the treatment and, by the same token, no signal change (beyond typical scanner noise) would be seen in the frank lesion before and after treatment. Importantly, this explains why activation was seen in areas that were damaged in some of the patients. Hence, those patients would be expected to show less improvement compared with their counterparts whose same regions were intact as well as recruited to support anomia recovery.
The present findings are certainly not the first to highlight the importance of the left hemisphere in supporting anomia recovery in aphasia. Other studies have reached similar conclusions, suggesting that cortical modulation of preserved left hemisphere areas is associated with improved naming in aphasic patients (Meinzer et al., 2007; Postman-Caucheteux et al., 2009; Fridriksson et al., 2010; van Oers et al., 2010). However, this is the first study that used parametric statistics to relate treated-anomia recovery among patients with aphasia to both cortical integrity and functional activation changes. Although the structural and functional MRI data were not included in the same analyses, the results from each suggest that patients' response to treatment relies on both structural integrity of specific brain regions (namely, portions of the temporal and occipital lobes) and recruitment of both the left frontal and parietal regions. Crucially, these findings suggest that localized damage to specific brain regions predicts aphasia-treatment outcome, at least as it relates to anomia recovery. The current fMRI data analysis revealed that the patients who showed the strongest response to treatment also tended to recruit common brain regions. This finding suggests that these regions need to survive the initial stroke and that the increase in treatment-related activation corresponds to the extent of anomia recovery. At the very least, each factor—localized brain damage and increase in brain activation—can be viewed in this context as biomarkers of response to anomia treatment. Although more data are needed to verify the current results, it seems plausible that future management of aphasia can rely on neuroimaging to guide treatment. For example, the current data suggest that patients whose brain damage includes portions of the left temporal and occipital lobes are less likely to benefit from a verbal cueing hierarchy targeting anomia.
As demonstrated in Figure 2, an overall increase in activation among the brain areas highlighted in the axial images denoted improved response to treatment. This included a wide network of brain areas, including the left frontal and parietal lobes. However, the current fMRI analysis did not deduce which of these areas is more important than others or the dynamics of change needed to support recovery. It is possible that future studies may tackle this issue by using connectivity analyses (for how this could be performed at the single case level, see Walsh et al., 2008). However, at this time, it is not so straightforward to see how data from multiple stroke patients might be incorporated in such an analysis. One way to explain the current activation results would be to relate them to neuropsychological models of normal speech processing. Inherently, such an endeavor would have to assume that aphasia recovery relies on rebuilding the damaged speech network; for example, one would expect that improved lexical retrieval relies on a change in the same neural mechanism that supported lexical retrieval before stroke onset. I am not convinced that this is the case. It seems possible that language recovery in aphasia relies on compensation, using recovery mechanisms that allow for correct completion of a language task (e.g., picture naming) while processing occurs quite differently compared with prestroke status. More generally, the meaning of changes in brain activation or structure associated with aphasia treatment remains, to say the least, unclear. Notwithstanding, there must be a systematic effort that relates neuroimaging findings in aphasia recovery; otherwise, the field will not move forward and patients will not benefit from the science. Perhaps relating neuroimaging findings in aphasia to psycholinguistic models (which have, in turn, been related to brain anatomy) will suffice. However, it seems that a model of recovery may take a very different approach by relating basic neuroscience findings to brain reorganization following damage.
Although the current data cannot identify the specific neural mechanism that mediates recovery from anomia, it is clear that improved naming relied on increased brain activation in the left hemisphere. In this regard, striking differences emerge among different studies concerning the contribution of the two hemispheres (for comprehensive discussions of this variability, see Fridriksson et al., 2010; Crinion and Leff, 2007). Yet, one issue that has received relatively little attention but very likely has a significant effect on neuroimaging results in aphasia treatment studies relates to treatment selection. Using an anomia treatment technique designed specifically to tax the right hemisphere, Crosson and colleagues (2009) found a left-to-right hemisphere shift in naming-related cortical activation upon treatment completion. Although they did not specifically target anomia, Schlaug and colleagues (2009) found increased density of the right arcuate fasciculus in aphasic patients following administration of melodic intonation therapy (Albert et al., 1973), a treatment approach designed to capitalize on the right hemisphere's role in processing melody. In contrast to these two studies, the current research only relied on linguistic cues to improve naming and, accordingly, suggests that increased reliance on the residual language network in the left hemisphere mediates improved naming in aphasia. Although Crosson et al. (2009) and Schlaug et al. (2009) used relatively few patients, their findings, as well as research along the lines of the current study, raise an intriguing possibility that integrity of the residual language network can inform treatment selection in aphasia. Namely, in cases of relatively greater preservation of the left hemisphere network, treatment should assume a language-specific focus, whereas patients with larger left hemisphere lesions may benefit more from approaches without a specific linguistic focus aimed at shifting brain activity to the right hemisphere. Clearly, this issue needs intense scrutiny before such an account can be confirmed, perhaps by using lesion–symptom mapping to examine the relation between laterality shift in activation and lesion size/location.
Whereas understanding where localized brain changes occur associated with positive aphasia-treatment outcome is important for basic science, doing so also has practical implications. In a recent study, our group examined the utility of transcranial direct current stimulation (tDCS) coupled with computerized anomia treatment to treat naming in 10 patients with chronic aphasia (Baker et al., 2010). In short, we found that tDCS of the left frontal lobe improved anomia treatment outcome when compared with placebo. The stimulation location was based on a priori evidence suggesting that improved naming in chronic stroke is associated with greater left hemisphere activation as measured by fMRI (Fridriksson et al., 2010). If, indeed, tDCS can be used to modulate brain activation and, in turn, improve aphasia treatment outcome, then it would seem crucial to identify where favorable brain modulation associated with this improvement occurs. A similar principle was demonstrated by Naeser and colleagues, who used transcranial magnetic stimulation to decrease brain activation in the right hemisphere Broca's area homolog to treat anomia (Naeser et al., 2005, 2010). This research targeted the right homologue of Broca's area based on their previous findings suggesting that overactivation in this region was associated with particularly poor speech fluency in patients with nonfluent aphasia (Naeser et al., 2004).
In summary, this study is the first, to my knowledge, to combine structural and functional MRI to predict anomia treatment outcome in a relatively large group of aphasic patients. The most salient findings were related to an increase in a common left hemisphere network to support positive treatment outcome. Although the findings from the structural analysis were not as strong as the functional data results, fortuitous preservation of specific left temporal and occipital regions tended to reflect improved naming even though a handful of patients without damage to these regions also failed to respond to treatment. These findings highlight functional brain changes and structural brain damage as biomarkers of positive anomia treatment outcome in patients with aphasia.
Footnotes
This work was supported by a grant from the National Institute on Deafness and Other Communication Disorders (DC008355). Sincere thanks to Drs. Astrid Fridriksson and Dana Moser for their role in data collection, and to Dr. Chris Rorden for comments on the manuscript.
References
- Albert ML, Sparks RW, Helm NA. Melodic intonation therapy for aphasia. Arch Neurol. 1973;29:130–131. doi: 10.1001/archneur.1973.00490260074018. [DOI] [PubMed] [Google Scholar]
- Baker J, Rorden C, Fridriksson J. Using transcranial direct-current stimulation to treat stroke patients with aphasia. Stroke. 2010;41:1229–1236. doi: 10.1161/STROKEAHA.109.576785. [DOI] [PMC free article] [PubMed] [Google Scholar]
- Bates E, Wilson SM, Saygin AP, Dick F, Sereno MI, Knight RT, Dronkers NF. Voxel-based lesion-symptom mapping. Nat Neurosci. 2003;6:448–450. doi: 10.1038/nn1050. [DOI] [PubMed] [Google Scholar]
- Beckmann CF, Jenkinson M, Smith SM. General multilevel linear modeling for group analysis in FMRI. Neuroimage. 2003;20:1052–1063. doi: 10.1016/S1053-8119(03)00435-X. [DOI] [PubMed] [Google Scholar]
- Bhogal SK, Teasell R, Speechley M, Albert M. Intensity of aphasia therapy, impact on recovery. Stroke. 2003;34:987–993. doi: 10.1161/01.STR.0000062343.64383.D0. [DOI] [PubMed] [Google Scholar]
- Crinion JT, Leff AP. Recovery and treatment of aphasia after stroke: functional imaging studies. Curr Opin Neurol. 2007;20:667–673. doi: 10.1097/WCO.0b013e3282f1c6fa. [DOI] [PubMed] [Google Scholar]
- Crosson B, Moore AB, McGregor KM, Chang YL, Benjamin M, Gopinath K, Sherod ME, Wierenga CE, Peck KK, Briggs RW, Rothi LJ, White KD. Regional changes in word-production laterality after a naming treatment designed to produce a rightward shift in frontal activity. Brain Lang. 2009;111:73–85. doi: 10.1016/j.bandl.2009.08.001. [DOI] [PMC free article] [PubMed] [Google Scholar]
- Fridriksson J, Morrow-Odom L, Moser D, Fridriksson A, Baylis G. Neural recruitment associated with anomia treatment in aphasia. Neuroimage. 2006;32:1403–1412. doi: 10.1016/j.neuroimage.2006.04.194. [DOI] [PubMed] [Google Scholar]
- Fridriksson J, Moser D, Bonilha L, Morrow-Odom K, Shaw H, Fridriksson A, Baylis G, Rorden C. Neural correlates of phonological and semantic-based anomia treatment in aphasia. Neuropsychologia. 2007;45:1812–1822. doi: 10.1016/j.neuropsychologia.2006.12.017. [DOI] [PMC free article] [PubMed] [Google Scholar]
- Fridriksson J, Baker JM, Moser D. Cortical mapping of naming errors in aphasia. Hum Brain Mapp. 2009;30:2487–2498. doi: 10.1002/hbm.20683. [DOI] [PMC free article] [PubMed] [Google Scholar]
- Fridriksson J, Bonilha L, Baker JM, Moser D, Rorden C. Activity in preserved left hemisphere regions predicts anomia severity in aphasia. Cereb Cortex. 2010;20:1013–1019. doi: 10.1093/cercor/bhp160. [DOI] [PMC free article] [PubMed] [Google Scholar]
- Howard D, Patterson K, Franklin S, Morton J, Orchard-Lisle V. Variability and consistency in picture naming by aphasic patients. Adv Neurol. 1984;42:263–276. [PubMed] [Google Scholar]
- Jenkinson M, Smith S. A global optimization method for robust affine registration of brain images. Med Image Anal. 2001;5:143–156. doi: 10.1016/s1361-8415(01)00036-6. [DOI] [PubMed] [Google Scholar]
- Kertesz A. The Western Aphasia Battery. London: Grune and Stratton; 1982. [Google Scholar]
- Kertesz A, McCabe P. Recovery patterns and prognosis in aphasia. Brain. 1977;100:1–18. doi: 10.1093/brain/100.1.1. [DOI] [PubMed] [Google Scholar]
- Lazar RM, Antoniello D. Variability in recovery from aphasia. Curr Neurol Neurosci Rep. 2008;8:497–502. doi: 10.1007/s11910-008-0079-x. [DOI] [PubMed] [Google Scholar]
- Lazar RM, Speizer AE, Festa JR, Krakauer JW, Marshall RS. Variability in language recovery after first-time stroke. J Neurol Neurosurg Psychiatry. 2008;79:530–534. doi: 10.1136/jnnp.2007.122457. [DOI] [PubMed] [Google Scholar]
- Linebaugh CW, Lehner LH. Cueing hierarchies and word retrieval: a therapy program. Clinical aphasiology: proceedings of the conference; 1977; Minneapolis: BRK Publishers; 1977. pp. 19–31. [Google Scholar]
- Meinzer M, Streiftau S, Rockstroh B. Intensive language training in the rehabilitation of chronic aphasia: efficient training by laypersons. J Int Neuropsychol Soc. 2007;13:846–853. doi: 10.1017/S1355617707071111. [DOI] [PubMed] [Google Scholar]
- Naeser MA, Martin PI, Baker EH, Hodge SM, Sczerzenie SE, Nicholas M, Palumbo CL, Goodglass H, Wingfield A, Samaraweera R, Harris G, Baird A, Renshaw P, Yurgelun-Todd D. Overt propositional speech in chronic nonfluent aphasia studied with the dynamic susceptibility contrast fMRI method. Neuroimage. 2004;22:29–41. doi: 10.1016/j.neuroimage.2003.11.016. [DOI] [PubMed] [Google Scholar]
- Naeser MA, Martin PI, Nicholas M, Baker EH, Seekins H, Kobayashi M, Theoret H, Fregni F, Maria-Tormos J, Kurland J, Doron KW, Pascual-Leone A. Improved picture naming in chronic aphasia after TMS to part of right Broca's area: an open-protocol study. Brain Lang. 2005;93:95–105. doi: 10.1016/j.bandl.2004.08.004. [DOI] [PubMed] [Google Scholar]
- Naeser MA, Martin PI, Lundgren K, Klein R, Kaplan J, Treglia E, Ho M, Nicholas M, Alonso M, Pascual-Leone A. Improved language in a chronic nonfluent aphasia patient after treatment with CPAP and TMS. Cogn Behav Neurol. 2010;23:29–38. doi: 10.1097/WNN.0b013e3181bf2d20. [DOI] [PMC free article] [PubMed] [Google Scholar]
- Postman-Caucheteux WA, Birn RM, Pursley RH, Butman JA, Solomon JM, Picchioni D, McArdle J, Braun AR. Single-trial fMRI shows contralesional activity linked to overt naming errors in chronic aphasic patients. J Cogn Neurosci. 2009;22:1299–1318. doi: 10.1162/jocn.2009.21261. [DOI] [PMC free article] [PubMed] [Google Scholar]
- Roach A, Schwartz MF, Martin N, Grewal RS, Brecher A. The Philadelphia naming test: scoring and rationale. Clin Aphasiol. 1996;24:121–134. [Google Scholar]
- Rorden C, Brett M. Stereotaxic display of brain lesions. Behav Neurol. 2000;12:191–200. doi: 10.1155/2000/421719. [DOI] [PubMed] [Google Scholar]
- Rorden C, Karnath HO, Bonilha L. Improving lesion-symptom mapping. J Cogn Neurosci. 2007;19:1081–1088. doi: 10.1162/jocn.2007.19.7.1081. [DOI] [PubMed] [Google Scholar]
- Sarno MT, Levita E. Recovery in treated aphasia in the first year post-stroke. Stroke. 1979;10:663–670. doi: 10.1161/01.str.10.6.663. [DOI] [PubMed] [Google Scholar]
- Schlaug G, Marchina S, Norton A. Evidence for plasticity in white-matter tracts of patients with chronic Broca's aphasia undergoing intense intonation-based speech therapy. Ann N Y Acad Sci. 2009;1169:385–394. doi: 10.1111/j.1749-6632.2009.04587.x. [DOI] [PMC free article] [PubMed] [Google Scholar]
- Smith SM, Jenkinson M, Woolrich MW, Beckmann CF, Behrens TE, Johansen-Berg H, Bannister PR, De Luca M, Drobnjak I, Flitney DE, Niazy RK, Saunders J, Vickers J, Zhang Y, De Stefano N, Brady JM, Matthews PM. Advances in functional and structural MR image analysis and implementation as FSL. Neuroimage. 2004;23(Suppl 1):S208–S219. doi: 10.1016/j.neuroimage.2004.07.051. [DOI] [PubMed] [Google Scholar]
- van Oers CA, Vink M, van Zandvoort MJ, van der Worp HB, de Haan EH, Kappelle LJ, Ramsey NF, Dijkhuizen RM. Contribution of the left and right inferior frontal gyrus in recovery from aphasia: a functional MRI study in stroke patients with preserved hemodynamic responsiveness. Neuroimage. 2010;49:885–893. doi: 10.1016/j.neuroimage.2009.08.057. [DOI] [PubMed] [Google Scholar]
- Walsh RR, Small SL, Chen EE, Solodkin A. Network activation during bimanual movements in humans. Neuroimage. 2008;43:540–553. doi: 10.1016/j.neuroimage.2008.07.019. [DOI] [PMC free article] [PubMed] [Google Scholar]
- Wambaugh JL. A comparison of the relative effects of phonologic and semantic cueing treatments. Aphasiology. 2003;17:433–442. [Google Scholar]
- Wambaugh JL, Linebaugh CW, Doyle PJ, Martinez AL, Kalinyak-Fliszar M, Spencer KA. Effects of two cueing treatments on lexical retrieval in aphasic speakers with different levels of deficit. Aphasiology. 2001;15:933–950. [Google Scholar]
- Woolrich MW, Behrens TE, Beckmann CF, Jenkinson M, Smith SM. Multilevel linear modelling for FMRI group analysis using Bayesian inference. Neuroimage. 2004;21:1732–1747. doi: 10.1016/j.neuroimage.2003.12.023. [DOI] [PubMed] [Google Scholar]
- Worsley KJ. Statistical analysis of activation images. In: Jezzard P, Matthews PM, Smith SM, editors. Functional MRI: an introduction to methods. Oxford: Oxford UP; 2001. pp. 251–270. [Google Scholar]