Abstract
Waldenström macroglobulinemia (WM) cells present with increased expression of microRNA-206 (miRNA-206) and reduced expression of miRNA-9*. Predicted miRNA-206– and -9*–targeted genes include histone deacetylases (HDACs) and histone acetyl transferases (HATs), indicating that these miRNAs may play a role in regulating histone acetylation. We were able to demonstrate that primary WM cells are characterized by unbalanced expression of HDACs and HATs, responsible for decreased acetylated histone-H3 and -H4, and increased HDAC activity. We next examined whether miRNA-206 and -9* modulate the aberrant expression of HDAC and HATs in WM cells leading to increased transcriptional activity. We found that restoring miRNA-9* levels induced toxicity in WM cells, supported by down-modulation of HDAC4 and HDAC5 and up-regulation of acetyl-histone-H3 and -H4. These, together with inhibited HDAC activity, led to induction of apoptosis and autophagy in WM cells. To further confirm that miRNA-9*–dependent modulation of histone acetylation is responsible for induction of WM cytotoxicity, a novel class of HDAC inhibitor (LBH589) was used; we confirmed that inhibition of HDAC activity leads to toxicity in this disease. These findings confirm that histone-modifying genes and HDAC activity are deregulated in WM cells, partially driven by the aberrant expression of miRNA-206 and -9* in the tumor clone.
Introduction
Waldenström macroglobulinemia (WM) is a B-cell low-grade lymphoma characterized by an arrest of B cells after somatic hypermutation and before isotype class switching.1,2 Characterization of the cytogenetic and genetic abnormalities in WM has led to the identification of the long-arm deletion on chromosome 6 (6q−) in approximately 35% of the patients with this disease through the use of fluorescent in situ hybridization.3 However, other cytogenetic and chromosomal abnormalities that are common in plasma cell dyscrasias, including multiple myeloma or in other low-grade B-cell malignancies, are not present in WM. Gene expression profiling in these patients has also been able to show that there are minimal genetic changes, with an expression profile similar to chronic lymphocytic leukemia myeloma.4 Therefore, multilevel characterization of this disease at the epigenetic level is necessary to better identify molecular abnormalities that lead to tumor progression and survival in this disease.
Epigenetic alterations include methylation, histone acetylation, and microRNA (miRNA) regulation.5 Histone acetylation is commonly deregulated in many cancers. The balance of nucleosomal histone acetylation leads to the transcriptional regulation of many genes: hypoacetylation is associated with a condensed chromatin structure, leading to the repression of gene transcription, and acetylation is associated with a more open chromatin structure and activation of transcription.6,7 This balance is maintained by a tight regulation of the level of histone deacetylase (HDAC) and histone acetyl transferases (HATs). In many malignancies, this balance is deregulated, with an increased expression of HDACs, leading to enhanced gene transcription.8,9 HDACs are enzymes that catalyze the removal of the acetyl modification on lysine residues of proteins, including the nucleosomal histones H2A, H2B, H3, and H4. In addition, other induced genes include the cell cycle kinase inhibitors p21WAF1, p16ink4a, p27Kip, p53, nuclear transcription factor Y subunit α, and globin transcription factor 1, leading to enhanced cellular functions such as proliferation, cell cycle, and survival.10 Results of a recent report have shown that WM cells present with a specific miRNA signature characterized by increased expression of miRNA-206 and reduced expression of miRNA-9*.11 Predicted miRNA-206– and -9*–targeted genes include HDACs and HATs, leading us to hypothesize that miRNA-206 and -9* play a role in regulating histone acetylation in WM. To date, the histone acetylation status in patients with WM has not been investigated.
In this study, we investigate the role of miRNA-206 and -9* in the regulation of histone modification in WM. We first demonstrated that primary WM cells are characterized by unbalanced expression of HDACs and HATs at the mRNA level. We found that restoring miRNA-9* levels, by transfecting WM cells with precursor miRNA-9*, resulted in induction of toxicity in WM cells, supported by down-modulation of HDAC4 and HDAC5 and up-regulation of acetyl-histone-H3 and -H4. These, together with inhibited HDAC activity, led to induction of apoptosis and autophagy in WM cells.
Methods
Cells
WM cell line (BCWM.1) and immunoglobulin M (IgM) secreting low-grade lymphoma cell lines (WM-WSU, MEC-1, and RL) were used in this study. The BCWM.1 is a recently described WM cell line that has been developed from a patient with untreated WM.12 MEC-1 was a gift from Dr Kay (Mayo Clinic). RL was purchased from the ATCC. Primary WM cells were obtained from bone marrow (BM) samples with the use of CD19+ microbead selection (Miltenyi Biotec) with greater than 90% purity, as confirmed by flow cytometric analysis with monoclonal antibody reactive to human CD20-phycoerythrin (BD-Bioscience), as described.13 Peripheral blood mononuclear cells (PBMCs) were obtained from healthy subjects by Ficoll-Hypaque density sedimentation, and subsequently CD19+ selection was performed as described earlier. All cell lines and primary cells were cultured at 37°C in RPMI-1640 containing 10% fetal bovine serum (Sigma Chemical), 2mM l-glutamine, 100 U/mL penicillin, and 100 mg/mL streptomycin (GIBCO). Approval for these studies was obtained from the Dana-Farber Cancer Institute Institutional Review Board. Informed consent was obtained from all patients and healthy volunteers in accordance with the Declaration of Helsinki protocol.
Reagents
LBH589 was provided by Novartis Pharmaceuticals. The maximum final concentration of dimethyl sulfoxide (< 0.1%) did not affect cell proliferation and did not induce cytotoxicity on all the cell lines and primary cells tested (data not shown).
HDAC activity assay
HDAC activity was determined with the use of Colorimetric HDAC Activity Assay Kit (BioVision), as described.14
Gene expression profiling
Total RNA has been isolated from primary CD19+ cells isolated from BM of patients with WM and from PBMCs of healthy donors, using the RNeasy kit (QIAGEN), as described by the manufacturer. Purified cRNA (15 μg) was hybridized to HG-U133Plus2.0 GeneChip (Affimetrix). RNA integrity was verified with the Agilent 2100 Bioanalyzer.15
microRNA expression profiling
RNA was isolated with the use of an RNeasy kit (QIAGEN), as reported in previous miRNA studies.16–18 The expression of 318 miRNAs was investigated with the use of liquid-phase Luminex microbead miRNA profiling (Luminex), as described.19 Briefly, 500 ng of total RNA was labeled with biotin with the use of the FlexmiR MicroRNA labeling kit (Luminex), which labeled all RNA molecules, including small RNA, by first using calf intestinal phosphatase for removal of 5′-phosphatases from the terminal end of the miRNAs. In the second step, a biotin label was then attached enzymatically to the 3′-end of the miRNAs in the total RNA sample. After an enzyme inactivation step, the sample was hybridized with beads containing 1 of 100 different fluorophores and coated with oligonucleotides complementary to each known miRNA. Addition of streptavidin-phycoerythrin (Molecular Probes) then yielded fluorescence with wavelengths and amplitudes characteristic of the identity and quantity of miRNAs, respectively. Normalization of arrays and calculation of median fluorescence intensity was performed according to the manufacturer's instructions.
Quantitative reverse transcription polymerase chain reaction
Stem-loop quantitative reverse transcription polymerase chain reaction (qRT-PCR) for mature miRNAs (TaqMan microRNA Assays; Applied Biosystems) was performed as described20 on an Applied Biosystems AB7500 Real Time PCR system. All PCR reactions were run in triplicate, and miRNA expression, relative to RNU6B, was calculated with the use of the 2−ΔΔCt method.21
miRNA transfection
BCWM.1, MEC.1, and RL cell lines were transfected with either pre-miRNA-9* (Ambion), anti–miRNA-206 (Exiqon), or scramble probe at a final concentration of 40nM, using Lipofectamine 2000 following the manufacturer's instructions (Invitrogen), as described.11 Culture medium was changed after transfection and replaced with RPMI 10% fetal bovine serum. Cells were then used for functional assays at different time points (24 hours, 48 hours, and 72 hours). Both untransfected and scramble probe–transfected BCWM.1, MEC.1, and RL cell lines were used as controls. Efficiency of transfection was validated by qRT-PCR and microRNA assay.
Growth inhibition assay
The inhibitory effect of LBH589 on WM cell growth was assessed by measuring 3-(4,5-dimethylthiazol-2-yl)-5-(3-carboxymethoxyphenyl)-2-(4-sulphophenyl)-2H-tetrazolium, inner salt (MTS; Promega) dye absorbance of cells, as described.13
DNA synthesis and cytotoxicity assay
DNA synthesis was measured by [3H]-thymidine ([3H]-TdR; PerkinElmer) uptake, as previously described.13 All experiments were performed in triplicate. Cytotoxicity was measured by 3-(4,5-dimethylthiazol-2-yl)-2,5-diphenyltetrazolium bromide (MTT; Chemicon International) dye absorbance, as previously described.13
Effect on paracrine WM cells growth in the BM
To evaluate the role of miRNA-9* and HDAC inhibition in regulating growth in WM cells in the context of primary BM stromal cells (BMSCs), untransfected, scramble probe–, and pre-miRNA-9*–transfected BCWM.1 cells were cultured in the presence or absence of BMSCs for 48 hours. DNA synthesis was measured as previously described.13 Similarly, BCWM.1 cells were cultured in BMSC-coated 96-well plates for 48 hours in the presence or absence of LBH589. DNA synthesis was measured as previously described.13
Flow cytometric analysis
Cell cycle analysis was profiled by flow cytometry with the use of propidium iodide staining (5 μg/mL; Sigma Chemical) after 24 hours of culture with LBH589. Apoptosis was quantitated with the use of Apo2.7 flow cytometric analysis (Beckman Coulter Inc), as described.13
Immunoblotting
BCWM.1, RL, and MEC-1 cells were harvested and lysed with lysis buffer (Cell Signaling Technology) reconstituted with 5mM NaF, 2mM Na3VO4, 1mM polymethilsulfonyl fluoride, 5 μg/mL leupeptin, and 5 μg/mL aprotinin. Whole-cell lysates (50 μg/lane) were subjected to sodium dodecyl sulfate–polyacrylamide gel electrophoresis and transferred to polyvinyldine fluoride membrane (Bio-Rad Laboratories). The antibodies used for immunoblotting included anti–acetyl-tubulin (clone 6-11B-1; Sigma); -HDAC4, -HDAC5, –acetylated histone H3, -acetylated histone H4, –acetylated lysine, –α-tubulin (Santa Cruz Biotechnology); -LC3B, -Rab7, -CDK2, -CDK4, -p21waf1, -p27kip1, -p53, –Bcl-Xl, –Mcl-1, –caspase-3, –caspase-8, –caspase-9, –PARP [poly (adenosine diphosphate-ribose) polymerase], –p-inhibitory subunit of nuclear factor-κB; Cell Signaling Technology); -Myst3 (Novus Biologicals). Nuclear extracts of the cells were prepared with the use of the Nuclear extraction kit (Panomics Inc) and subjected to immunoblotting with anti-HDAC4, -HDAC5, Myst3, (Cell Signaling Technology) and anti-nucleolin (Santa Cruz Biotechnology).
Immunofluorescence
Immunocytochemical method was performed using a Nikon Eclipse E800 epifluorescence microscope and a Nikon Photometrics Coolsnap CF color camera as previously described.11 Images were taken with an N PLAN 60×/1.25 oil objective lens using a SPOT Insight QE model camera with SPOT Advanced acquisition software (Diagnostic Instruments).
Statistical analysis
Statistical significance of differences in drug-treated versus control cultures was determined with the Student t test. The minimal level of significance was P less than .05. Gene expression profiling–supervised clustering analysis has been performed with the use of the dChip software (www.dchip.org; P < .05). miRNA expression data were analyzed according to the manufacturer's instructions (Luminex). The expression patterns of unfiltered data were performed with the use of unsupervised hierarchical clustering of samples based on centroid linkage and 1-correlation distance metric, using dChip software (www.dchip.org). To further define those miRNAs differentially expressed between groups (patients versus healthy), the data were filtered on significance of differences with the use of analysis of variance (ANOVA) test (P < .01). To identify specific predicted miRNA-targeted mRNAs, TargetScan, PicTar, and miRanda algorithms were used.22,23 To reduce the numbers of false positives, only putative target genes predicted by the 3 algorithms were considered.
Results
Increased expression of miRNA-206 and decreased expression of miRNA-9* modulate histone acetylation in patients with WM
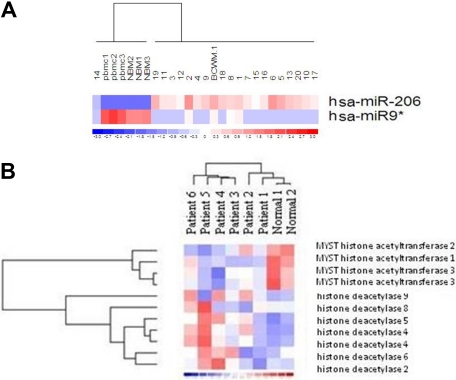
We have previously demonstrated that BM-derived WM CD19+-selected cells present with a specific miRNA signature that differentiates tumor cells from their normal cellular counterpart.11 Among the deregulated miRNAs, miRNA-206 and -9* are, respectively, increased and decreased compared with normal cells (Figure 1A; P < .01). We next analyzed the predicted gene targets for miRNA-206 and -9*, using miRanda, TargetScan, and PicTar, algorithms commonly used to predict human miRNA gene targets22,23 and specifically identified genes predicted by all 3 methods. Predicted targets for the increased miRNA-206 and decreased miRNA-9* included HATs and HDACs, respectively, leading us to hypothesize that miRNA-206 and -9* play a role in modulating the histone-acetylation status in primary WM cells. To determine whether an imbalance of HDAC/HAT activity occurs in WM, we first examined HDAC and HAT expression at the mRNA level in primary CD19+ cells isolated from patients with WM compared with their cellular counterpart. We found that primary WM cells were characterized by significant increased expression of HDAC-2, -4, -5, -6, -8, and -9 and by significant decreased expression of HAT-1, -2, and -3 (Figure 1B).
Figure 1.
Primary WM cells present with higher level of miRNA-206, lower level of miRNA-9*, together with increased expression of HDACs and reduced expression of HATs, compared with healthy donors. (A) miRNA analysis has been performed on total RNA isolated from BM CD19+ WM cells, normal bone marrow (NBM)– and PBMC-derived CD19+ counterparts, and WM cell line (BCWM.1). Heatmap was generated after supervised hierarchical clustering analysis was performed with analysis of variance test. Differential expression of miRNA patterns is shown by the intensity of red (up-regulation) versus blue (down-regulation). (B) Purified cRNA (15 μg) isolated from primary CD19+ cells isolated from BM of 6 patients with WM and from CD19+ cells isolated from PBMCs of 2 healthy donors was hybridized to HG-U133Plus2.0 GeneChip (Affimetrix). Fold change is shown by the intensity of induction (red) or suppression (blue).
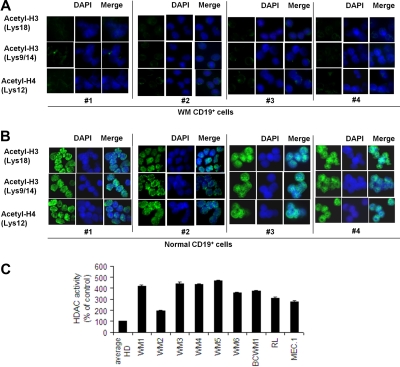
We next examined how this imbalance could affect acetylated-histone status and HDAC activity level. Therefore, acetylated histone-H3 and -H4, as well as HDAC, activity have been evaluated in BM-derived CD19+ WM cells compared with their normal counterpart. HDAC activity in WM and other IgM-secreting low-grade lymphoma cell lines was also investigated. We found a lower level of acetylated histone H3 and H4 in primary CD19+ WM cells compared with control (Figure 2A-B). Conversely, the level of HDAC activity was significantly higher in all WM patient samples and cell lines compared with the average of 3 healthy controls, indicating that indeed HDAC activity is elevated in WM cells (Figure 2C).
Figure 2.
Lower expression of acetylated histone-3/histone-4 and higher HDAC activity characterize primary WM cells compared with healthy donors. Immunocytochemical analysis of primary CD19+ cells isolated from BM of 4 patients with WM (A) and CD19+ cells isolated from PBMCs of 4 healthy donors (B) was performed with the use of anti–acetyl-histone-H3 (Lys18), -H3 (lys9/14), and -H4 (lys12) antibodies. DAPI (4′-6′-diamidine-2-phenylindole) was used to stain nuclei. (C) HDAC activity was assessed with nuclear extracts with the use of a Colorimetric HDAC Activity Assay Kit on primary CD19+ cells isolated from BM of 6 patients with WM (WM1, WM2, WM3, WM4, WM5, WM6); primary CD19+ cells were isolated from PBMCs of 3 healthy donors (average HD), and BCWM.1 and low-grade lymphomas IgM-secreting cell lines (all P ≤ .05).
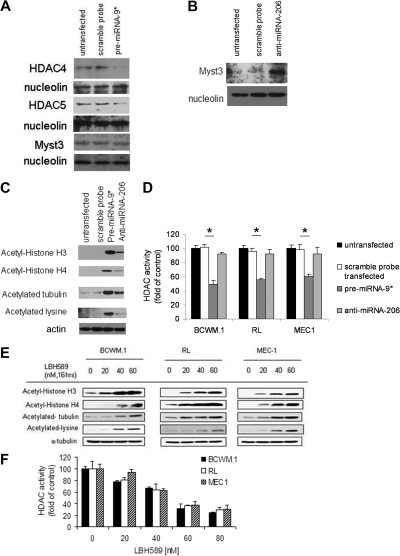
To further define the role of miRNA-206 and -9* in targeting histone-acetylation in WM cells as well as in other IgM-secreting low-grade lymphoma cell lines, acetylated-histone expression and HDAC activity were examined in miRNA-206 knockdown and miRNA-9* precursor (pre-miRNA-9*)–transfected cells, compared with controls (control probe–transfected and untransfected cells). Efficiency of transfection was evaluated by qRT-PCR at 48 hours after transfection (supplemental Figure 1A-C, available on the Blood Web site; see the Supplemental Materials link at the top of the online article). We first investigated whether predicted HDAC4/HDAC5 and HAT (Myst3) mRNAs were targeted at the protein level by miRNA-9* and miRNA-206, respectively. We first demonstrated that miRNA-9* induces down-modulation of HDAC4 and HDAC5 without affecting Myst3 protein expression, as shown by Western blot in pre-miRNA-9*–transfected cells (Figure 3A), compared with either untransfected or scramble probe–transfected cells, used as controls. We also validated that miRNA-206 targets HAT (Myst3), as shown by up-regulation of Myst3 protein level in anti–miRNA-206–transfected cells compared with controls (Figure 3B). pre-miRNA-9*– and anti–mIRNA-206–dependent modulation of the relative targets was also confirmed at the mRNA level (supplemental Figure 1D). We also confirmed that acetyl histone-H3 and -H4 were up-regulated in pre-miRNA-9*– and anti–miRNA-206–transfected cells, with a higher acetyl histone-H3 and -H4 up-regulation on miRNA-9* modulation (Figure 3C). We next investigated whether miRNA-9*– and -206–dependent regulation of acetyl histone-H3 and -H4 depends on changes in HDAC activity in cell lines and found that HDAC activity was down-regulated in pre-miRNA-9*–transfected cells compared with either untransfected or scramble probe–transfected cells (Figure 3D). HDAC activity was not modified in anti–miRNA-206–transfected cells compared with controls (Figure 3D). Further validation of HDAC inhibition inducing up-regulation of acetyl histone-H3 and -H4 in WM, as well in other IgM-secreting low-grade lymphoma cell lines, was shown by Western blot in cells treated with the pan-HDAC inhibitor LBH589 in a dose-dependent manner (Figure 3E). Similarly, modulation of HDAC activity was observed in WM and other IgM-secreting low-grade lymphoma cell lines onLBH-589 treatment in a dose-dependent manner (Figure 3F).
Figure 3.
miRNA-9* and miRNA-206 target HDAC4/HDAC5 and Myst3, respectively. (A) BCWM.1 cells (scramble probe–, pre-miRNA-9*–transfected, and untransfected) were harvested at 12 hours after transfection. Nuclear lysates were subjected to Western blot with the use of anti-HDAC4, -HDAC5, -Myst3, and -nucleolin antibodies. (B) BCWM.1 cells (scramble probe–, anti–miRNA-206–transfected, and untransfected) were harvested at 12 hours after transfection. Nuclear lysates were subjected to Western blot with the use of anti-Myst3 and -nucleolin antibodies. (C) BCWM.1 cells (scramble probe–, pre-miRNA-9*–, anti–miRNA-206–transfected, and untransfected) were harvested at 12 hours after transfection. Whole-cell lysates were subjected to Western blotting with the use of anti–acetyl-histone H3, –acetyl-histone H4, –acetylated-tubulin, –acetylated-lysine, and -actin antibodies. (D) BCWM.1 cells (scramble probe–, pre-miRNA-9*–, anti–miRNA-206–transfected, and untransfected) were harvested at 12 hours after transfection. HDAC activity was assessed in vitro with the use of nuclear extracts by Colorimetric HDAC Activity Assay Kit (*P < .05). (E) BCWM.1, RL, and MEC-1 cells were cultured with LBH589 (20-60nM) for 16 hours or with control medium. Whole-cell lysates were subjected to Western blotting with the use of anti–acetyl-histone H3, –acetyl-histone H4, –acetylated-tubulin, –acetylated-lysine, and –α-tubulin antibodies. (F) BCWM.1 cells were cultured in the presence or absence of LBH589 (0-80nM; 8 hours). HDAC activity was assessed in vitro with the use of nuclear extracts by Colorimetric HDAC Activity Assay Kit (all P ≤ .05).
miRNA-9*–dependent regulation of proliferation and survival in WM cells
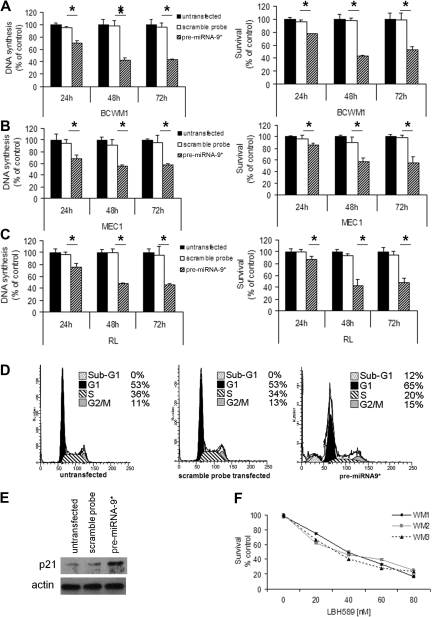
On the basis of the ability of miRNA-9* to modulate HDAC activity in WM cells, we next sought to determine the effect of miRNA-9* in regulating cell proliferation and survival. We showed that DNA synthesis was significantly reduced in pre-miRNA-9*–transfected cells compared with control at both 48 and 72 hours (P < .05; Figure 4A). In addition, induction of toxicity was observed in pre-miRNA-9*–transfected BCWM.1 cells compared with controls (P < .05; Figure 4A). Similar results were confirmed in other IgM-secreting low-grade lymphoma cell lines, MEC.1 (Figure 4B) and RL (Figure 4C). In contrast, DNA synthesis and toxicity were not shown in anti–miRNA-206–transfected cells (supplemental Figure 2A-C). To better define whether miRNA-9*–induced cytotoxicity is functionally related to HDAC inhibition, BCWM.1 cells were cultured in the presence or absence of LBH589 50nM for 8 hours, washed, subsequently transfected with the pre-miRNA-9* probe, and harvested after 48 hours. Untransfected untreated cells were used as control. We observed that pre-miRNA-9*–transfected cells did not present with significant increased toxicity compared with LBH589-pretreated cells, suggesting that miRNA-9*–dependent induction of cell death is related to HDAC inhibition (supplemental Figure 2D). We next evaluated cell cycle profiling in pre-miRNA-9*–transfected cells: increased number of cells in G1 phase was observed on pre-miRNA-9* transfection (65% vs 53%), together with a decreased number of cells in S phase (20% vs 34%). It has been previously shown that HDAC4 promotes the repression of cyclin-dependent kinase inhibitor p21.24 We demonstrated that p21 expression was up-regulated in pre-miRNA-9*–transfected cells compared with either untransfected or scramble probe–transfected cells (Figure 4E). Because p21 does not represent a miRNA-9*–predicted mRNA, this could possibly be driven by miRNA-9*–dependent HDAC4 modulation in WM cells. To further validate the role of HDAC inhibition in reducing WM cell proliferation, the effect of the HDAC inhibitor LBH589 was next tested in primary WM cells. LBH589 induced cytotoxicity in primary CD19+ cells isolated from the BM of 3 patients with WM (concentration that inhibits 50% [IC50], 30-40nM; Figure 4F). In contrast, LBH589 had no cytotoxic effect on CD19+ cells isolated from normal PBMCs (supplemental Figure 3A). Induction of cytotoxicity was also observed in WM and other IgM-secreting low-grade lymphoma cell lines exposed to increasing concentrations of LBH589. LBH589 inhibited BCWM.1 proliferation, as measured by MTS assay, with an IC50 between 20 and 40nM. LBH589 showed similar activity on all cell lines tested, with an IC50 between 20 and 40nM at 48 hours (supplemental Figure 3B-3C). We next confirmed that cell cycle progression was modulated on HDAC inhibitor treatment. LBH589 induced sub-G1 arrest (1.5%, 5.9%, 13.2%, and 27.7% at LBH589 0nM, 20nM, 40nM, and 60nM, respectively) with an associated decrease in the percentage of cells in proliferative phases S-G2/M (36.5%, 24.1%, 20.7%, and 12.4% at LBH589 0nM, 20nM, 40nM, and 60nM, respectively; supplemental Figure 3D). To determine the mechanism of LBH589-induced cell cycle arrest, we investigated the effect of LBH589 on BCWM.1 cells with the use of immunoblotting. BCWM.1 cells were treated with LBH589 (0-60nM) for 16 hours. LBH589 induced the up-regulation of cyclin kinase inhibitor proteins p21Cip1 and p27kip1, as well as the down-regulation of cyclin D2, and cyclin-dependent kinase (cdk2, cdk4) protein levels (supplemental Figure 3E).
Figure 4.
miRNA-9* regulates proliferation and survival in WM cells as well as in low-grade lymphoma IgM-secreting cells. (A) WM cells (A: BCWM.1), low-grade lymphoma IgM-secreting cell lines (B: MEC1; C: RL; scramble probe–, precursor (pre)–miRNA-9*–transfected, and untransfected) were harvested at 24, 48, and 72 hours after transfection; DNA synthesis and cytotoxicity were assessed by thymidine uptake and 3-(4,5-dimethylthiazol-2-yl)-2,5-diphenyltetrazolium bromide (MTT) assays, respectively (*P < .05). (D) Cell cycle analysis was performed by propidium iodide staining with BCWM.1 cells (untransfected, scramble probe–, and pre-miRNA-9*–transfected). (E) BCWM.1 cells (untransfected, scramble probe–, and pre-miRNA-9*–transfected) were harvested at 12 hours after transfection. Whole-cell lysates were subjected to Western blotting with anti-p21 and -actin antibodies. (F) Freshly isolated normal CD19+ cells from normal PBMCs were cultured with LBH589 (0-80nM) for 48 hours. Cytotoxicity was assessed by MTS assay.
Mechanisms of miRNA-9*–dependent toxicity in WM cells
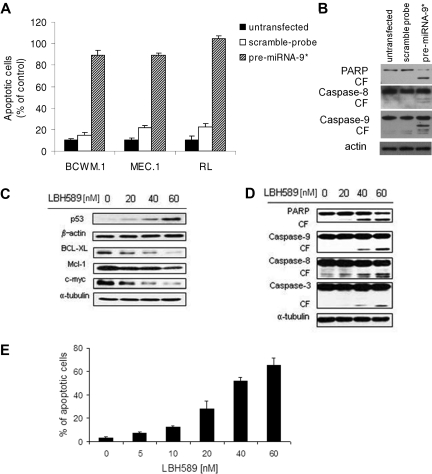
Cell cycle profiling was also able to show an up-regulation of sub-G1 phase in pre-miRNA-9*–transfected cells compared with controls (Figure 4D), indicating the presence of apoptotic cells; indeed, induction of apoptosis was observed in pre-miRNA-9*–transfected cells, as shown by Apo2.7 staining and flow cytometric analysis (Figure 5A). miRNA-9*–dependent modulation of apoptosis in WM cells was supported by PARP, caspase-8, and caspse-9 cleavage as shown by Western blot in pre-miRNA-9*–transfected cells compared with either untransfected or scramble probe–transfected cells (Figure 5B).
Figure 5.
miRNA-9*–dependent HDAC inhibition exerts a proapoptotic effect on WM cells. (A) Percentage of cells undergoing apoptosis was studied by Apo2.7 staining and flow cytometry in WM and low-grade lymphoma IgM-secreting cell lines (untransfected, scramble probe–, pre-miRNA-9*–transfected were harvested 48 hours after transfection). All P ≤ .05. (B) BCWM.1 cells (untransfected, scramble probe–, and pre-miRNA-9*–transfected) were harvested at 12 hours after transfection. Whole-cell lysates were subjected to Western blot with the use of anti-PARP, –caspase-8, –caspase-9, and –actin antibodies. (C-D) BCWM.1 cells were cultured with LBH589 (0-60nM) for 16 hours. Whole-cell lysates were subjected to Western blot with the use of anti-p53, –BCL-XL, –Mcl-1, –c-myc, –β-actin, -PARP, –caspase-9, –caspase-8, –caspase-3, and –α-tubulin antibodies. (E) BCWM.1 cells were cultured with LBH589 for 48 hours at doses that range from 0 to 60nM, and the percentage of cells undergoing apoptosis was studied by Apo2.7 staining by flow cytometry. All P ≤ .05.
To further confirm that miRNA-9*–dependent modulation of HDAC activity leads to toxicity in WM cells, the effect of LBH589 has been tested in WM cells. Histone acetylation regulates the function of many genes involved in cell survival.10,25 We therefore sought to examine the effect of LBH589 on the expression of proteins known to be regulated by histone acetylation; we observed an up-regulation of p53, together with down-regulation of BCL-XL, Mcl-1, and c-myc (Figure 5C). In addition, LBH589-dependent inhibition of HDACs resulted in the activation of both intrinsic and extrinsic apoptotic pathways with caspase-9, caspase-8, caspase-3, and PARP cleavage in a dose-dependent manner (Figure 5D). We next examined the functional effect of HDAC inhibition on apoptosis of WM cells; we demonstrated that LBH589 induced significant apoptosis in a dose-dependent manner, as evidenced by Apo2.7 staining and flow cytometric analysis. The percentage of apoptotic BCWM.1 cells increased from 3.2% (untreated) to 27.8% and 65.6% after 48 hours of treatment with LBH589 20nM and 60nM, respectively (Figure 5E). Similar data were obtained with other IgM-secreting cell lines (data not shown).
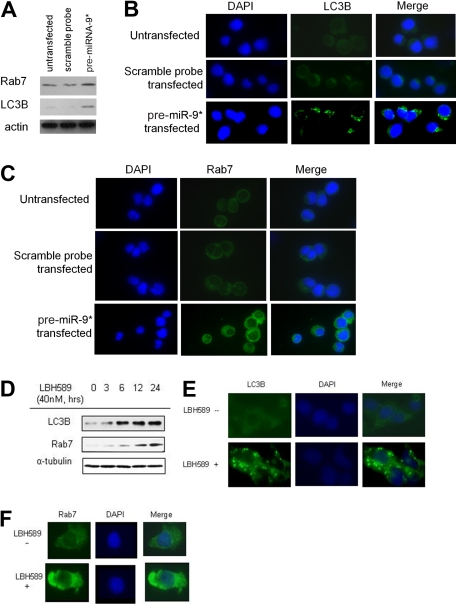
It has been shown that HDAC inhibition leads to apoptosis though caspase-independent mechanisms, such as inducing autophagy.26,27 We therefore evaluated the efficacy of miRNA-9* in modulating autophagy in WM cells and found up-regulation of Rab7 and LC3B in pre-miRNA-9*–transfected cells compared with either untransfected or scramble probe–transfected cells (Figure 6A). The effect of LBH589 in inducing autophagy was next evaluated. BCWM.1 cells were incubated with LBH589 (40nM for 3, 6, 12, and 24 hours), and whole-cell extracts were then analyzed with immunoblotting. We found that LBH589 increased LC3B and Rab7 expression in a time-dependent manner (Figure 6B). We further confirmed that LC3B and Rab7 protein levels were up-regulated by LBH589 in BCWM.1 cells with the use of immunofluorescence (Figure 6C-D). These data confirm that HDAC inhibition, because of either miRNA9*-dependent modulation or LBH589 treatment, results in the induction of autophagy in WM cells.
Figure 6.
miRNA-9*–dependent HDAC inhibition and modulation of autophagy in WM cells. (A) BCWM.1 cells (untransfected, scramble probe–,and pre-miRNA-9*–transfected) were harvested at 24 hours after transfection. Whole-cell lysates were subjected to Western blot with the use of anti-Rab7, -LC3, and -actin antibodies. (B) BCWM.1 cells were cultured with LBH589 (40nM) for 0 to 24 hours. Whole-cell lysates were subjected to Western blotting with the use of anti-Rab7 and -LC3B antibodies. (C-D) BCWM.1 cells were cultured in the presence or absence of LBH589 (40nM) for 16 hours. Immunocytochemical analysis was assessed with the use of anti-Rab7 (C) or -LC3B (D) antibodies. DAPI indicates 4′-6′-diamidine-2-phenylindole.
Neither adherence to BMSCs nor growth factors protect against miRNA-9*–dependent effect on WM cells
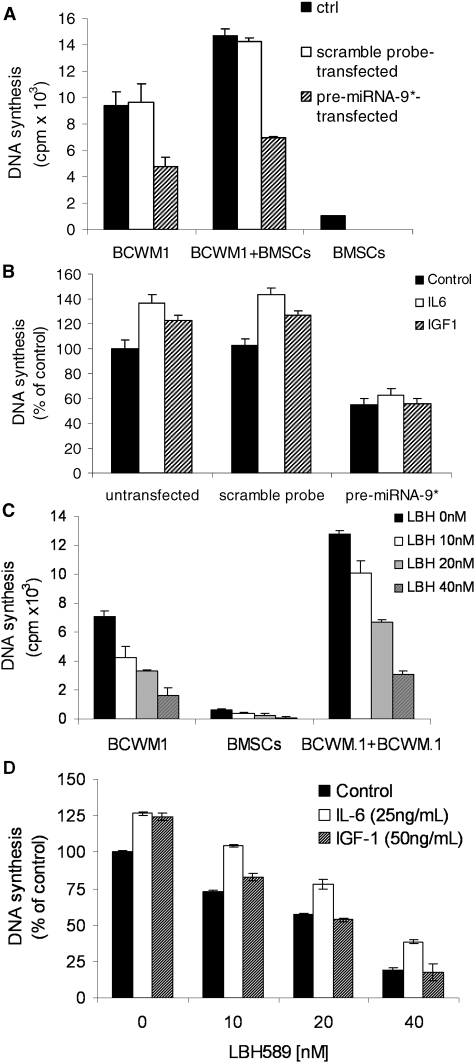
Because the BM microenvironment confers growth and induces drug resistance in malignant cells,28 we next investigated whether miRNA-9*–dependent modulation of WM cell proliferation and survival could inhibit WM cell growth even in the context of the BM milieu. Untransfected, scramble probe–transfected, and pre-miRNA-9*–transfected WM cells were cultured in the presence or absence of BMSCs for 48 hours; we found that the adherence of untransfected, scramble probe, or pre-miRNA-9*–transfected BCWM.1 cells to BMSCs triggered an increase of 70%, 68%, and 47% in proliferation, respectively, compared with untransfected, scramble probe–, and pre-miRNA-9*–transfected cells cultured alone (Figure 7A), indicating the ability of miRNA-9* to inhibit WM cell proliferation, even in the presence of BM milieu.
Figure 7.
miRNA-9*–dependent modulation of WM cell proliferation in the context of BM milieu. (A) BCWM.1 cells (untransfected, scramble probe–, pre-miRNA-9*–transfected) were cultured for 48 hours in the presence or absence of primary BM stromal cells (BMSCs). Cell proliferation was assessed with the use of the [3H]-thymidine uptake assay. (B) BCWM.1 cells (untransfected, scramble probe–, pre-miRNA-9*–transfected) were cultured in the presence or absence of IL-6 (25 ng/mL) or IGF-1 (50 ng/mL) for 48 hours. DNA synthesis was assessed with the use of the [3H]-thymidine uptake assay. (C) BCWM.1 cells were cultured with LBH589 (0-40nM) for 48 hours in the presence or absence of WM patient-derived BMSCs. Cell proliferation was assessed with the use of the [3H]-thymidine uptake assay. (D) BCWM.1 cells were cultured with LBH589 (0-40nM) in the absence and presence of IL-6 (25 ng/mL) or IGF-1 (50 ng/mL) for 48 hours. DNA synthesis was assessed with the use of the [3H]-thymidine uptake assay. All P ≤ .05.
Previous studies that used gene expression analysis in WM have shown an up-regulation in interleukin-6 (IL-6) signaling.29 IL-6 also promotes plasmacytoid lymphocyte growth in WM, and serum IL-6 levels reflect tumor burden and disease severity.30 Similarly, it has been previously shown that insulin growth factor 1 (IGF-1) induces the proliferation of WM cells.16 We therefore next tested whether the addition of recombinant human IL-6 (25 ng/mL) or IGF-1 (50 ng/mL) can overcome miRNA-9*–dependent WM cytotoxicity. Both IL-6 and IGF-1 induced proliferation of either untransfected or scramble probe–transfected cells, in contrast with pre-miRNA-9*–transfected cells in which IL-6 and IGF-1 did not exert any pro-proliferative effect (Figure 7B).
To further confirm the role of HDAC inhibition in reducing WM cell proliferation, even in the context of BM milieu and in the presence of IL-6 and IGF-1, the effect of the HDAC inhibitor LBH589 was next tested in WM cells in the presence or absence of BMSCs and cytokines. BCWM.1 cells were cultured with LBH589 (10-40nM) in the presence or absence of BMSCs for 48 hours. The viability of BMSCs, assessed by MTS, was not affected by LBH589 treatment (data not shown). With the use of the [3H]-TdR uptake assay, adherence of BCWM.1 cells to BMSCs triggered an increase of 77% in proliferation, which was inhibited by LBH589 in a dose-dependent manner (Figure 7C), even in the presence of the BM milieu. In addition, both IL-6 and IGF-1induced the proliferation of BCWM.1 cells, and the addition of LBH589 (10-40nM) inhibited IL-6– and IGF-1–induced proliferation of BCWM.1 cells, indicating that LBH589 can overcome the resistance induced by growth factors such as IL-6 and IGF-1 (Figure 7D).
Discussion
Alterations in the balance between HAT and HDAC activity in many cancers will lead to deregulated gene expression and the induction of proliferation and survival in tumor cells.5–10 HDACs mediate the function of oncogenic translocations in many malignancies, including promyelocytic leukemia–retinoic acid receptor in acute promyelocytic leukemia.31 Most of the aberrant HAT and HDAC activity has been due to translocation, amplification, overexpression, or mutation in many malignancies, including hematologic malignancies.9,26,32 However, mechanisms responsible for the modulation of histone acetylation and HDAC activity in WM have not been fully elucidated.
Recent studies have shown that miRNAs may exert their activity by interfering with the epigenetic machinery, such as modulating the expression of enzymes regulating DNA methylation or histone modification.33–35 Indeed, miRNA-449a regulates histone acetylation status in prostate cancer cells by targeting HDAC1. It has been shown that up-regulation of miRNA-449a in prostate cancer cells exerts an antiproliferative effect on the tumor clone, supported by cell cycle arrest and induction of a senescence-like phenotype and apoptosis.35 In addition, other miRNAs are responsible for targeting histone methyltransferases. For example, it has been recently reported that miRNA-101 targets the enhancer of Zeste homolog 2 (EZH2); the low expression level in several tumor types could lead to up-regulation of EZH2 in aggressive tumors with an invasive phenotype.36,37 These findings confirm the role of miRNAs in regulating histone acetylation status in clonal tumor cells.
We have been able to demonstrate that primary WM cells present with decreased expression of miRNA-9* and increased expression of miRNA-206 compared with their normal cellular counterpart. Predicted targets for miRNA-206 and -9* include histone-modifying genes, such as HDACs and HATs. We first confirmed the efficacy of miRNA-9* and miRNA-206 in targeting HDACs and HAT, respectively. We, therefore, hypothesized that altered miRNA signature in WM cells could modulate histone acetylation and HDAC activity in the tumor clone. We demonstrated that primary WM cells are characterized by unbalanced expression of HDACs and HATs at the mRNA level, responsible for decreased acetylated-histone-H3 and -H4, and increased HDAC activity in primary WM cells compared with normal cells, suggesting that histone modification may play a role in the pathogenesis of WM.
We next showed that miRNA-9* and -206 play a functional role in regulating histone-acetylation and HDAC activity in WM cells, leading to induction of toxicity in WM cells, as shown by decreased DNA synthesis, cell cycle arrest, and induction of apoptosis in pre-miRNA-9*–transfected cells. We established that reduced expression of miRNA-9* and increased expression of miRNA-206 in primary WM cells resulted in higher HDAC activity together with lower acetylated status of H3 and H4. This was accomplished through the ability of these miRNAs to target HDAC4/HDAC5 and Myst3, respectively. The aberrantly up-regulated HDAC activity in WM cells was inhibited by overexpressing miRNA9* in WM cells, as well in other IgM-secreting low-grade lymphoma cell lines, which led to cytotoxicity and induction of apoptosis in WM cells. Similar results were obtained when tumor cells were exposed to the HDAC inhibitor LBH589, indicating that targeting HDAC is critical in this disease.
In summary, our data indicate that loss of miRNA-9* may be responsible for up-regulation of HDAC4 and HDAC5 in primary WM cells, contributing to the pathogenesis of this disease; this also indicates the potential therapeutic value of synthetic miRNA oligonucleotides as epigenetic modulators with a mechanism of action similar to chemical HDAC inhibitors.
Supplementary Material
Acknowledgments
We thank Ms Jennifer Stedman for editing the manuscript.
This work was supported in part by the Kirsch Laboratory for WM and The Heje Fellowship for WM, as well as the National Institutes of Health (grants 1R01FD003743-01 and 1R01CA154648-01).
Footnotes
The online version of this article contains a data supplement.
The publication costs of this article were defrayed in part by page charge payment. Therefore, and solely to indicate this fact, this article is hereby marked “advertisement” in accordance with 18 USC section 1734.
Authorship
Contribution: A.M.R., A.S., and I.M.G. designed research, analyzed data, and wrote the paper; and A.S., X.J., A.K.A., P.M., H.T.N., F.A., J.R., and P.Q. performed research.
Conflict-of-interest disclosure: I.M.G. was previously on speakers bureaus and received honoraria from Millennium, Celgene, and Novartis (September 2009) and received research funding from Millennium and Novartis. The remaining authors declare no competing financial interests.
Correspondence: Irene M. Ghobrial, Kirsch Laboratory for Waldenstrom Macroglobulinemia, Medical Oncology, Dana-Farber Cancer Institute, 44 Binney St, Mayer 548A, Boston, MA 02115; e-mail: irene_ghobrial@dfci.harvard.edu
References
- 1.Ghobrial IM, Gertz MA, Fonseca R. Waldenstrom macroglobulinaemia. Lancet Oncol. 2003;4(11):679–685. doi: 10.1016/s1470-2045(03)01246-4. [DOI] [PubMed] [Google Scholar]
- 2.Owen RG, Treon SP, Al-Katib A, et al. Clinicopathological definition of Waldenström's macroglobulinemia: consensus panel recommendations from the Second International Workshop on Waldenström's Macroglobulinemia. Semin Oncol. 2003;30(2):110–115. doi: 10.1053/sonc.2003.50082. [DOI] [PubMed] [Google Scholar]
- 3.Schop RF, Kuehl WM, Van Wier SA, et al. Waldenström macroglobulinemia neoplastic cells lack immunoglobulin heavy chain locus translocations but have frequent 6q deletions. Blood. 2002;100(8):2996–3001. doi: 10.1182/blood.V100.8.2996. [DOI] [PubMed] [Google Scholar]
- 4.Chng WJ, Schop RF, Price-Troska T, et al. Gene expression profiling of Waldenström's macroglobulinemia reveals a phenotype more similar to chronic lymphocytic leukemia than multiple myeloma. Blood. 2006;108(8):2755–2763. doi: 10.1182/blood-2006-02-005488. [DOI] [PMC free article] [PubMed] [Google Scholar]
- 5.Esteller M. Epigenetics in Cancer. N Engl J Med. 2008;358(11):1148–1159. doi: 10.1056/NEJMra072067. [DOI] [PubMed] [Google Scholar]
- 6.Mack GS. Epigenetic cancer therapy makes headway. J Natl Cancer Inst. 2006;98(20):1443–1444. doi: 10.1093/jnci/djj447. [DOI] [PubMed] [Google Scholar]
- 7.Bernstein BE, Meissner A, Lander ES. The mammalian epigenome. Cell. 2007;128(4):669–681. doi: 10.1016/j.cell.2007.01.033. [DOI] [PubMed] [Google Scholar]
- 8.Esteller M. Epigenetics provides a new generation of oncogenes and tumour-suppressor genes. Br J Cancer. 2006;94(2):179–183. doi: 10.1038/sj.bjc.6602918. [DOI] [PMC free article] [PubMed] [Google Scholar]
- 9.Cloos PA, Christensen J, Agger K, et al. The putative oncogene GASC1 demethylates tri- and dimethylated lysine 9 on histone H3. Nature. 2006;442(7100):307–311. doi: 10.1038/nature04837. [DOI] [PubMed] [Google Scholar]
- 10.Liu PY, Chan JY, Lin HC, et al. Modulation of the cyclin-dependent kinase inhibitor p21(WAF1/Cip1) gene by Zac1 through the antagonistic regulators p53 and histone deacetylase 1 in HeLa Cells. Mol Cancer Res. 2008;6(7):1204–1214. doi: 10.1158/1541-7786.MCR-08-0123. [DOI] [PubMed] [Google Scholar]
- 11.Roccaro AM, Sacco A, Chen C, et al. microRNA expression in the biology, prognosis, and therapy of Waldenström macroglobulinemia. Blood. 2009;113(18):4391–4402. doi: 10.1182/blood-2008-09-178228. [DOI] [PMC free article] [PubMed] [Google Scholar]
- 12.Santos DHA, Tournilhac O, Leleu X, et al. Establishment of a Waldenstrom's macroglobulinemia cell line (BCWM.1) with productive in vivo engraftment in SCID-hu Mice. Clin Exp Hematol. 2007;35(9):1366–1375. doi: 10.1016/j.exphem.2007.05.022. [DOI] [PubMed] [Google Scholar]
- 13.Leleu X, Jia X, Runnels J, et al. The Akt pathway regulates survival and homing in Waldenstrom macroglobulinemia. Blood. 2007;110(13):4417–4426. doi: 10.1182/blood-2007-05-092098. [DOI] [PMC free article] [PubMed] [Google Scholar]
- 14.Thangaraju M, Gopal E, Martin PM, et al. SLC5A8 triggers tumor cell apoptosis through pyruvate-dependent inhibition of histone deacetylases. Cancer Res. 2006;66(24):11560–11564. doi: 10.1158/0008-5472.CAN-06-1950. [DOI] [PubMed] [Google Scholar]
- 15.Zhan F, Tian E, Bumm K, Smith R, Barlogie B, Shaughnessy J., Jr Gene expression profiling of human plasma cell differentiation and classification of multiple myeloma based on similarities to distinct stages of late-stage B-cell development. Blood. 2003;101(3):1128–1140. doi: 10.1182/blood-2002-06-1737. [DOI] [PubMed] [Google Scholar]
- 16.Conaco C, Otto S, Han JJ, Mandel G. Reciprocal actions of REST and a microRNA promote neuronal identity. Proc Natl Acad Sci U S A. 2006;103(7):2422–2427. doi: 10.1073/pnas.0511041103. [DOI] [PMC free article] [PubMed] [Google Scholar]
- 17.Nottrott S, Simard MJ, Richter JD. Human let-7a miRNA blocks protein production on actively translating polyribosomes. Nature. 2006;13(12):1108–1114. doi: 10.1038/nsmb1173. [DOI] [PubMed] [Google Scholar]
- 18.Felli N, Fontana L, Pelosi E, et al. MicroRNAs 221 and 222 inhibit normal erythropoiesis and erythroleukemic cell growth via kit receptor down-modulation. Proc Natl Acad Sci U S A. 2005;102(50):18081–18086. doi: 10.1073/pnas.0506216102. [DOI] [PMC free article] [PubMed] [Google Scholar]
- 19.Roccaro AM, Sacco A, Thompson B, et al. MicroRNAs 15a and 16 regulate tumor proliferation in multiple myeloma. Blood. 2009;113(26):6669–6680. doi: 10.1182/blood-2009-01-198408. [DOI] [PMC free article] [PubMed] [Google Scholar]
- 20.Chen C, Ridzon DA, Broomer AJ, et al. Real-time quantification of microRNAs by stem-loop RT-PCR. Nucleic Acids Res. 2005;33(20):e179. doi: 10.1093/nar/gni178. [DOI] [PMC free article] [PubMed] [Google Scholar]
- 21.Livak KJ, Scmittgen TD. Analysis of relative gene expression data using real-time quantitative PCR and the 2(-Delta Delta C(T)) Method. Methods. 2001;25(4):402–408. doi: 10.1006/meth.2001.1262. [DOI] [PubMed] [Google Scholar]
- 22.Lewis BP, Shih IH, Jones-Rhoades MW, Bartel DP, Burge CB. Prediction of mammalian microRNA targets. Cell. 2003;115(7):787–798. doi: 10.1016/s0092-8674(03)01018-3. [DOI] [PubMed] [Google Scholar]
- 23.Krek A, Grun D, Poy MN, et al. Combinatorial microRNA target predictions. Nat Genet. 2005;37(5):495–500. doi: 10.1038/ng1536. [DOI] [PubMed] [Google Scholar]
- 24.Wilson AJ, Byun DS, Nasser S, et al. HDAC4 promotes growth of colon cancer cells via repression of p21. Mol Biol Cell. 2008;19(10):4062–4075. doi: 10.1091/mbc.E08-02-0139. [DOI] [PMC free article] [PubMed] [Google Scholar]
- 25.Ropero S, Fraga MF, Ballestar E, et al. A truncating mutation of HDAC2 in human cancers confers resistance to histone deacetylase inhibition. Nat Genet. 2006;38(5):566–569. doi: 10.1038/ng1773. [DOI] [PubMed] [Google Scholar]
- 26.Shao Y, Gao Z, Marks PA, Jiang X. Apoptotic and autophagic cell death induced by histone deacetylase inhibitors. Proc Natl Acad Sci U S A. 2004;101(52):18030–18035. doi: 10.1073/pnas.0408345102. [DOI] [PMC free article] [PubMed] [Google Scholar]
- 27.Catley L, Weisberg E, Kiziltepe T, et al. Aggresome induction by proteasome inhibitor bortezomib and alpha-tubulin hyperacetylation by tubulin deacetylase (TDAC) inhibitor LBH589 are synergistic in myeloma cells. Blood. 2006;108(10):3441–3449. doi: 10.1182/blood-2006-04-016055. [DOI] [PMC free article] [PubMed] [Google Scholar]
- 28.Mitsiades CS, Mitsiades NS, Munshi NC, Richardson PG, Anderson KC. The role of the bone microenvironment in the pathophysiology and therapeutic management of multiple myeloma: interplay of growth factors, their receptors and stromal interactions. Eur J Cancer. 2006;42(11):1564–1573. doi: 10.1016/j.ejca.2005.12.025. [DOI] [PubMed] [Google Scholar]
- 29.Gutierrez NC, Ocio EM, de Las Rivas J, et al. Gene expression profiling of B lymphocytes and plasma cells from Waldenstrom's macroglobulinemia: comparison with expression patterns of the same cell counterparts from chronic lymphocytic leukemia, multiple myeloma and normal individuals. Leukemia. 2007;21(3):541–549. doi: 10.1038/sj.leu.2404520. [DOI] [PubMed] [Google Scholar]
- 30.Moreau AS, Jia X, Ngo HT, et al. Protein kinase C inhibitor enzastaurin induces in vitro and in vivo antitumor activity in Waldenstrom macroglobulinemia. Blood. 2007;109(11):4964–4972. doi: 10.1182/blood-2006-10-054577. [DOI] [PubMed] [Google Scholar]
- 31.Côté S, Rosenauer A, Bianchini A, et al. Response to histone deacetylase inhibition of novel PML/RARalpha mutants detected in retinoic acid-resistant APL cells. Blood. 2002;100(7):2586–2596. doi: 10.1182/blood-2002-02-0614. [DOI] [PubMed] [Google Scholar]
- 32.Bolden JE, Peart MJ, Johnstone RW. Anticancer activities of histone deacetylase inhibitors. Nat Rev Drug Discov. 2006;5(9):769–784. doi: 10.1038/nrd2133. [DOI] [PubMed] [Google Scholar]
- 33.Fabbri M, Garzon R, Cimmino A, et al. MicroRNA-29 family reverts aberrant methylation in lung cancer by targeting DNA methyltransferases 3A and 3B. Proc Natl Acad Sci U S A. 2007;140(40):15805–15810. doi: 10.1073/pnas.0707628104. [DOI] [PMC free article] [PubMed] [Google Scholar]
- 34.Garzon R, Liu S, Fabbri M, et al. MicroRNA-29b induces global DNA hypomethylation and tumor suppressor gene repression in acute myeloid leukemia by targeting directly DNMT3A and 3B and indirectly DNMT1. Blood. 2009;113(25):6411–6418. doi: 10.1182/blood-2008-07-170589. [DOI] [PMC free article] [PubMed] [Google Scholar]
- 35.Noonan EJ, Place RF, Pookot D, et al. miR-449a targets HDAC-1 and induces growth arrest in prostate cancer. Oncogene. 2009;28(14):1714–1724. doi: 10.1038/onc.2009.19. [DOI] [PubMed] [Google Scholar]
- 36.Varambally S, Cao Q, Maini RS, et al. Genomic loss of microRNA-101 leads to overexpression of histone methyltransferase EZH2 in cancer. Science. 2008;322(5908):1695–1699. doi: 10.1126/science.1165395. [DOI] [PMC free article] [PubMed] [Google Scholar]
- 37.Friedman JM, Liang G, Liu CC, et al. The putative tumor suppressor microRNA-101 modulates the cancer epigenome by repressing the polycomb group protein EZH2. Cancer Res. 2009;69(6):2623–2629. doi: 10.1158/0008-5472.CAN-08-3114. [DOI] [PubMed] [Google Scholar]
Associated Data
This section collects any data citations, data availability statements, or supplementary materials included in this article.


