

Abstract
Convection-enhanced delivery (CED) has emerged as a promising method of targeted drug-delivery for treating central nervous system (CNS) disorders, but the influence of brain structure on infusate distribution is unclear. We have utilized this approach to study extracellular transport and distribution of a contrast agent in the hippocampus, a complex structure susceptible to CNS disorders. The magnetic resonance (MR) contrast agent diethylene triamene penta-acetic acid chelated gadolinium-labeled albumin (Gd-albumin), tagged with Evans blue dye, was directly infused into the dorsal and ventral hippocampus of seven male Sprague-Dawley rats. The final distribution profile of the contrast agent, a product of CED and limited diffusion, was observed in vivo using high-resolution T1-weighted MR imaging at 11.1 Tesla. Dense cell layers, such as the granule cell layer of the dentate gyrus and the pyramidal cell layer of CA1, appeared to be barriers to transport of the tracer. Three-dimensional distribution shape and volume (Vd) differences, between the dorsal and ventral hippocampus infusions, were determined from the MR images using a semi-automatic segmentation routine (Dorsal Vd = 23.4 ± 1.8 μl, Ventral Vd = 36.4 ± 5.1 μl). Finer structural detail of the hippocampus was obtained using a combination of histological analysis and fluorescence imaging. This study demonstrates that CED has the potential to target all regions of the hippocampus and that tracer distribution is influenced by infusion site, underlying structure and circuitry, and extent of backflow. Therefore, CED, combined with high-resolution MR imaging, may be a useful strategy for delivering therapeutics for the treatment of CNS disorders affecting the hippocampus.
Keywords: Convection-enhanced delivery, magnetic resonance imaging, contrast agent, Gd-albumin, rat hippocampus
INTRODUCTION
Convection-enhanced delivery (CED) is the direct infusion of a therapeutic agent into the extracellular space of tissues via a positive pressure gradient. In contrast to diffusion-driven transport, CED relies on bulk flow which results in nearly homogenous infusate concentration profiles with a steep drop off at the boundary of the perfused region (Song and Lonser, 2008). CED into the central nervous system (CNS) consists of placing a cannula directly into the parenchyma, bypassing the blood-brain barrier (BBB), and allows targeting of specific tissue structures. Current CED research focuses on potential clinical applications, evaluating the efficacy of drug carriers, optimizing infusion parameters and infusion hardware (e.g. flow rate and duration, cannula design), and understanding the influence of the underlying tissue structure on the final distribution of the infused agent in the CNS (Jagannathan et al., 2008; Olson et al., 2008; Raghavan et al., 2006; Sampson et al., 2007; Song and Lonser, 2008).
With sufficient understanding of the controlling influences, CED might be used to target local delivery of therapeutics into complex regions of the brain with heterogeneous and intricate neuroanatomy. One such structure is the hippocampus, which is comprised of densely packed layers of neurons (grey matter (GM)), and their axonal projections (white matter (WM)) in a tightly-rolled, banana-shaped structure. In addition, the hippocampus includes perivascular spaces and pial surfaces that line the ventricular compartments continuous with hippocampal fissures. The hippocampus is vulnerable to damage as a result of trauma (Tate and Bigler, 2000) and hypoglycemia (Auer and Siesjo, 1988), and is the central component of rare conditions such as limbic encephalitis (Corsellis et al., 1968) and dementia with isolated hippocampal sclerosis (Dickson et al., 1994). Hippocampal involvement has been recognized in schizophrenia (Maier et al., 1995; Nelson et al., 1998), and is critical to the manifestation of Alzheimer’s disease (deToledo-Morrell et al., 2007; Duyckaerts et al., 2009; Ohm, 2007) and temporal lobe epilepsy (Bertram, 2009). CED has already been proposed to deliver therapeutic agents to treat epilepsy (Rogawski, 2009). With the advantages of homogenous perfusion of tissue, specific targeting, and large volumes of distribution, CED is capable of significantly enhancing spatial distribution of therapeutics into the hippocampus beyond what is possible with diffusion-driven mechanisms alone. If the CED distribution of a therapeutic agent within the hippocampus can be predicted, this may enable the application of CED to the treatment of various hippocampal disorders. However, accurate prediction of distribution profiles in the hippocampus requires an understanding of how the underlying tissue architecture influences transport of a delivered agent.
With the use of contrast agents, magnetic resonance (MR) imaging provides a means of non-invasively monitoring distribution profiles of agents delivered by CED and can provide insight into the influence of anatomy on tracer distributions. Typically, gadolinium-based contrast agents are used, which contain a paramagnetic center that interacts with surrounding water to reduce the longitudinal and transverse relaxation times (Lauffer, 1987). In a relaxation-weighted image, the reduced longitudinal relaxation times (T1) result in a higher signal in regions of tissue exposed to the contrast agent, provided transverse relaxation times (T2) are not substantially reduced. MR can also be used to monitor CED by observing an increase in water signal seen in T2-weighted images (Heiss et al., 2005). Gadolinium-based contrast agents have been co-infused with therapeutic agents to track their distribution in real-time. Co-infusion of glucocerebrosidase and diethylene triamene penta-acetic acid chelated gadolinium (Gd-DTPA) into the region of the right facial and abducens nuclei was used to treat a patient with Gaucher’s disease and allowed researchers to monitor the distribution of the agent as well as observe the agent cross a pial surface to enter the third ventricle (Song and Lonser, 2008). Other studies have also been performed to investigate the effect of pial surfaces on final distribution volumes of small molecular weight (Gd-DTPA) and large molecular weight (Gd-DTPA-bound albumin (Gd-albumin)) tracers infused into the primate brainstem (Jagannathan et al., 2008). As a free ion, gadolinium is highly toxic but is regarded as safe when administered as a chelated compound. Gd-DTPA has been used in animal and human CNS studies, without showing signs of toxicity (Ding et al., 2009; Song and Lonser, 2008); however, it has been shown to have an adverse affect on patients with pre-existing kidney disease (Abujudeh et al., 2009). Liposomal drug carriers containing Gd have also been synthesized to provide a more direct method of monitoring the distribution of these therapeutic agent carriers (Fiandaca et al., 2008; Krauze et al., 2008). MR has been used to monitor the distribution of these delivery vehicles as well as evaluate the performance of backflow-resistant cannulae (Fiandaca et al., 2008). MR has also been used to evaluate the effect of infusate viscosity on final distribution volumes in rat brain striatal tumors (Mardor et al., 2009). However, no previous studies have implemented high-resolution MR to investigate CED for delivering an agent into a structure as complex as the hippocampus.
In addition to MR, histology has also been used to evaluate tracer distribution of agents infused into the CNS. Light microscopy was used to detect the presence of Evans blue dye infused into the striatum of a mouse brain via an implantable microfluidic device designed for chronic CED (Foley et al., 2009). Fluorescence microscopy has been used to observe the distribution of polyethylene glycol-coated liposomal doxorubicin infused into the rat brain parenchyma with an intracranial tumor (Kikuchi et al., 2008). Not only can histology provide higher-resolution visualization of distribution at the cellular level, but histological staining protocols can verify particular structural details that may influence distribution.
In this study we explored the effects of tissue structures on infusate distributions after CED and limited diffusion in the hippocampus. Final distribution patterns of a contrast agent, Gd-albumin, labeled with Evans blue dye, infused into the left-side dorsal and right-side ventral hippocampus of a rat were evaluated with two currently available imaging modalities: (1) in vivo imaging of contrast agent distribution using high resolution MR imaging and (2) fluorescence microscopy of the distribution of Evans blue in histological slices. MR provided a means of non-invasively monitoring distribution profiles of contrast agents delivered by CED in vivo, while optical microscopy yielded higher resolution of finer structural detail. Black-gold staining was used to label myelinated white matter structures, and Cresyl violet staining was used to visualize cell bodies. The results of this study demonstrate that the infusion site and hippocampal structure appear to dictate the distribution of infusate delivered by CED.
MATERIALS AND METHODS
Animal Preparation and Surgical Procedures
Experiments were performed on 2.5-month old male Sprague-Dawley rats (n = 7) using protocols and procedures approved by the University of Florida Institutional Animal Care and Use Committee. Anesthesia was initiated with xylazine (10 mg/kg, SQ) and isoflurane (4%) in 1 L/min oxygen, then animals were placed in a stereotaxic Kopf apparatus, and inhalation anesthesia (1.5% in 1.5 L/min oxygen) was delivered via a nose mask. The skull was exposed by a mid-sagittal incision that began between the eyes and extended caudally to the level of the ears to expose bregma and lambdoidal sutures. One hole was drilled into the skull above the left-side dorsal hippocampus and a second hole was drilled above the right-side ventral hippocampus. Then 5.0 μl of Gd-DTPA-albumin (10 mg/ml in PBS solution; MW ~ 87 kDa,; ~35 Gd-DTPA molecules per albumin molecule; R. Brasch Laboratory, University of California, San Francisco, CA), tagged with Evans Blue dye was infused into the dorsal dentate gyrus of the hippocampus (AP = −3.7, ML = −2.2, DV = −3.4) and another 5 μl into the ventral CA1 subregion of the hippocampus (AP = −5.0, ML = 4.9, DV = 5.0) at a rate of 0.3 μl/min. Over concerns that the Gd-albumin may be aggregating, high performance liquid chromatography (HPLC) was used to evaluate the macromolecular constituents of the infusate solution. HPLC resulted in a single elutant peak suggesting the Gd-albumin was not aggregating and the covalent bonds attaching the Gd-DTPA molecules to albumin were intact. The infusion system consisted of a 100 μl gas-tight syringe (Hamilton, Reno, NV) driven by a syringe pump (Cole-Parmer, Vernon Hills, IL) connected to polyaryletheretherketone (PEEK) tubing (ID = 0.381 mm, OD = 0.794 mm, length ~ 0.5 m, Upchurch Scientific, Oak Harbor, WA). The PEEK tubing was coupled to a silica cannula (ID = 50 μm, OD = 147 μm, Polymicro Technologies, Phoenix, AZ) via a microfluidic connector. Immediately following the infusion surgery (~30 min), animals were transported to the 11.1 Tesla (T) magnet for MR imaging. At the end of the experiment, animals under inhalation anesthesia (1.5% in 1.5 L/min oxygen) were given xylazine (10 mg/kg, SQ) and ketamine (80 mg/kg, IP). Upon ensuring deep anesthesia, the chest activity was opened to expose the heart, and a needle connected to an infusion pump was inserted into the left ventricle. 200–300 ml of 0.9% saline solution was circulated by the heart, followed by 200–300 ml of 4% paraformaldehyde solution. The brain was then extracted from the skull following decapitation and stored in 4% paraformaldehyde solution overnight.
MR Imaging and Image Segmentation
MR experiments were preformed using a Bruker Avance imaging console (Bruker NMR Instruments, Billeria, MA) connected to a Magnex Scientific 11.1 T horizontal bore magnet system (Varian, Inc., Magnex Scientific Products, Walnut Creek California). A custom-made 130 degree arc, 3.5 cm rectangular linear-field surface coil constructed on a 4 cm diameter half-cylinder was used for linear transmission and detection of MR signal. Two sets of high-resolution T1-weighted images, with slices oriented in the coronal and sagittal directions, were acquired using a spin-echo sequence with a 2 cm × 2 cm field-of-view in a matrix of 160 × 160, recovery time of 1000 ms, echo time of 10 ms and 20 slices. Coronally-oriented and sagittally-oriented data were acquired with 8 averages and 6 averages respectively. Final distribution volumes of Gd-albumin were calculated by performing semi-automatic image segmentation on the high-resolution T1-weighted coronal images using the ITK-SNAP open-source medical image segmentation tool (Yushkevich et. al; http://www.itksnap.org/). Dorsal and ventral hippocampus infusion volumes were segmented separately with the following specific threshold criteria. Voxels were included in the infusion volume if their signal intensity was at least 6 standard deviations of noise higher than the signal intensity in the corresponding region contralateral to the site of infusion. Final distribution volumes in the dorsal and ventral hippocampus were calculated by counting the number of voxels included in each segmented region and multiplying by the volume of a single voxel.
Histology
Black Gold was used to stain myelin in mounted sections. Black-Gold II powder (Histo-Chem Inc., Jefferson, AR) was resuspended in saline solution (0.9% NaCl) to a final concentration of 0.3%. The solution was heated to 60°C, and rehydrated tissue sections were incubated for 12–18 minutes, until desired intensity was achieved. The sections were then rinsed in double distilled water for 2 minutes, followed by sodium thiosulfate solution (1%) for 3 minutes. Finally, sections were rinsed three times with double distilled water for 5 minutes per rinse. Cresyl violet staining was performed to stain cell bodies in mounted sections. Slides were incubated in Cresyl violet solution for 2–3 minutes until desired intensity was achieved. Slides were then dehydrated using a series of gradated alcohols (75%, 95%, 100%) for 5 minutes each. The dehydrated sections were then cleared in xylene for 2 minutes and cover-slipped with mounting media.
Microscopy
Following mounting and staining, slides were examined on an Olympus BH-2 brightfield and epifluorescence microscope (Olympus America Inc., Center Valley, PA) with a Hitachi KP-D581 color digital video camera (Hitachi Medical Systems America, Inc., Twinsburg, OH) interfaced with an Integral Technologies frame grabber (Pelco, Clovis, Ca) in a desktop computer. Motorized stage and focus (Prior Scientific, Rockland, MA), and image acquisition were controlled through ImagePro Plus (Media Cybernetics, Silver Springs, MD). Anatomical structures were mapped to coronal sections of the Paxinos and Watson rat brain atlas (Paxinos and Watson, 1998).
RESULTS
Infusion site
Infusions (n=14) were targeted into the dentate gyrus of the left-side dorsal hippocampus (n=7) and into the right-side CA1 of the ventral hippocampus (n=7). Actual infusion sites were confirmed with MR and histology. Damage due to insertion of the cannula was minimal with some bleeding at the site of the cannula tip (Fig. 1A) and at the interface between the corpus callosum and alveus of the hippocampus (Fig. 1B), as visualized in histology. Contrast agent infused into the dorsal hippocampus was observed to have only limited penetration into the ipsilateral ventral hippocampus (Fig. 2A and C). Similarly, contrast agent infused into the ventral hippocampus showed severely limited penetration into the ipsilateral dorsal hippocampus (Fig. 2B and D) with small amounts observed in the fimbria.
Fig. 1.

Damage induced by the infusion cannula in the dorsal hippocampus. (A) Blood at the tip of the cannula, (B) Blood within the alveus/corpus-collosum boundary
Fig. 2.
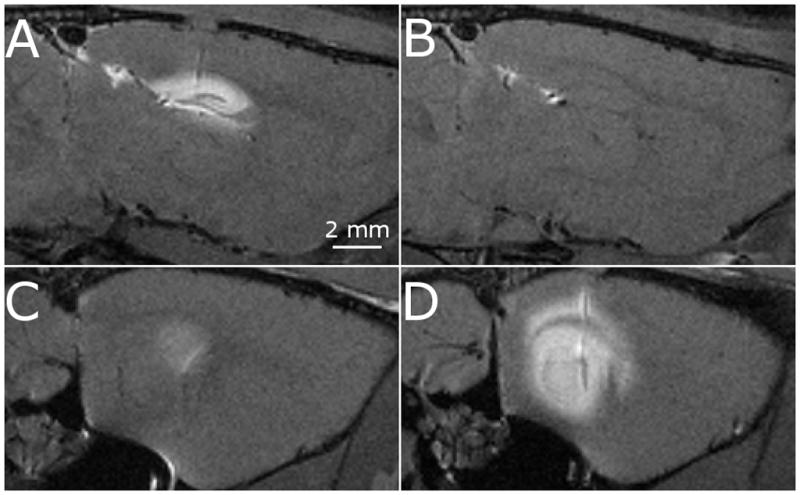
Sagittal images of a single rat demonstrating the apparent disconnect between the dorsal hippocampus (top row) and ventral hippocampus (bottom row). The disconnect is seen when the contrast agent is infused into the dorsal hippocampus (A and C) and ventral hippocampus (B and D).
Infusion sites were clearly identifiable in all subjects in the dorsal hippocampus and 6 of the 7 subjects in the ventral hippocampus. In the dorsal hippocampus infusions, 6 of 7 infusion sites were located at the interface between the fissure and CA1 subregion of the hippocampus. One infusion site was located in the polymorphic layer of the dentate gyrus. In 4 of 7 ventral hippocampus infusion subjects, the infusion site was located at the interface between the hippocampal fissure and CA1 subfield of the hippocampus. In 2 of the subjects, the infusion site was determined to be at the interface between the CA1 subfield and alveus of the hippocampus.
Gd-albumin distribution in the dorsal hippocampus
The profile of the contrast agent distribution into the dorsal hippocampus was easily distinguishable from surrounding tissue. Exposed regions displayed a hyperintense signal with respect to surrounding regions in T1-weighted images (Fig. 3). MR images showed that the contrast agent entered the CA1, CA3 and dentate gyrus subfields of the hippocampus in all animals (Fig. 3) and suggest that contrast agent penetrated poorly into the dense dentate gyrus granule cell layer and CA1 pyramidal cell layer, since these regions remain hypointense with respect to the surrounding subfields and are clearly distinguishable in coronal images (arrowheads in Fig. 3). The contrast agent was seen to cross the midline of the brain in 3 of the 7 subjects. In two of these subjects, the contrast agent crossed the midline of the brain by entering the corpus callosum and traveling medially to the side of the brain contralateral to the infusion site. In one subject, the contrast agent also entered the dorsal hippocampal commissure and was visible in a small portion of the CA1 subfield of the contralateral hippocampus. Contrast agent penetration into the fimbria subfield of the hippocampus was not seen in any of the subjects suggesting the densely packed cell layer CA1 and CA3 subfields served as a barrier to transport into this region (Fig. 3).
Fig. 3.

High-resolution T1-weighted MR images of dorsal hippocampus infusions. (A) Schematic of key structures in the dorsal hippocampus adapted from (Paxinos and Watson, 1998). (B-H) MR image coronal slice of infusion site for dorsal hippocampus infusions in 7 rats. Filled arrow heads, dentate gyrus granule cell layer; unfilled arrow heads, CA1 pyramidal cell layer; asterisk, hippocampal fissure.
Gd-albumin distribution in the ventral hippocampus
The contrast agent penetrated the CA1 and CA2 subfields of ventral hippocampus in all subjects. In 5 of 7 subjects, contrast agent was seen in the dentate gyrus, CA1, CA2, and CA3 subfields of the hippocampus (Fig. 4B, C, E, and F). However in two of the subjects, penetration of the contrast agent into CA1 and CA2 was limited and primarily located in the alveus of the hippocampus (Fig. 4G and H), most likely due to the lateral location of the infusion site (see above discussion of infusion site). The contrast agent did not appear to enter the granule cell layer and hippocampal fissure, since these regions were hypointense relative to the neighboring dentate gyrus. Contrast agent was also observed at the interface between the corpus callosum and the cortex in these subjects.
Fig. 4.

High-resolution T1-weighted MR images of ventral hippocampus infusions. (A) Schematic of key structures in the ventral hippocampus adapted from (Paxinos and Watson, 1998). (B-H) MR image coronal slice of ventral hippocampus infusions into 7 rats. Filled arrow heads, dentate gyrus granule cell layer; unfilled arrow heads, CA1 pyramidal cell layer; asterisk, hippocampal fissure, filled arrow, alveus; unfilled arrow, corpus collosum.
Backflow
Severe backflow, resulting in a significant amount of contrast agent entering the cortex, was seen in 3 of the 7 dorsal infusions (Fig. 3C, E, and F). Mild backflow resulted in minor exposure of the cortex to contrast agent in 2 of the 7 subjects (Fig. 3D and H). In 3 of the 7 subjects, backflow allowed the contrast agent to enter the corpus callosum and travel in both the medial and lateral directions along this white matter fibrous structure (Fig. 3B, C and F).
Severe backflow in ventral infusions resulted in significant amounts of the contrast agent entering the cortex in 3 of the 7 subjects (Fig. 4B, C and E). Minor backflow was observed in 3 of the 7 subjects (Fig. 4D, F and G) and no backflow was seen in 1 subject (Fig. 4H). In cases of minor backflow, contrast agent did not enter the cortex and remained in the hippocampus, usually penetrating the alveus of the hippocampus.
Image Segmentation
The three dimensional contrast agent distributions were visualized with a semi-automated segmentation of the contrast agent enhanced regions (Fig. 5). A distinct difference between the shapes of each distribution can be seen in the three dimensional structures of the dorsal hippocampus distribution volumes (Fig. 5, green body) and ventral hippocampus distribution volumes (Fig. 5, blue body) constructed from these segmentations. Because MR imaging was conducted approximately 30 minutes after CED, the observed distribution profiles include the effects of CED as well as post-CED diffusion. Distribution volumes, including the effects of CED and diffusion, were calculated from the segmentations for each data set and included back flow volumes. For the dorsal hippocampus infusion, the mean and standard deviation of the calculated distribution volume was 23.4 ± 1.8 μl. For the ventral hippocampus infusion, the mean and standard deviation of the calculated distribution volume was 36.4 ± 5.1 μl. The ventral hippocampus distribution volume was greater than the dorsal hippocampus distribution volume (p ≤ 0.0003, power of test = 0.99). The contribution of diffusion after the end of CED to the measured distribution volumes was estimated using an analytical solution of one-dimensional diffusion from a sphere. The radius of the sphere was determined such that the volume of the sphere would be equal to distribution volumes of the contrast agent in the dorsal and ventral hippocampus. The diffusion coefficient of albumin in rat cortical slices, D = 1.63 × 10⁻⁷ cm2/s (Tao and Nicholson, 1996), was used in this estimation. Based on these results we estimate that diffusion after the end of CED may increase distribution volumes up to 40%. This diffusional spread is equivalent to the contrast agent traveling 2–3 voxels (0.250–0.375 mm) during the time-delay between CED and MR imaging (for comparison, the average anterior-posterior spread of the tracer was measured to be 5.4 mm for dorsal infusions and 4.75 mm for ventral infusions).
Fig. 5.

High-resolution T1-weighted MR image coronal slice of the dorsal hippocampus distribution volume (left image in subfigure) and ventral hippocampus (right image in subfigure) and corresponding segmentation (middle image in subfigure) for 4 rats (A-D).
Histological analysis
Evans blue fluorescence confirmed the distributions seen in MR imaging. Dense cell layers that appeared hypointense in MR images likewise did not fluoresce in histological images (arrowheads, Figs. 6 and 7), indicating little or no penetration of the infusate. However, infusate was seen to distribute around the dense cell layers then penetrate the dentate gyrus and CA1-CA3 subregions in all dorsal infusions and 5 of 7 ventral infusions, which is consistent with MR results. Preferential distribution was dependent upon location of the cannula tip. When the cannula tip was located in the interface between the CA1 and hippocampal fissure (asterisks, Figs. 6 and 7), fluorescence was greatest in the molecular layer of the dentate gyrus and CA1 immediately adjacent to the hippocampal fissure. In one subject (Fig. 3D), the cannula tip was in the polymorphic layer of the dentate gyrus, which resulted in a larger volume of contrast agent accumulated internal to the dentate gyrus granule cell layer.
Fig. 6.

Histological images following infusate CED into the dorsal hippocampus showing Evans blue dye spreading throughout the dorsal hippocampus. (A, C) Fluorescence images of 2 subjects showing limited penetration in the dorsal hippocampal dense granule cell layer (filled arrowhead) and pyramidal cell layer (unfilled arrowhead). Preferential distribution can be seen in the hippocampal fissure (asterisks) and alveus (filled arrow). (B) Black-gold stained image in close proximity to (A) confirming alveus and dense cell layer approximations. (D) Cresyl violet staining of a section in close proximity to (C) confirming dense cell layers.
Fig. 7.

Histological images following infusate CED into the ventral hippocampus showing Evans blue dye spreading thoughout the ventral hippocampus. Arrowheads denote granule cell layer of the dentate gyrus and pyramidal cell layer of the CA1. (A) A fluorescence image of Evans blue seen preferentially in the ventral hippocampal fissure (asterisks), alveus (filled arrow) and corpus collosum (unfilled arrow). (B) Cresyl violet stained image of a section in close proximity to (A). (C) Fluorescent image of Evans blue seen preferentially in the alveus and corpus collosum. Chevron shows Evans blue in the perivascular space. (D) Cresyl violet stained image of a section in close proximity to (C).
In 2 of 7 ventral infusion subjects, Evans blue was observed to be predominately distributed within the alveus of the hippocampus (closed arrows, Fig. 7C) and corpus collosum (open arrows, Fig. 7C), as was seen in MR (Fig. 4G and H). These distributions were observed in sections displaying cannula tracts and those with no visible tissue damage. Due to a more lateral infusion site in these two subjects, infusate traveled along the axis of the white matter fiber tract and was limited mediolaterally by the pyramidal cell layer and the cortex adjacent to the fiber tracts (Fig. 7C). One ventral infusion showed Evans blue in the perivascular space (Fig. 7A).
DISCUSSION
This study compared the distribution profiles of Gd-albumin in the dorsal and ventral hippocampus after CED and limited diffusion. Distribution of the contrast agent was visualized with high resolution MRI; shape and volume analysis was performed with segmentation; and validation was completed with histology, which also provided finer resolution to further elucidate the role of tissue structures on final distribution patterns. Images from histology and fluorescence microscopy were compared to MR images acquired in vivo to confirm the distribution of the infusate in hippocampal subregions. Our results demonstrate that the distribution profile and shape of the infusions are dependent upon infusion site and neuroanatomical and cytoarchitectonic structure.
Distribution profile and shape
The infusion site was a critical factor influencing distribution of the constrast agent. The ventral infusions distributed throughout the posterior dorsoventral hippocampus, while the dorsal infusion distributed throughout the anterior end to the septal pole of the hippocampus. In addition, infusion into the dorsal target site resulted in a smaller distribution area compared to the ventral site and an apparent disconnect was noted between dorsal and ventral hippocampal infusion sites.
Infusion site variability within the dorsal and ventral hippocampus also influenced the distribution profile of the infused agent. For the dorsal hippocampus infusions, variability (~1 mm) in the cannula placement within the medial-lateral/anterior-posterior plane had negligible effects on tracer distribution, as observed in both MR and fluorescence microscopy (Fig. 3). Although occurring in only one animal, variability in the depth of the cannula tip seems to have the most impact on final tracer distribution (Fig. 3D), which was most apparent in fluorescence imaging (data not shown). In this subject, the most intense fluorescence signal was seen interior to the granule cell layer of the dentate gyrus. In contrast, the most intense fluorescence signal was seen around the hippocampal fissure and CA1 subregion of the hippocampus for all other subjects. In the ventral hippocampus infusions, variability (~ 1 mm) in the depth of cannula penetration had little impact on final distributions; however, variability in the location of the cannula tip in the medial-lateral direction had a significant impact. This is seen in two subjects where infusions lateral to the targeted infusion site resulted in tracer distributing entirely within the alveus of the hippocampus and the corpus callosum (Fig. 4G and H). Since the infusion sites were stereotaxically targeted using an atlas developed from a fixed rat brain, deviations between the fixed rat brain and in vivo rat brain, anatomical variability between rats, and experimental error may contribute to variability in the infusion site.
The dorsoventral disconnect may have several explanations. Since infusions were only conducted at one volume, it is possible that the volume used was not sufficiently large enough to distribute throughout the entire hippocampus. Alternatively, anatomical “sinks” (such as ventricles or the hippocampal fissure) may “capture” a larger volume of the infusate. The fissure is a cell-free region continuous with ventricular space that is lined by pia mater and filled with CSF and blood vessels (Humphrey, 1967). It could act as a mass sink for the contrast agent, especially since Gd-albumin is able to cross pial boundaries (Jagannathan et al., 2008) Indeed, hyperintense regions were observed in the MR imaging within and surrounding the hippocampal fissure (Figs. 3 and 4), and this finding was confirmed with fluorescence imaging (Figs. 6 and 7). Although this finding may be explained by targeting, a preferential distribution into the fissure is also seen in images where the cannula tip is not positioned in the fissure (Fig. 7), indicating the contrast agent may be following the path of least resistance and collecting within the hippocampal fissure.
A third explanation for the dorsoventral disconnect may arise from the effect of differential axonal projections to, from, and between dorsal and ventral hippocampi. For example, different densities of projections have been found to the dorsal and ventral hippocampus from the entorhinal cortex (Dolorfo and Amaral, 1998; Krettek and Price, 1977), amygdala (Krettek and Price, 1977), ventral tegmental area, and locus coerulus (Haring and Davis, 1985; Verney et al., 1985). Hilar (Fricke and Cowan, 1978) and CA3 projections (Ishizuka et al., 1990; Li et al., 1994) are also coded toward specific areas of the hippocampus. These axonal structural differences likely underlie functional differences between the dorsal and ventral hippocampus (Esclassan et al., 2009; Jung et al., 1994; Moser et al., 1993) and may affect CED distribution.
This study demonstrated that neuroanatomical structure could influence CED distribution of contrast agent at the molecular level. Although contrast agent entered all subfields of the hippocampus in each subject, limited penetration was observed in the granule cell layer in the dentate and pyramidal cell layer in the CA3 and CA1. These cell layers consist of densely-packed excitatory cells that appeared as hypointense regions in the MR images (arrowheads, Figs. 3 and 4), and displayed weak or no response to fluorescence imaging (arrowheads, Figs. 6 and 7). Hydraulic conductivity describes the ease with which a fluid can move through a porous medium. In the case of densely-packed cell layers, the hydraulic conductivity would be low and permeation of the infused agent into these regions would be limited. Furthermore, the pyramidal cell layer in the CA3 of the dorsal hippocampus appeared to prevent infusate from entering the fimbria (Fig. 3), while the CA1 and CA2 pyramidal cells layers served as a boundary in the ventral hippocampus (Fig. 4). It is likely that the contrast agent traveled around these structural boundaries, along the trisynaptic circuit (Andersen et al., 1969) of the hippocampus. The trisynaptic circuit is comprised of axonal fibers connecting several subregions of the hippocampus. The hydraulic conductivity along the direction of these fibers would be lower than that perpendicular to the fiber direction leading to a preferential distribution along the trisynaptic circuit. However, further studies with in vivo dynamic contrast-enhanced MRI (DCE-MRI) are necessary to confirm this hypothesis.
It should be noted that other factors may influence the distribution patterns of agents delivered by CED into the brain parenchyma. For example, choice in cannula design and flow rate can impact the severity of backflow while the total infusion volume will ultimately influence the distribution volume and exposure of structures to the agent. In this study, flow rate and infusion volume were fixed to 0.3 μl/min and 5 μl, respectively, for all subjects. Thus, we cannot comment on how these factors would influence distributions in the hippocampus based on our results. However, it is surmised that increasing the flow rate would contribute to backflow. Backflow would also be dependent on cannula design with generally smaller diameter cannula resulting in less backflow (Morrison et al., 1999). A step-design cannula has also been proposed that has been shown to eliminate backflow at flow rates up to 5 μl/min (Krauze et al., 2005). Although this study employed the use of a small diameter cannula and low flow rate, several cases of severe backflow were observed. This backflow could be due to tissue entering the cannula tip during insertion and obstructing flow. This tissue blockage would cause the pressure in the infusion system to rise until the blockage is cleared and then a volume of infusate would be injected into the tissue at a high flow rate. Further investigations evaluating the effects of flow rate, infusion volume and cannula design on hippocampal distribution volumes are warranted.
Analysis of shape and volume
Shapes segmented from the MR images matched well the shapes of the dorsal and ventral hippocampus, suggesting that the infusate distributed throughout each region. Certain anomalies, such as severe backflow or contrast agent entering the corpus callosum, were also easily identified in the 3D segmentations. The 3D segmentations also allowed quantitative comparisons between the dorsal and ventral hippocampus infusion volumes. Assuming a brain tissue porosity of 0.2 (Mazel et al., 1998; Sykova and Nicholson, 2008) the expected distributed volume would be 25 μl. The dorsal hippocampus distribution volume calculated in this study was similar to this value; however, the volume distribution calculated in the ventral hippocampus was significantly higher than the distribution volume calculated in the dorsal hippocampus. This suggests that the ventral hippocampus may have a lower porosity than the dorsal hippocampus, or factors other than porosity may be influencing final distribution volumes. One potential factor is the proximity of the dorsal hippocampus infusions to the hippocampal fissure. Because the hippocampal fissure penetrates a larger portion of the dorsal hippocampus than the ventral hippocampus, a larger region of the dorsal hippocampus is in proximity to this mass sink. Another potential explanation for the observed difference in distribution volumes is the more compact shape of the dorsal hippocampus. Although it would be expected that the contrast agent would distribute throughout the dorsal hippocampus and then enter the ventral hippocampus, the dense pyramidal cell layer may serve as a barrier to this transport and may confine the distribution of the contrast agent to the dorsal hippocampus. The observed distribution profiles include the effects of CED and diffusion during the time delay between the final infusion and MR imaging. We estimate that the effect of diffusion may increase the measured distribution volumes by up to 40% which is equivalent to the contrast agent traveling 2–3 MR imaging voxels by diffusion during the time delay. It is important to recognize this post-infusion transport; however, the analysis of influence of hippocampal tissue architecture on CED distributions and method of image segmentation for determining final distribution volumes are still valid since both convective and diffusive extracellular transport are influenced by tissue boundaries and preferential transport routes.
To avoid observer bias, the segmentation of contrast agent distribution within the infused structures was conducted using a semi-automatic routine employing the selection of a lower-limit threshold that was set high to assure accurate segmentation. All voxels above the threshold within the infused regions of the brain were included in the segmented volumes. This lower-limit threshold was not based on a percentage of the maximum signal observed in the MR images. The absolute value of the signal in the presence of the contrast agent depends on the contrast agent relaxivity and the baseline T1 values within that particular tissue (Burtea et al., 2008; Caravan et al., 1999). Thus, establishing a threshold based solely on a percentage of the maximum observed signal is not adequate for the quantitative determination of contrast agent distribution. To establish the threshold value, the average signal was measured in the contralateral, unexposed structure. The threshold value was then set to six times the standard deviation of noise above this average signal. In order to establish a lower-limit threshold using this method, the sensitivity of the MR coil must be symmetric. Asymmetry in the sensitivity of the MR coil may erroneously alter the lower limit threshold by introducing bias in baseline signal value measurements of the contralateral, unexposed structures. In these MR measurements, the average signal-to-noise ratio (SNR) in the dorsal and ventral hippocampus was measured to be 24.2 ± 3.7 and 23.9 ± 4.7, respectively, so the coil was adequately symmetric. Also when the SNR of an MR measurement is ≫ 3, the probability distribution of the measured signal in the presence of noise makes a transition from a Rician distribution to a modified Guassian distribution (Andersen, 1996; Koay and Basser, 2006). By setting the lower-limit threshold to 6 times the standard deviation of noise above the average signal observed in contralateral structures, the threshold excludes over 99% of voxels that have a measured signal greater than the baseline value due to solely a fluctuation in noise. A similar method has been employed to establish a lower signal enhancement limit when calculating the concentration profile of a contrast agent infused into an agarose gel (Chen et al., 2008). Since the segmented volume is sensitive to the thresholding criteria, lowering the criteria would result in larger calculated infusion volumes; however, the difference between the dorsal and ventral hippocampus distribution profiles would probably not substantially change.
High-resolution MR imaging to monitor CED
In this study, MR was used to evaluate only the final contrast agent distribution patterns and volumes, rather than monitor the contrast agent distribution during infusion. Real-time monitoring of the contrast agent distribution may be used to determine the preferential path that the contrast agent would follow when distributing throughout hippocampal structures. Also, pre-infusion images would allow segmentation based on percent signal enhancement rather than the lower-limit threshold method outlined in this study. The MR coil configuration employed in this study could be improved by providing a volume coil for homogenous excitation of the brain and an array-surface coil for high-sensitivity reception of the MR signal.
High-resolution T1-weighted MR imaging was employed to observe the final distribution volume of a contrast agent infused into the dorsal and ventral hippocampus. Because the MR images were acquired at a high magnetic-field strength, SNR was sufficient for images to be obtain with an in-plane resolution of 125 μm × 125 μm with a slice thickness of 500 μm. This resolution was high enough to identify key subregions of the hippocampus, such as the granule cell layer and hippocampal fissure. Several studies have used MR to monitor CED into the rat brain in vivo. MR has been used to monitor the distribution of contrast agents, including Gd-DTPA, Gd-labelled liposomes and magnetic nanoparticles, in real-time or to evaluate final distribution profiles at field strengths used clinically, ranging from 0.5 T to 3 T (Goldberg et al., 2008; Mamot et al., 2004; Mardor et al., 2009; Mardor et al., 2005; Perlstein et al., 2008). At field strengths within this clinical range, SNR is limited and this places restrictions on the attainable image resolution. Therefore, low-field strength MR can be used to determine in vivo distribution volumes but may not be suitable for evaluating the influence of the finer tissue structure on final distribution patterns in small animal models.
CONCLUSIONS
This is the first study to observe CED delivery of MR-detectable agents into the hippocampus. Injury was limited to damages induced directly by the cannula. The observed infusate distribution did not cover the entire hippocampus, but rather distributed according to known neuroanatomic features of the hippocampus with a detailed dependence on the infusion site.
However, these results describe distributions in normally-developed hippocampi. In CNS disorders that affect the structure and/or circuitry of the hippocampus, it is reasonable to expect variability of infusate distribution. Understanding extracellular transport in complex and/or diseased regions is paramount for targeted delivery of therapeutics. When structural rearrangements in diseased hippocampi render other treatment options ineffective, targeted and predictable delivery of therapeutics via CED might provide a method for delivery. Moreover, use of MR imaging to observe distributions of therapeutic agents co-infused with contrast agents may allow targeted treatment in cases of variability in individual brain anatomy. Future studies examining the infusate distribution within the diseased hippocampus are warranted.
Acknowledgments
The project described was supported by award number R01NS063360 from the National Institute of Neurological Disorders and Stoke. The content is solely the responsibility of the authors and does not necessarily represent the official views of the National Institute Neurological Disorders and Stoke or the National Institutes of Health. We would like to thank Mansi Parekh, William Triplett and Jung Hwan Kim for stimulating discussions and Dr. Michael King and Dr. Huanxin Chen for technical assistance. The MRI data were obtained at the Advanced Magnetic Resonance Imaging and Spectroscopy facility in the McKnight Brain Institute at the University of Florida.
Footnotes
Publisher's Disclaimer: This is a PDF file of an unedited manuscript that has been accepted for publication. As a service to our customers we are providing this early version of the manuscript. The manuscript will undergo copyediting, typesetting, and review of the resulting proof before it is published in its final citable form. Please note that during the production process errors may be discovered which could affect the content, and all legal disclaimers that apply to the journal pertain.
References
- Abujudeh HH, Kaewlai R, Kagan A, Chibnik LB, Nazarian RM, High WA, Kay J. Nephrogenic systemic fibrosis after gadopentetate dimeglumine exposure: case series of 36 patients. Radiology. 2009;253:81–9. doi: 10.1148/radiol.2531082160. [DOI] [PubMed] [Google Scholar]
- Andersen AH. On the Rician distribution of noisy MRI data. Magn Reson Med. 1996;36:331–3. doi: 10.1002/mrm.1910360222. [DOI] [PubMed] [Google Scholar]
- Andersen P, Bliss TV, Lomo T, Olsen LI, Skrede KK. Lamellar organization of hippocampal excitatory pathways. Acta Physiol Scand. 1969;76:4A–5A. doi: 10.1111/j.1748-1716.1969.tb04499.x. [DOI] [PubMed] [Google Scholar]
- Auer RN, Siesjo BK. Biological differences between ischemia, hypoglycemia, and epilepsy. Ann Neurol. 1988;24:699–707. doi: 10.1002/ana.410240602. [DOI] [PubMed] [Google Scholar]
- Bertram EH. Temporal lobe epilepsy: where do the seizures really begin? Epilepsy Behav. 2009;14 (Suppl 1):32–7. doi: 10.1016/j.yebeh.2008.09.017. [DOI] [PMC free article] [PubMed] [Google Scholar]
- Burtea C, Laurent S, Vander Elst L, Muller RN. Contrast agents: magnetic resonance. Handb Exp Pharmacol. 2008:135–65. doi: 10.1007/978-3-540-72718-7_7. [DOI] [PubMed] [Google Scholar]
- Caravan P, Ellison JJ, McMurry TJ, Lauffer RB. Gadolinium(III) Chelates as MRI Contrast Agents: Structure, Dynamics, and Applications. Chem Rev. 1999;99:2293–352. doi: 10.1021/cr980440x. [DOI] [PubMed] [Google Scholar]
- Chen X, Astary GW, Sepulveda H, Mareci TH, Sarntinoranont M. Quantitative assessment of macromolecular concentration during direct infusion into an agarose hydrogel phantom using contrast-enhanced MRI. Magn Reson Imaging. 2008 doi: 10.1016/j.mri.2008.04.011. [DOI] [PMC free article] [PubMed] [Google Scholar]
- Corsellis JA, Goldberg GJ, Norton AR. “Limbic encephalitis” and its association with carcinoma. Brain. 1968;91:481–96. doi: 10.1093/brain/91.3.481. [DOI] [PubMed] [Google Scholar]
- deToledo-Morrell L, Stoub TR, Wang C. Hippocampal atrophy and disconnection in incipient and mild Alzheimer’s disease. Prog Brain Res. 2007;163:741–53. doi: 10.1016/S0079-6123(07)63040-4. [DOI] [PubMed] [Google Scholar]
- Dickson DW, Davies P, Bevona C, Van Hoeven KH, Factor SM, Grober E, Aronson MK, Crystal HA. Hippocampal sclerosis: a common pathological feature of dementia in very old (> or = 80 years of age) humans. Acta Neuropathol. 1994;88:212–21. doi: 10.1007/BF00293396. [DOI] [PubMed] [Google Scholar]
- Ding D, Kanaly CW, Bigner DD, Cummings TJ, Herndon JE, 2nd, Pastan I, Raghavan R, Sampson JH. Convection-enhanced delivery of free gadolinium with the recombinant immunotoxin MR1-1. J Neurooncol. 2009 doi: 10.1007/s11060-009-0046-7. [DOI] [PMC free article] [PubMed] [Google Scholar]
- Dolorfo CL, Amaral DG. Entorhinal cortex of the rat: topographic organization of the cells of origin of the perforant path projection to the dentate gyrus. J Comp Neurol. 1998;398:25–48. [PubMed] [Google Scholar]
- Duyckaerts C, Panchal M, Delatour B, Potier MC. Morphologic and molecular neuropathology of Alzheimer’s disease. Ann Pharm Fr. 2009;67:127–35. doi: 10.1016/j.pharma.2009.01.001. [DOI] [PubMed] [Google Scholar]
- Esclassan F, Coutureau E, Di Scala G, Marchand AR. Differential contribution of dorsal and ventral hippocampus to trace and delay fear conditioning. Hippocampus. 2009;19:33–44. doi: 10.1002/hipo.20473. [DOI] [PubMed] [Google Scholar]
- Fiandaca MS, Forsayeth JR, Dickinson PJ, Bankiewicz KS. Image-guided convection-enhanced delivery platform in the treatment of neurological diseases. Neurotherapeutics. 2008;5:123–7. doi: 10.1016/j.nurt.2007.10.064. [DOI] [PMC free article] [PubMed] [Google Scholar]
- Foley CP, Nishimura N, Neeves KB, Schaffer CB, Olbricht WL. Flexible microfluidic devices supported by biodegradable insertion scaffolds for convection-enhanced neural drug delivery. Biomed Microdevices. 2009 doi: 10.1007/s10544-009-9308-6. [DOI] [PubMed] [Google Scholar]
- Fricke R, Cowan WM. An autoradiographic study of the commissural and ipsilateral hippocampo-dentate projections in the adult rat. J Comp Neurol. 1978;181:253–69. doi: 10.1002/cne.901810204. [DOI] [PubMed] [Google Scholar]
- Goldberg L, Ocherashvilli A, Daniels D, Last D, Cohen ZR, Tamar G, Kloog Y, Mardor Y. Salirasib (farnesyl thiosalicylic acid) for brain tumor treatment: a convection-enhanced drug delivery study in rats. Mol Cancer Ther. 2008;7:3609–16. doi: 10.1158/1535-7163.MCT-08-0488. [DOI] [PubMed] [Google Scholar]
- Haring JH, Davis JN. Differential distribution of locus coeruleus projections to the hippocampal formation: anatomical and biochemical evidence. Brain Res. 1985;325:366–9. doi: 10.1016/0006-8993(85)90342-7. [DOI] [PubMed] [Google Scholar]
- Heiss JD, Walbridge S, Morrison P, Hampton RR, Sato S, Vortmeyer A, Butman JA, O’Malley J, Vidwan P, Dedrick RL, Oldfield EH. Local distribution and toxicity of prolonged hippocampal infusion of muscimol. J Neurosurg. 2005;103:1035–45. doi: 10.3171/jns.2005.103.6.1035. [DOI] [PMC free article] [PubMed] [Google Scholar]
- Humphrey T. The development of the human hippocampal fissure. J Anat. 1967;101:655–76. [PMC free article] [PubMed] [Google Scholar]
- Ishizuka N, Weber J, Amaral DG. Organization of intrahippocampal projections originating from CA3 pyramidal cells in the rat. J Comp Neurol. 1990;295:580–623. doi: 10.1002/cne.902950407. [DOI] [PubMed] [Google Scholar]
- Jagannathan J, Walbridge S, Butman JA, Oldfield EH, Lonser RR. Effect of ependymal and pial surfaces on convection-enhanced delivery. J Neurosurg. 2008;109:547–52. doi: 10.3171/JNS/2008/109/9/0547. [DOI] [PMC free article] [PubMed] [Google Scholar]
- Jung MW, Wiener SI, McNaughton BL. Comparison of spatial firing characteristics of units in dorsal and ventral hippocampus of the rat. J Neurosci. 1994;14:7347–56. doi: 10.1523/JNEUROSCI.14-12-07347.1994. [DOI] [PMC free article] [PubMed] [Google Scholar]
- Kikuchi T, Saito R, Sugiyama S, Yamashita Y, Kumabe T, Krauze M, Bankiewicz K, Tominaga T. Convection-enhanced delivery of polyethylene glycol-coated liposomal doxorubicin: characterization and efficacy in rat intracranial glioma models. J Neurosurg. 2008;109:867–73. doi: 10.3171/JNS/2008/109/11/0867. [DOI] [PubMed] [Google Scholar]
- Koay CG, Basser PJ. Analytically exact correction scheme for signal extraction from noisy magnitude MR signals. J Magn Reson. 2006;179:317–22. doi: 10.1016/j.jmr.2006.01.016. [DOI] [PubMed] [Google Scholar]
- Krauze MT, Saito R, Noble C, Tamas M, Bringas J, Park JW, Berger MS, Bankiewicz K. Reflux-free cannula for convection-enhanced high-speed delivery of therapeutic agents. J Neurosurg. 2005;103:923–9. doi: 10.3171/jns.2005.103.5.0923. [DOI] [PMC free article] [PubMed] [Google Scholar]
- Krauze MT, Vandenberg SR, Yamashita Y, Saito R, Forsayeth J, Noble C, Park J, Bankiewicz KS. Safety of real-time convection-enhanced delivery of liposomes to primate brain: a long-term retrospective. Exp Neurol. 2008;210:638–44. doi: 10.1016/j.expneurol.2007.12.015. [DOI] [PMC free article] [PubMed] [Google Scholar]
- Krettek JE, Price JL. Projections from the amygdaloid complex and adjacent olfactory structures to the entorhinal cortex and to the subiculum in the rat and cat. J Comp Neurol. 1977;172:723–52. doi: 10.1002/cne.901720409. [DOI] [PubMed] [Google Scholar]
- Lauffer RB. Paramagnetic Metal-Complexes as Water Proton Relaxation Agents for NMR Imaging - Theory and Design. Chem Rev. 1987;87:901–27. [Google Scholar]
- Li XG, Somogyi P, Ylinen A, Buzsaki G. The hippocampal CA3 network: an in vivo intracellular labeling study. J Comp Neurol. 1994;339:181–208. doi: 10.1002/cne.903390204. [DOI] [PubMed] [Google Scholar]
- Maier M, Ron MA, Barker GJ, Tofts PS. Proton magnetic resonance spectroscopy: an in vivo method of estimating hippocampal neuronal depletion in schizophrenia. Psychol Med. 1995;25:1201–9. doi: 10.1017/s0033291700033171. [DOI] [PubMed] [Google Scholar]
- Mamot C, Nguyen JB, Pourdehnad M, Hadaczek P, Saito R, Bringas JR, Drummond DC, Hong K, Kirpotin DB, McKnight T, Berger MS, Park JW, Bankiewicz KS. Extensive distribution of liposomes in rodent brains and brain tumors following convection-enhanced delivery. J Neurooncol. 2004;68:1–9. doi: 10.1023/b:neon.0000024743.56415.4b. [DOI] [PubMed] [Google Scholar]
- Mardor Y, Last D, Daniels D, Shneor R, Maier SE, Nass D, Ram Z. Convection-enhanced drug delivery of interleukin-4 pseudomonas exotoxin (PRX321): increased distribution and magnetic resonance monitoring. J Pharmacol Exp Ther. 2009;330:520–5. doi: 10.1124/jpet.109.154401. [DOI] [PMC free article] [PubMed] [Google Scholar]
- Mardor Y, Rahav O, Zauberman Y, Lidar Z, Ocherashvilli A, Daniels D, Roth Y, Maier SE, Orenstein A, Ram Z. Convection-enhanced drug delivery: increased efficacy and magnetic resonance image monitoring. Cancer Res. 2005;65:6858–63. doi: 10.1158/0008-5472.CAN-05-0161. [DOI] [PubMed] [Google Scholar]
- Mazel T, Simonova Z, Sykova E. Diffusion heterogeneity and anisotropy in rat hippocampus. Neuroreport. 1998;9:1299–304. doi: 10.1097/00001756-199805110-00008. [DOI] [PubMed] [Google Scholar]
- Morrison PF, Chen MY, Chadwick RS, Lonser RR, Oldfield EH. Focal delivery during direct infusion to brain: role of flow rate, catheter diameter, and tissue mechanics. American Journal of Physiology-Regulatory Integrative and Comparative Physiology. 1999;277:R1218–R29. doi: 10.1152/ajpregu.1999.277.4.R1218. [DOI] [PubMed] [Google Scholar]
- Moser E, Moser MB, Andersen P. Spatial learning impairment parallels the magnitude of dorsal hippocampal lesions, but is hardly present following ventral lesions. J Neurosci. 1993;13:3916–25. doi: 10.1523/JNEUROSCI.13-09-03916.1993. [DOI] [PMC free article] [PubMed] [Google Scholar]
- Nelson MD, Saykin AJ, Flashman LA, Riordan HJ. Hippocampal volume reduction in schizophrenia as assessed by magnetic resonance imaging: a meta-analytic study. Arch Gen Psychiatry. 1998;55:433–40. doi: 10.1001/archpsyc.55.5.433. [DOI] [PubMed] [Google Scholar]
- Ohm TG. The dentate gyrus in Alzheimer’s disease. Prog Brain Res. 2007;163:723–40. doi: 10.1016/S0079-6123(07)63039-8. [DOI] [PubMed] [Google Scholar]
- Olson JJ, Zhang Z, Dillehay D, Stubbs J. Assessment of a balloon-tipped catheter modified for intracerebral convection-enhanced delivery. J Neurooncol. 2008;89:159–68. doi: 10.1007/s11060-008-9612-7. [DOI] [PubMed] [Google Scholar]
- Paxinos G, Watson C. The Rat Brain in Sterotaxic Coordinates. 4. Academic Press; San Diego: 1998. [Google Scholar]
- Perlstein B, Ram Z, Daniels D, Ocherashvilli A, Roth Y, Margel S, Mardor Y. Convection-enhanced delivery of maghemite nanoparticles: Increased efficacy and MRI monitoring. Neuro Oncol. 2008;10:153–61. doi: 10.1215/15228517-2008-002. [DOI] [PMC free article] [PubMed] [Google Scholar]
- Raghavan R, Brady ML, Rodriguez-Ponce MI, Hartlep A, Pedain C, Sampson JH. Convection-enhanced delivery of therapeutics for brain disease, and its optimization. Neurosurg Focus. 2006;20:E12. doi: 10.3171/foc.2006.20.4.7. [DOI] [PubMed] [Google Scholar]
- Rogawski MA. Convection-enhanced delivery in the treatment of epilepsy. Neurotherapeutics. 2009;6:344–51. doi: 10.1016/j.nurt.2009.01.017. [DOI] [PMC free article] [PubMed] [Google Scholar]
- Sampson JH, Brady ML, Petry NA, Croteau D, Friedman AH, Friedman HS, Wong T, Bigner DD, Pastan I, Puri RK, Pedain C. Intracerebral infusate distribution by convection-enhanced delivery in humans with malignant gliomas: descriptive effects of target anatomy and catheter positioning. Neurosurgery. 2007;60:ONS89-98. doi: 10.1227/01.NEU.0000249256.09289.5F. discussion ONS-9. [DOI] [PubMed] [Google Scholar]
- Song DK, Lonser RR. Convection-enhanced delivery for the treatment of pediatric neurologic disorders. J Child Neurol. 2008;23:1231–7. doi: 10.1177/0883073808321064. [DOI] [PMC free article] [PubMed] [Google Scholar]
- Sykova E, Nicholson C. Diffusion in brain extracellular space. Physiol Rev. 2008;88:1277–340. doi: 10.1152/physrev.00027.2007. [DOI] [PMC free article] [PubMed] [Google Scholar]
- Tao L, Nicholson C. Diffusion of albumins in rat cortical slices and relevance to volume transmission. Neuroscience. 1996;75:839–47. doi: 10.1016/0306-4522(96)00303-x. [DOI] [PubMed] [Google Scholar]
- Tate DF, Bigler ED. Fornix and hippocampal atrophy in traumatic brain injury. Learn Mem. 2000;7:442–6. doi: 10.1101/lm.33000. [DOI] [PubMed] [Google Scholar]
- Verney C, Baulac M, Berger B, Alvarez C, Vigny A, Helle KB. Morphological evidence for a dopaminergic terminal field in the hippocampal formation of young and adult rat. Neuroscience. 1985;14:1039–52. doi: 10.1016/0306-4522(85)90275-1. [DOI] [PubMed] [Google Scholar]