

Abstract
Objective:
To determine if posttraumatic nonconvulsive electrographic seizures result in long-term brain atrophy.
Methods:
Prospective continuous EEG (cEEG) monitoring was done in 140 patients with moderate to severe traumatic brain injury (TBI) and in-depth study of 16 selected patients was done using serial volumetric MRI acutely and at 6 months after TBI. Fluorodeoxyglucose PET was done in the acute stage in 14/16 patients. These data were retrospectively analyzed after collection of data for 7 years.
Results:
cEEG detected seizures in 32/140 (23%) of the entire cohort. In the selected imaging subgroup, 6 patients with seizures were compared with a cohort of 10 age- and GCS-matched patients with TBI without seizures. In this subgroup, the seizures were repetitive and constituted status epilepticus in 4/6 patients. Patients with seizures had greater hippocampal atrophy as compared to those without seizures (21 ± 9 vs 12 ± 6%, p = 0.017). Hippocampi ipsilateral to the electrographic seizure focus demonstrated a greater degree of volumetric atrophy as compared with nonseizure hippocampi (28 ± 5 vs 13 ± 9%, p = 0.007). A single patient had an ictal PET scan which demonstrated increased hippocampal glucose uptake.
Conclusion:
Acute posttraumatic nonconvulsive seizures occur frequently after TBI and, in a selected subgroup, appear to be associated with disproportionate long-term hippocampal atrophy. These data suggest anatomic damage is potentially elicited by nonconvulsive seizures in the acute postinjury setting.
GLOSSARY
- cEEG
= continuous EEG;
- FLAIR
= fluid-attenuated inversion recovery;
- GCS
= Glasgow Coma Scale score;
- GRE
= gradient recalled echo;
- ICU
= intensive care unit;
- TBI
= traumatic brain injury.
Neurologic critical care of traumatic brain injury (TBI) focuses on avoiding secondary insults.1 Posttraumatic seizures occur frequently in the intensive care unit2 and constitute a potentially serious secondary injury. Posttraumatic seizures occur more frequently in patients with severe TBI and in patients with traumatic parenchymal hemorrhage. Early seizures in the intensive care unit also occur frequently in nontraumatic brain hemorrhage, such as intracerebral hemorrhage and subarachnoid hemorrhage.3,4 Posttraumatic seizures have previously been associated with disturbed brain metabolism5,6 and evidence of secondary excitotoxicity.7 However, it is presently unclear whether posttraumatic seizures result in any long-term adverse consequences for the patient. This has resulted in uncertainty about how to monitor for and treat seizures.8,9
Given this uncertainty, we prospectively planned to study the long-term tissue effects of electrographic posttraumatic seizures in a cohort of patients with TBI monitored by continuous EEG (cEEG). The primary hypothesis was that nonconvulsive electrographic seizures result in selective atrophy of the hippocampus ipsilateral to the seizure focus. The secondary hypothesis was that electrographic seizures result in an increase in glucose metabolism of the hippocampus, as compared with the posttraumatic nonseizure state.
METHODS
Patient selection.
The study was approved by our medical institutional review board. A total of 140 patients with TBI (Glasgow Coma Scale score [GCS] 3–12) underwent cEEG in 2000–2007. Thirty-two of these had electrographic seizures (32/140 or 23%). From 2004–2007, we studied 50 (50/140) patients with TBI with both cEEG and acute MRI, of which 29/140 had acute and chronic volumetric MRI, and 14/140 had cEEG, MRI, and PET. This is a convenience study of a selected subgroup of all monitored patients. Of the 29 with both acute and chronic MRI, 6/29 (21%) of these patients had seizures and were compared with 10 matched patients without seizures, based on age, CT lesion, and initial GCS.
Standard protocol approvals and patient consents.
This study received approval from the UCLA Office for Protection of Human Subjects. Written informed consent was obtained for each participant through surrogate consent by closest next of kin following state regulations.
General management protocol.
Our general management protocol has been previously published.2 Intracranial pressure was kept below 20 mm Hg in all patients. Jugular venous oximetry (SJO2) was performed and cerebral perfusion pressure kept at >60 mm Hg. All patients received phenytoin for at least 7 days. None of the patients studied received IV or oral steroids. IV sedation consisted of continuous midazolam (2–6 mg/hour) and morphine (1–4 mg/hour) titrated to achieve intracranial pressures <20 mm Hg or Ramsay Scale <3. The seizure group was found to have similar average daily dose and cumulative dose of midazolam prior to seizure onset as compared with the nonseizure group.
Continuous EEG protocol.
EEG was continuously monitored at the patient's bedside starting immediately upon admission to the intensive care unit (ICU) for patients with visible TBI on imaging.2 The cEEG was continuously displayed at the bedside, 24 hours per day, for moment-to-moment on-line observation. A 14-channel, 12-electrode montage was used employing the following electrode derivations: F4-CZ, T4-CZ, P4-CZ, O2-CZ, F3-CZ, T3-CZ, P3-CZ, O1-CZ, F4-T4, T4-P4, P4-O2, F3-T3, T3-P3, P3-O1.
Seizures were detected in 1 of 3 ways: on-line identification of seizures by the neuro-ICU nurse or neurointensivist, by the total or α power trend surge seizure detection method, or by detection during the EEG screening by the neurointensivist. A bedside printed seizure-detection template was used by the nurses. The date and time of the seizure and the clinical behavior was noted. The total power or α power trend surge seizure detection method is done as follows: The EEG was converted in real-time using the fast-Fourier method to generate several quantitative parameters once every minute, namely the percentage α and the total power band widths of the EEG. These power trends are displayed as a continuous linear histogram. The histogram is trended and displayed at the bedside. We have observed that seizures may result in an increase in the α power or total power. We routinely review the power trend for surges of greater than 15% above the baseline mean trend, and then drill down into the raw EEG that corresponds to the surge in power of the trend to review the raw EEG to determine if a seizure has occurred. Each seizure was independently confirmed by an independent physician blinded to the clinical condition (P.V.). Seizure type was characterized as focal, hemispheric, or generalized according to the EEG at time of onset. The duration of individual seizures were recorded along with the total (aggregate) duration of seizures during the ICU stay. Status epilepticus was defined as the persistence of discretely interrupted or continuous electrographic seizure spike-wave discharges lasting for longer than 10 minutes.
PET methods.
Of the 16 matched subjects who were intensively studied, 14/16 patients underwent PET imaging during the initial 7 days after brain injury, and 11/16 had both oxygen and glucose PET imaging protocol. Not all patients consented to the PET, hence there is an incomplete dataset. Four patients of the seizure group and 10 patients of the nonseizure group underwent this PET imaging. PET was performed using a quantitative method as previously described.10 The glucose and oxygen O-15 PET scans (C15O, O15O, H215O) were performed using dynamic blood sampling to determine regional measures of metabolism and blood flow.10 Global, gray matter, and hippocampal regions were measured.
Volumetric analysis of brain atrophy.
All 16 subjects underwent volumetric MRI T1 imaging using a standard magnetization-prepared gradient echo (repetition time 1,900 msec, echo time 3.5 msec, field of view 256 × 256, 1-mm slice thickness) diffusion tensor imaging, gradient recalled echo (GRE), diffusion tensor imaging (apparent diffusion coefficient), and fluid-attenuated inversion recovery (FLAIR) sequences on a 1.5-T Siemens MRI system within 2 weeks after brain injury and again at 6 months after injury. Volumetric imaging was then processed through an automated pipeline approach that extracts the brain volumes from the background skull tissues and registers the image in an atlas space.11 Two radiology scorers, who were blinded to the clinical diagnosis of seizures, used a hand-drawing tool to measure the global brain volumes and hippocampal volumes according to a standardized anatomic landmark protocol.12 Kappa showed acceptable scoring agreement (0.9). Regions of brain hemorrhagic contusion were excluded from the volumetric measures using FLAIR and GRE coregistered images for reference.
Event tracking and outcome assessment.
The bedside nurse and research team maintained a detailed patient event log.10 As previously described,13 we tracked patients for 6 months and performed the Glasgow Outcome Score Extended and Disability Rating Scale assessments during in-person evaluation of patients at 6 months.
Data analysis.
Data acquisition was performed using Microsoft Office products 2003 (Microsoft Corp., Redmond, WA), while statistical procedures were conducted with R version 2.10.0 (R Development Core Team, 2009, Vienna, Austria). Univariate analyses were performed for the main variables comparing the seizure and nonseizure groups using analysis of variance and mixed effects model statistics as necessary.
RESULTS
For the overall group, 32/140 (23%) patients with TBI had seizures. Twenty-nine patients with complete EEG and volumetric MRI data were intensively studied. Six of 29 patients had electrographic seizures and 10/29 patients were selected from the overall cohort of 29 patients based on age, GCS, and CT lesion matching. Table e-1 on the Neurology® Web site at www.neurology.org outlines the comparison between these 2 groups. The 2 groups were matched with respect to the types of brain lesions seen on CT, GCS (6.7 ± 1.2 vs 5.9 ± 1.9, paired t test, p = 0.38), and the occurrence of surgery. Overall, as compared with the 6 intensively studied seizure patients, the remaining 26/32 patients with seizures from the large cohort were similar in age (50 ± 23 years vs 35 ± 4 years, p = 0.29), GCS scores (5.6 ± 2 vs 6.7 ± 1.2, p = 0.19), and CT lesion profile type (66% vs 70% diffuse axonal injury).
Seizure characteristics.
In the selected subgroup of 6/29 seizure patients, the mean time of seizures after injury was at 85 ± 7 hours postinjury. However, there was a bimodal distribution of the timing of seizures, with an early peak seizure period, at 29 ± 14 hours, and the later peak seizure period occurring at a mean of 140 ± 15 hours after injury. There were multiple seizures per patient. All seizures were nonconvulsive with no apparent motor signs of seizures. Four patients were categorized as having status epilepticus, since they demonstrated discrete seizures plus waxing-waning periodic epileptiform discharges lasting greater than 10 minutes. The mean duration of an individual seizure was 2.8 ± 1.2 minutes. The duration of status epilepticus prior to seizure abolition was 41 ± 7.5 minutes. The remaining 2 patients had only discrete seizures. The seizures frequently were clustered and occurred over a several hour period prior to stopping. The seizures were focal in origin, more frequent on the right hemisphere, and had secondary generalization in 78% of cases. The timing and duration of the seizures were similar to the larger cohort of 29 seizure patients.
All patients were given phenytoin 300 mg once per day, with supplemental boluses if the trough phenytoin level was <10 mg/dL for at least 7 days. The seizure group had a higher mean phenytoin level compared with the nonseizure group (16.7 ± 9.5 vs 11.1 ± 2.8 mg/dL). However, the nonseizure group experienced more frequent subtherapeutic trough phenytoin levels than the seizure group. Once seizures were identified, lorazepam or midazolam was administered in bolus dose and a phenytoin bolus of 500 mg was administered. In the 4 patients with status epilepticus, continuous infusions of midazolam (3) and subsequently pentobarbital (2) were used to control seizures. In each case, the continuous infusions were titrated to achieve suppression of seizure activity, which uniformly required induction of a burst suppression pattern on the EEG. In all 4 of these patients, levetiracetam was added at 3,000–4,000 mg/day in 2 divided doses. All patients with seizures were discharged on anticonvulsants, and were kept on anticonvulsants for the 6 months of follow up.
PET imaging characteristics.
Four seizure and 10 nonseizure patients (14/16 overall) had PET imaging performed within 5 days after TBI. PET imaging consisted of quantitative imaging for metabolic rates of glucose metabolism, oxidative metabolism, and cerebral blood flow. Regional hippocampal as well as global rates of metabolism and cerebral blood flow were obtained using region of interest methods.10 A single patient had PET during a nonconvulsive seizure, and in 3 seizure patients, the PET study was done during an interictal state. These results are shown in figure 1. Regional increase in glucose uptake occurred in the right hippocampus during the single ictal PET study (6.9 mg/100 mg/min) and was significantly greater than either the interictal (2.93 ± 1.1 mg/100 mg/min) or nonictal rates (3.5 ± 0.8 mg/100 mg/min, p < 0.01). In contrast, the rates of regional hippocampal oxidative metabolism and cerebral blood flow did not differ between the ictal and interictal states, or nonseizure states. Global rates glucose metabolism, oxidative metabolism, and cerebral blood flow did not differ between the interictal seizure group and nonseizure group.
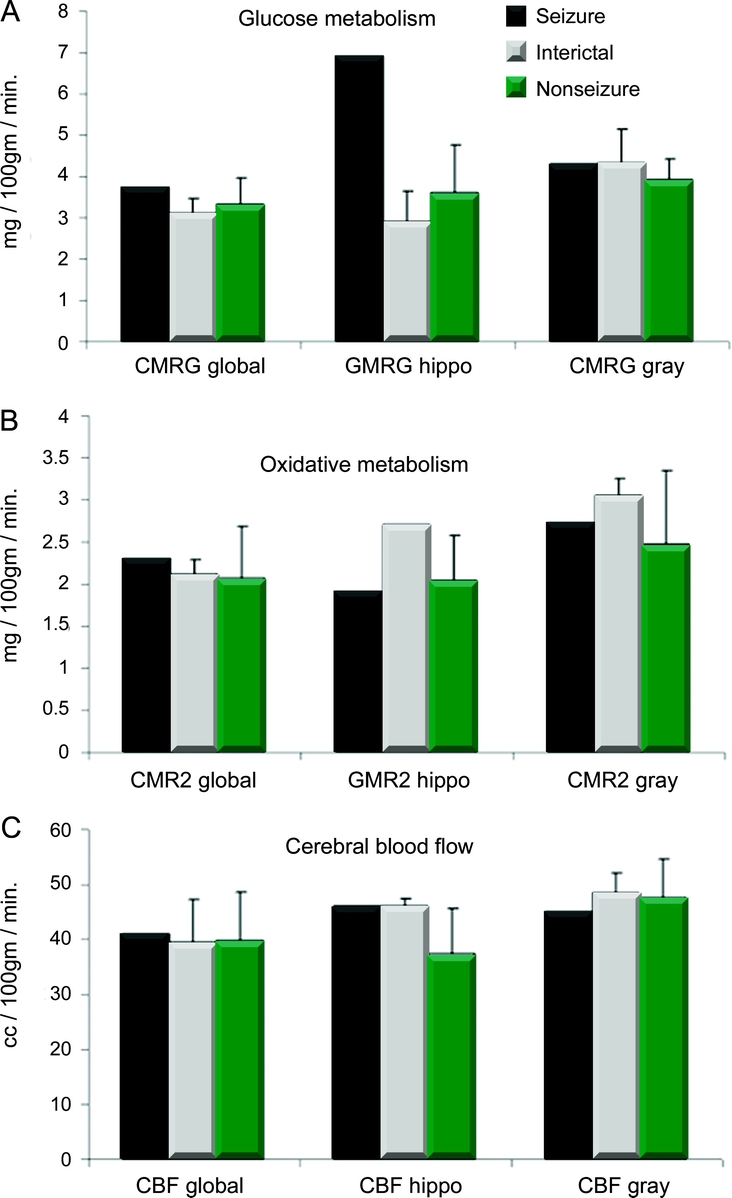
Figure 1 Comparison of the PET images for 1 patient seizing during PET (ictal), the interictal state in the seizure group, and nonseizure group
The global brain metabolism in each group is compared with the regional metabolism in the hippocampus (hippo). (A) Glucose metabolism (mg/100 mg/min); (B) oxidative metabolism (mg/100 mg/min); (C) cerebral blood flow (cc/100 mg/min). The seizure PET shows regionally increased glucose metabolism in the absence of an increase in blood flow or oxidative metabolism.
MRI injury and atrophy characteristics.
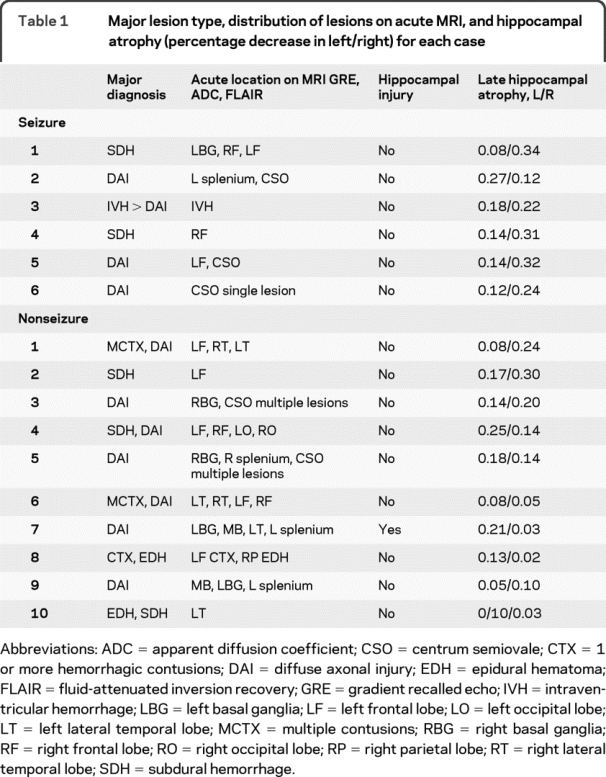
On the acute comprehensive imaging survey for primary tissue damage to the brain, including the hippocampi, the patterns of traumatic lesions were similar between seizure and nonseizure patients. Table 1 outlines the locations of the injuries. One seizure patient demonstrated lateral temporal lobe hemorrhage, and 1 seizure patient demonstrated postictal FLAIR hyperintensity in the hippocampus on acute imaging. One nonseizure patient had evidence of left hippocampal hemorrhage on GRE. The remainder of the seizure and nonseizure patients had no primary hippocampal injury noted on apparent diffusion coefficient, GRE, or FLAIR imaging. Diffuse axonal injury of varying degrees was evident on 4/6 seizure patients and 7/10 nonseizure patients. The cumulative number and regional distribution of traumatic lesions was similar between the seizure and nonseizure groups.
Table 1 Major lesion type, distribution of lesions on acute MRI, and hippocampal atrophy (percentage decrease in left/right) for each case
On the 6-month MRI, global brain atrophy was similar between the seizure and nonseizure group (8 ± 5% vs 8 ± 3%, p = 0.91). By comparison, the percentage atrophy of the ipsilateral hippocampus was more than 2 times greater for the seizure group as compared with the nonseizure group (28 ± 5 vs 13 ± 9%, p = 0.007) (table 2). Seizure patients also had a greater extent of average hippocampal percentage atrophy as compared with the nonseizure group (21 ± 9 vs 12 ± 6%, p = 0.017) (figure 2). The extent of hippocampal atrophy was not associated with acute damage to the hippocampal structure on the initial MRI scan. Exploratory univariate analysis did not reveal an association between hippocampal atrophy and selected vital signs such as intracranial pressure, blood pressure, initial GCS, or initial injury burden, as indicated by the number of brain hemorrhages on initial MRI GRE sequence. A case example of hippocampal atrophy is shown in the patient whose seizure was captured during the PET scan (subject 4) (figure 3). The hippocampus ipsilateral to the seizure is asymmetrically atrophied in comparison with the remainder of the brain. Our dataset was too small to determine if the duration of seizure activity correlated with the extent of brain atrophy, although 4/6 patients had prolonged seizure activity.
Table 2 Global and hippocampal brain atrophy by group
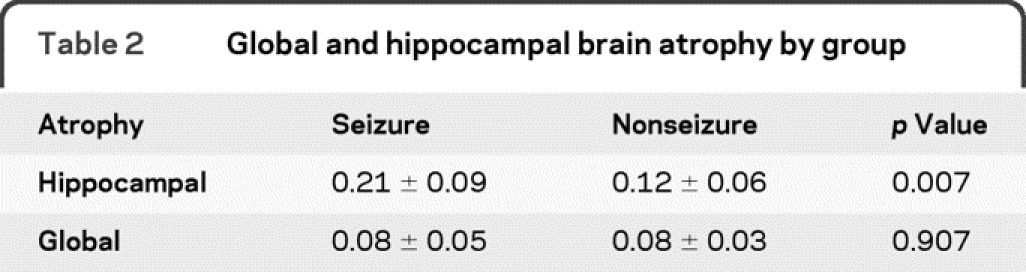

Figure 2 Long-term brain atrophy in hippocampal regions are shown for the seizure and nonseizure groups
Bars are labeled by group (seizure, black; nonseizure, white) and by hippocampus location (right, left, ipsilateral or contralateral to the EEG seizure focus). There is greatest hippocampal atrophy in the seizure patients' hippocampi ipsilateral to the EEG seizure focus. The right hemisphere was ipsilateral to seizures more commonly than the left. Late hippo atrophy = percentage atrophy at 6 months as compared with the acute image.

Figure 3 Hippocampal atrophy ipsilateral to the seizure focus
Composite of acute PET scan and acute and chronic MRI volumetric scans on seizure subject 4. The patient has increased glucose metabolism in the right hippocampus without a similar increase in CMRO2. The hyperintensity on the fluid-attenuated inversion recovery (FLAIR) sequence was due to acute seizure activity and not traumatic hemorrhage. MRI at 6 months shows right hippocampal atrophy and also right temporal lobe atrophy. CMRO2 = oxidative metabolism PET; FDG = fluorodeoxyglucose PET; PIH = postinjury hour.
Outcome.
At 1 year after trauma, 2/6 original seizure patients had recurrent seizures during the follow-up but all were kept on an anticonvulsant. In contrast, none of the nonseizure patients had delayed seizures and none were kept on anticonvulsants. At 6 months, the seizure and nonseizure groups had similar global outcomes, as reflected by the mean Glasgow Outcome Score Extended scores (6 ± 1.3 vs 5.1 ± 1.3, p = 0.19) and the mean Disability Rating Scale scores (1.8 ± 2.1 vs 4.1 ± 2.6, p = 0.09).
DISCUSSION
The principal finding of this study is that early electrographic seizures appear to be associated with long-term selective ipsilateral hippocampal atrophy and to a lesser extent contralateral hippocampal atrophy without a net effect on global brain atrophy. We also report an interesting case example of an increase in glucose utilization regionally in the hippocampus that later demonstrates atrophy. These results are important since they add support to a long held but previously unsupported premise that posttraumatic electrographic nonconvulsive seizures are deleterious for patients with TBI.
The incidence of posttraumatic seizures has been debated over the past 2 decades.11 These studies focused on clinical seizure activity and did not use cEEG monitoring to define seizures. In contrast, we reported a 22% incidence rate of seizures when detailed, prospective cEEG monitoring of patients with TBI in the ICU was used.2 Over the last decade, a consistently high (20%–30%) incidence of electrographic seizures have been reported in TBI, intracerebral hemorrhage,4 and subarachnoid hemorrhage.3,9 In most studies, over 50% of seizures in the ICU are nonconvulsive. The occurrence of prolonged status epilepticus after trauma is associated with an increased mortality.2 Given these reports, cEEG is becoming more commonly used in neurointensive care units but an important unanswered question is whether these nonconvulsive seizures have any pathophysiologic significance. In this article, we attempted to provide anatomic evidence that nonconvulsive seizures have pathophysiologic significance.
In recent TBI studies, we have demonstrated that posttraumatic nonconvulsive seizures lead to prolonged excitoxicity7 and elevation in a microdialysis marker of metabolic distress, called the lactate/pyruvate ratio.14 Lactate/pyruvate ratio elevation suggests increased nonoxidative metabolism, namely increased glucose metabolism. The isolated ictal PET study demonstrates that regional hippocampal glucose metabolism is increased on PET imaging, with the hippocampus ipsilateral to the seizure focus affected most. This single ictal PET study was similar to previous reports of increased glycolysis in TBI.5
On delayed MRI, we saw disproportionate dose-response-like hippocampal atrophy which was in the ipsilateral hippocampus, less in the contralateral hippocampus, and least in nonseizure patients. In a rodent model of induced posttraumatic seizures, a similar increase in glucose metabolism and subsequent selective hippocampal atrophy was found.6 Hence, we see similar metabolic and long-term atrophy relationships between the experimental model and the human TBI state.
It is important to note that global and hippocampal atrophy typically does not occur within the span of 6 months in normal subjects15 but can occur after status epilepticus.16 This extent of hippocampal atrophy rarely occurs in recently recognized epilepsy syndromes. Instead chronic epilepsy takes years to result in atrophy of this magnitude.17 While none of our patients report having developed chronic epilepsy during the follow-up period, it remains uncertain if nonconvulsive seizures continued into the chronic period, since chronic EEG monitoring was impractical. Thus, the extent of atrophy appears to be a function of the interaction between trauma and acute seizure activity. The mechanism of this interaction is not clear. We speculate that the posttraumatic hippocampus cannot sustain an increased metabolic load that is required by seizure activity or that the secondary increase in excitatory amino acids, such as glutamate, results in cell death in vulnerable hippocampal neurons.
The sample size is small and there is potential for bias in data acquisition and volume measurements. The acute brain edema that follows TBI may have affected our atrophy measures,18 but acute brain imaging did not reveal a disproportionate amount of edema in the hippocampus in the seizure group. It is not clear what effects, if any, the duration of seizure and the acute abortive treatment played on the mitigation of hippocampal atrophy. The seizure group may have been more severely injured and hence the hippocampal atrophy might be a reflection of this, but we should have seen more global atrophy as well. MRI lesion types, number, and distribution, as well as the global outcome scores, were similar between the seizure and nonseizure groups. Thus, while our findings are not definitive proof of selective seizure-related damage to the hippocampus, the finding of disproportionate hippocampal atrophy suggests that seizures elicit specific long-term anatomic consequences.
The present study suggests that early posttraumatic seizures are associated with hippocampal atrophy. Combined with our previous work7,12 showing that seizures result in metabolic perturbation and elevated intracranial pressure, the current findings add support to the concept that acute posttraumatic seizures cannot be considered benign. Posttraumatic seizures occur in nearly one-quarter of patients with severe TBI and may be a specific therapeutic target with cEEG potentially helpful in this process.
DISCLOSURE
Dr. Vespa has served as a consultant for General Electric and Neuren Pharmaceuticals Limited; estimates that 2% of his clinical effort is spent on EEG monitoring; receives research support from the NIH (NINDS RO1 NS 049471 [principal investigator]); owns stock in InTouch Health; and has given expert testimony in brain trauma cases. Dr. McArthur has received research support from the NIH (NINDS 1 RO1 NS049471 [Key Investigator]). Dr. Xu, M. Eliseo, M. Etchepare, and Dr. Dinov report no disclosures. Dr. Alger serves on the editorial board of Magnetic Resonance Imaging; has served as a consultant for MedQIA and Carrot Capital/Remedy Pharmaceuticals; and receives/has received research support from the NIH (NIBIB R01 EB00822 [coinvestigator], NINDS P50 NS044378 [coinvestigator], NINDS R01 NS036524 [coinvestigator], NINDS R01 NS049471 [coinvestigator], NINDS/NMSS R01 NS051591/RG3915 [coinvestigator], NIMH R01MH081864 [coinvestigator], NIMH R21 MH075658 [coinvestigator], NINDS R01 NS46018 [coinvestigator], NHLBI P50 HL60296 [coinvestigator], NEI RO1 EY15311 [coinvestigator], NINR RO1 NR009116 [coinvestigator]) and the US Department of Defense (DOD W81XWH-08-2-0699 [coinvestigator]). Dr. Glenn receives research support from the NIH (NINDS 1R21NS057252-01A1 [PI]). Dr. Hovda serves on the editorial boards of Developmental Brain Dysfunction, Restorative Neurology and Neuroscience, the Journal of Neurotrauma, the Journal of Cerebral Blood Flow & Metabolism, Developmental Neurorehabilitation, and Eye and Brain; receives/has received research support from the NIH (1 P01 NS 058489-01 [coinvestigator], 1 R21 NS057252-01A1 [PI], 1 R01 NS27544 [coinvestigator], 1 R01 NS055910-01A1 [coinvestigator], R01 NS 49471 [coinvestigator], and 1 R01 NS052406 [principal investigator]); and serves as Program Director, UCLA Brain Injury Research Center University of California.
Supplementary Material
Address correspondence and reprint requests to Dr. Paul M. Vespa, Ronald Reagan UCLA Medical Center, 757 Westwood Blvd., Room 63236A, Los Angeles, CA 90095 Pvespa@mednet.ucla.edu
Editorial, page 760
Supplemental data at www.neurology.org
Study funding: Supported by NIH/NINDS (NS 02089, NS 049471) and the State of California Neurotrauma Initiative.
Disclosure: Author disclosures are provided at the end of the article.
Received October 6, 2009. Accepted in final form March 3, 2010.
REFERENCES
- 1.Vincent JL, Berre J. Primer on medical management of severe brain injury. Crit Care Med 2005;33:1392–1399. [DOI] [PubMed] [Google Scholar]
- 2.Vespa PM, Nuwer MR, Nenov V, et al. Increased incidence and impact of nonconvulsive and convulsive seizures after traumatic brain injury as detected by continuous EEG in the intensive care unit. J Neurosurg 1999;91:750–760. [DOI] [PMC free article] [PubMed] [Google Scholar]
- 3.Claassen J, Mayer SA, Kowalski RG, Emerson RG, Hirsch LJ. Detection of electrographic seizures with continuous EEG monitoring in critically ill patients. Neurology 2004;62:1743–1748. [DOI] [PubMed] [Google Scholar]
- 4.Vespa P, O'Phelan K, Mirabelli J, et al. Acute seizures after intracerebral hemorrhage: A factor in progressive midline shift and outcome. Neurology 2003;60:1441–1446. [DOI] [PubMed] [Google Scholar]
- 5.Bergsneider MA, Hovda DA, Shalmon E, et al. Cerebral hyperglycolysis following severe human traumatic brain injury: a positron emission tomography study. J Neurosurg 1997;86:241–251. [DOI] [PubMed] [Google Scholar]
- 6.Roncati Zanier E, Lee SM, Vespa PM, Giza CC, Hovda DA. Increased hippocampal CA3 vulnerability to low-level glutamate analogue following lateral fluid percussion injury. J Neurotrauma 2003;20:409–420. [DOI] [PubMed] [Google Scholar]
- 7.Vespa P, Prins M, Ronne-Engstrom E, et al. Increase in extracellular glutamate caused by reduced cerebral perfusion pressure and seizures after human traumatic brain injury: a microdialysis study. J Neurosurg 1998;89:971–982. [DOI] [PubMed] [Google Scholar]
- 8.Temkin NR. Prophylactic anticonvulsants after neurosurgery. Epilepsy Curr 2002;4:105–107. [DOI] [PMC free article] [PubMed] [Google Scholar]
- 9.Vespa P. EEG for the detection of seizures in traumatic brain injury, infarction and intracerebral hemorrhage: “to detect and protect.” J Clin Neurophysiol 2004;20:99–106. [DOI] [PubMed] [Google Scholar]
- 10.Vespa P, Bergsneider M, Hattori N, et al. Metabolic crisis without brain ischemia is common after traumatic brain injury: a combined microdialysis and positron emission tomography study. J Cereb Blood Flow Metab 2005;25:763–774. [DOI] [PMC free article] [PubMed] [Google Scholar]
- 11.Dinov I, Van Horn JD, Lozev KM, et al. Efficient, distributed and interactive neuroimaging data analysis using the LONI Pipeline. Front Neuroinform 2009;3:22. [DOI] [PMC free article] [PubMed] [Google Scholar]
- 12.Wilde EA, Bigler ED, Hunter JV, et al. Hippocampus, amygdala, and basal ganglia morphometrics in children after moderate-to-severe traumatic brain injury. Dev Med Child Neurol 2007;49:294–299. [DOI] [PubMed] [Google Scholar]
- 13.Vespa P, McArthur DL, Glenn T, et al. Persistently reduced levels of extracellular glucose early after traumatic brain injury correlate with poor outcome at six months: a microdialysis study. J Cereb Blood Flow Metab 2003;23:865–877. [DOI] [PubMed] [Google Scholar]
- 14.Vespa PM, Miller C, McArthur D, et al. Nonconvulsive electrographic seizures after traumatic brain injury result in a delayed, prolonged increase in intracranial pressure and metabolic crisis. Crit Care Med 2007;35:1–7. [PMC free article] [PubMed] [Google Scholar]
- 15.Liu RS, Lemieux L, Bell GS, et al. Cerebral damage in epilepsy: a population-based longitudinal quantitative MRI study. Epilepsia 2005;46:1482–1494. [DOI] [PubMed] [Google Scholar]
- 16.Parmar H, Lim SH, Tan NC, Lim CC. Acute symptomatic seizures and hippocampus damage: DWI and MRS findings. Neurology 2006;66:1732–1735. [DOI] [PubMed] [Google Scholar]
- 17.Salmenperä T, Kälviäinen R, Partanen K, Pitkänen A. Quantitative MRI volumetry of the entorhinal cortex in temporal lobe epilepsy. Seizure 2000;9:208–215. [DOI] [PubMed] [Google Scholar]
- 18.Marcoux J, McArthur DL, Miller C, et al. Persistent metabolic crisis as measured by elevated cerebral microdialysis lactate-pyruvate ratio predicts chronic frontal lobe brain atrophy after traumatic brain injury. Crit Care Med 2008;36:2871–2877. [DOI] [PubMed] [Google Scholar]
Associated Data
This section collects any data citations, data availability statements, or supplementary materials included in this article.