


Abstract
Objective:
This observational cohort study investigated the seasonal prevalence of multiple sclerosis (MS) disease activity (likelihood and intensity), as reflected by new lesions from serial T2-weighted MRI, a sensitive marker of subclinical disease activity.
Methods:
Disease activity was assessed from the appearance of new T2 lesions on 939 separate brain MRI examinations in 44 untreated patients with MS. Likelihood functions for MS disease activity were derived, accounting for the temporal uncertainty of new lesion occurrence, individual levels of disease activity, and uneven examination intervals. Both likelihood and intensity of disease activity were compared with the time of year (season) and regional climate data (temperature, solar radiation, precipitation) and among relapsing and progressive disease phenotypes. Contrast-enhancing lesions and attack counts were also compared for seasonal effects.
Results:
Unlike contrast enhancement or attacks, new T2 activity revealed a likelihood 2–3 times higher in March–August than during the rest of the year, and correlated strongly with regional climate data, in particular solar radiation. In addition to the likelihood or prevalence, disease intensity was also elevated during the summer season. The elevated risk season appears to lessen for progressive MS and occur about 2 months earlier.
Conclusion:
This study documents evidence of a strong seasonal pattern in subclinical MS activity based on noncontrast brain MRI. The observed seasonality in MS disease activity has implications for trial design and therapy assessment. The observed activity pattern is suggestive of a modulating role of seasonally changing environmental factors or season-dependent metabolic activity.
GLOSSARY
- CEL
= contrast-enhancing lesions;
- MS
= multiple sclerosis.
This study tested the hypothesis that untreated multiple sclerosis (MS) disease activity, as observed by new lesions on noncontrast MRI, is not uniformly distributed over the calendar year, but shows greater prevalence during a particular season. Patterns of such seasonal variation have been observed mostly for clinical markers, with peaks in exacerbation rates during summer for the United States (Ohio,1 Arizona2) and Japan,3 and during the spring in Switzerland.4 A study of seasonal prevalence of optic neuritis in Sweden found higher incidence in spring than winter and correlations of incidence rates with solar radiation and temperature.5 Significant seasonal variation of immunologic activity was found by 2 studies in Boston and Amsterdam, with peaking concentrations of proinflammatory cytokines interferon-γ and tumor necrosis factor–α in autumn.6,7 Similarly, the immunosuppressive cytokine interleukin-10 was found to be elevated in the summer months in Australia.8
On MRI, however, studies are very rare and findings elusive. Out of only 3 studies looking at MRI markers,9-11 one found a seasonal effect.9 All 3 studies were very limited in longitudinal coverage or had biasing inclusion criteria that are difficult to control in analysis. Seasonality of MS activity as detected by MRI is therefore not well-established.12
Several plausible theories for seasonal modulation of MS activity exist, including environment-induced changes in immune system reactivity, seasonal hormonal profile changes, vitamin D level shifts, or exposure to viral and bacterial antigens. No particular theory was tested or favored in this observational study.
METHODS
Subjects and MRI examinations.
This was a retrospective observational study on high-frequency serial MRI, collected in 1991–1993 in Boston, MA. The patient cohort was uniquely suited for assessing seasonal effects, since patients 1) were not treated with disease-modifying therapies, 2) hailed from a geographically closely circumscribed area, and 3) underwent frequent MRI and clinical examination over the course of an entire year.
Weekly to monthly MRI was performed in 44 patients with MS over 1 year (939 examinations total). The MRI protocol included an axial dual echo dataset (proton density–weighted/T2-weighted, echo time 30/80 msec, repetition time 3,000 msec, 192 phase-encoding steps, and 0.93 × 0.93 × 3 mm nominal voxel size), and a T1-weighted conventional spin-echo, immediately after injection of a 10 mL IV bolus of 0.5 M Gd-DTPA (echo time = 19 msec, repetition time = 600 msec, in-plane voxel size 0.94 mm × 0.94 mm, with 4-mm slice thickness and 1-mm gap between slices). All scans were performed on a 1.5-Tesla machine (Signa, General Electrics, Milwaukee, WI). Of the 44 subjects included, 13 were classified as (chronic) progressive MS at baseline; the rest, relapsing-remitting MS. Age range was 25–52 years (mean ± SD 38.3 ± 7.1), disease duration 8.0 ± 5.6 years, Expanded Disability Status Scale 3.9 ± 0.9.
Clinical examinations were performed at each visit and the occurrence of attacks was recorded for each subject. Attacks were defined as in the original study,13 as episodes of clinical worsening associated with an objective change on examination in a patient who was otherwise stable neurologically for 30 days prior to the onset of new signs and symptoms. A subset of 18 subjects received brief bouts of steroid treatment (average 4.6 ± 5.0 days, range 1–21 days, median number of treatments per patient 4, range 1–17). The potential effect of this treatment on the study variables was considered in analysis.
Meteorologic data (peak daily temperature, solar radiation, and precipitation) for the Boston region during the time of acquisition (1991–1993) were obtained from the US Historical Climatology Network.
Patients underwent 8 weekly scans, followed by 8 scans every other week, followed by 6 monthly examinations. Of the 1,003 MRI examinations acquired, 939 were included in this study, with a median of 22 scans per subject (range 12–24) and an average of 78 ± 9 examinations contributing to each calendar month (table 1). Excluded were 2 (out of 46) subjects with examinations spanning less than 85% of the calendar year, as well as 42 (out of 1,003) follow-up examinations that were 60 or more days apart. The subject and examination frequencies are given in figure 1, showing an even distribution of observations across the calendar year.
Table 1 Monthly distribution of subjects newly entering and the number of highest frequency examinationsa (subjects entered the study throughout the calendar year)
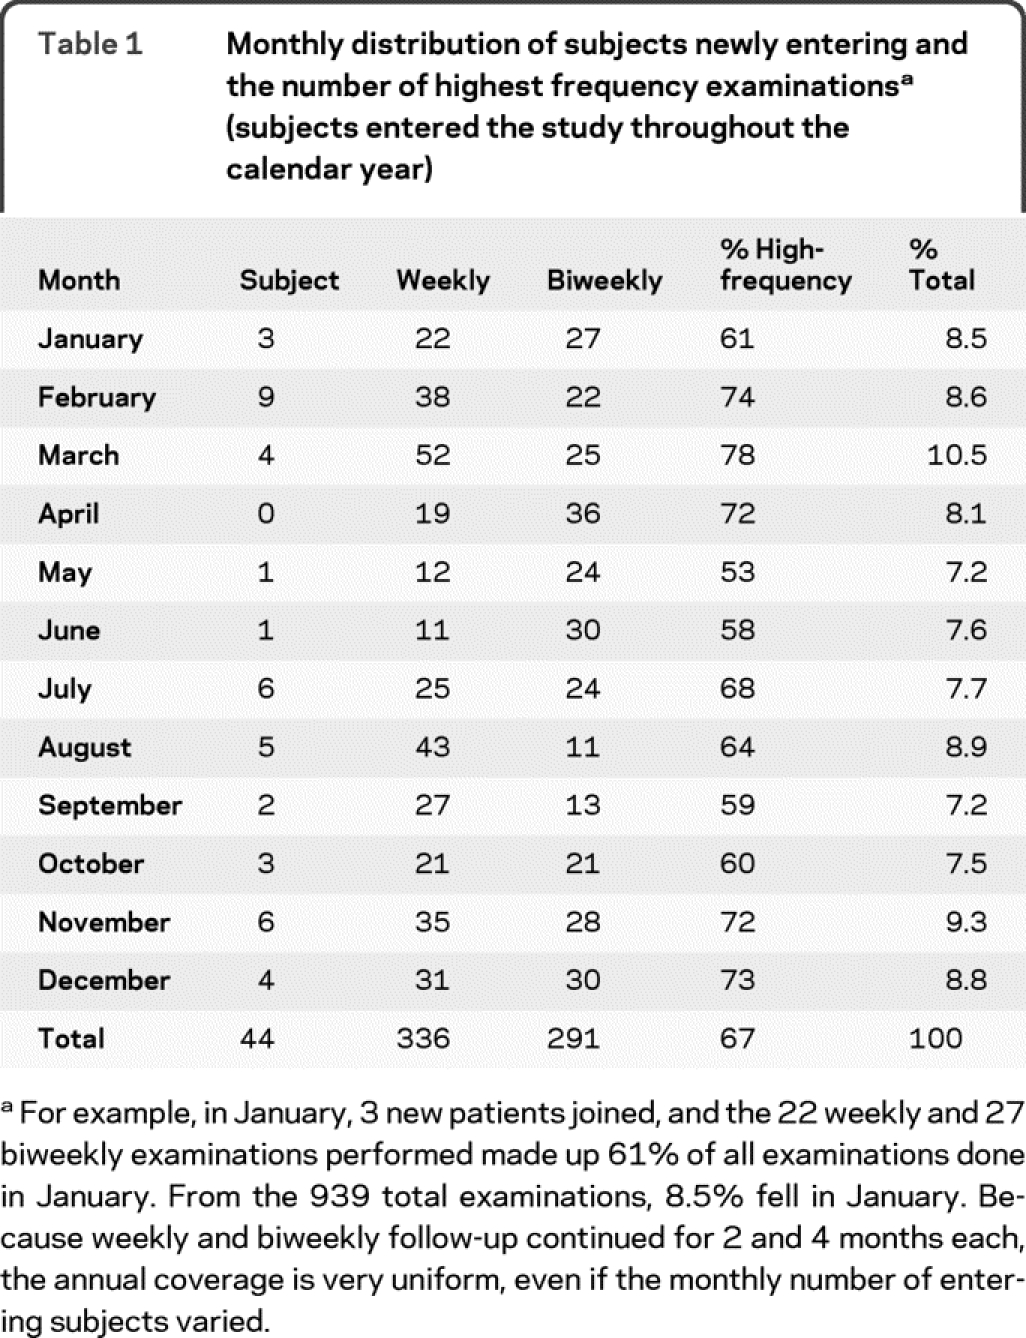

Figure 1 Distributions of observations and subjects over the calendar year
(A) Seasonal distribution of MRI examinations across the calendar year. In black, the number of individual subjects scanned each month; in white, the total number of examinations. For example, in January, 80 MRIs were acquired from 44 subjects. Contribution of subjects to each calendar month and season was very evenly distributed. See also table 1. (B) The distribution of observations over the year in a polar plot. Scale is examination/day. The rate variables reported in figure 2 are counts normalized against this distribution.
Standard protocol approvals, registrations, and patient consents.
Both the original data collection in 1991–1993 and this retrospective data analysis received approval from the institutional ethical standards committee on human experimentation. At the time of recruitment and data collection, written informed consent was obtained from all patients participating in the study. Cohort characteristics, selection, and size criteria and details of the institutional review board–approved study have been described in detail.13
MRI and statistical analysis.
New contrast-enhancing lesions (CEL) were recorded for each examination by 2 independent radiologists. The mean number of new lesions was used in analysis. New T2 lesions were obtained by 1 observer from intensity change maps of coregistered image series as described previously.14,15 Date and uncertainty of each observed new lesion was used in analysis to build likelihood distributions of annual disease activity.
An annual distribution of disease activity was built by distributing all observed new MRI activity over the respective examination interval. Given the short examination intervals in this study, we assumed each observed new lesion to have occurred equally likely anytime between 2 adjacent examinations. For example, 3 new lesions observed after a 7-day follow-up contributed a distributed lesion count of 3/7 assigned to each of the 7 days of the interval. The nonuniform observation frequency across seasons or subjects was addressed by dividing the number of new lesions by the total number of scans for each subject, producing a rate of occurrence, a common measure used in clinical trials.16 To account for individual levels of disease activity we also divided each new activity count (active examinations or lesions) by the total number of observations (examinations), yielding an annual fraction that reports the fraction of a patient's total annual disease activity falling within a given period. Variable coverage of the calendar year was addressed by adjusting all fractional measures based on a 1-year reference.
Seasonal group comparison occurred via Monte Carlo simulation, assigning for each new lesion a random date of occurrence within the respective observation interval. The resulting counts and fractions were then compared using Friedman test (for a 4-season model) and Wilcoxon signed-rank test (for a 2-season model spring/summer vs fall/winter), for each of 1,000 iterations.
A likelihood-based model for new lesion counts for each patient was also applied separately. This was a repeated-measures Poisson model with a gamma random effect, previously proposed for gadolinium-enhancing lesion counts.17 After accounting for the random effect, each seasonal new lesion count was assumed to be independent. Given this model, the joint likelihood for lesions in each season for each patient could be expressed as an extension of the likelihood for paired Poisson count data.18 The maximum likelihood estimates for this model were obtained and equality of seasonal rates was evaluated using a likelihood ratio test.
RESULTS
New disease activity: Raw data.
A total of 310 new T2 lesions were observed in 31 subjects; 13 subjects had no new lesions during the entire period. These new lesions were found in 179 active scans of the total 939 examinations included. A mean (±SD) of 22 ± 31 new CEL were observed per subject in 42 subjects. The average (±SD) coefficient of variation for total new CEL counts per subject was 0.45 ± 0.39 across the 2 observers, and the interrater correlation was 0.42 (Spearman, p < 0.0001). Clinical examinations recorded 51 attacks in 24 subjects, with a mean (±SD) of 2.1 ± 1.5 per subject.
Distributions over the calendar year.
Seasonal activity distributions were built by evenly spreading each lesion count across the length of the respective follow-up interval (figure 2). The new lesion rate metric represents the normalized new T2 lesion count and active scan rate denotes normalized number of examinations with at least 1 new lesion. To give a better representation of a cyclical event, the data are shown as a polar plot, with the year running clockwise and daily temperature, solar radiation, and precipitation levels overlaid in color. To remove fluctuations below the uncertainty of the observation interval, a moving average filter was applied, whose size was the mean of observation periods contributing to each day.

Figure 2 Polar plots of annual multiple sclerosis disease activity distributions, with color background showing climate data (solar radiation, daily peak temperature, and daily mean precipitation)
Thick and thin curves show smoothed and raw distributions. All units are per day; rates are counts divided by number of observations (see figure 1B). (A) New lesion rates, showing a distinctly elevated activity in one-half of the year and strong associations with solar radiation; (B) random half of the data in A, i.e., the cohort split randomly into 2 groups. The pattern and associations remain. (C) Active scans are scans with at least 1 new lesion, i.e., normalizing for individual levels of disease activity. Same pattern as (A) remains, and associations with daily temperature are apparent; (D) per subject analysis, i.e., further isolating individual activity levels via a subjects-with-activity count; e.g., more than 30% of subjects had activity in June, vs ∼10% in November. The seasonal difference between spring/summer and autumn/winter remains distinct. No significant associations with precipitation are apparent.
Distinctly higher activity in the spring and summer months is apparent. The influence of individual disease activity was considered in several ways, once by splitting the cohort randomly,2 expecting only true effects to appear in either half (figure 2B), and once by calculating a subjects with activity count, i.e., the proportion of patients with MRI activity during a given period (figure 2D). All metrics showed strong prevalence of activity during spring and summer.
Monte Carlo simulations.
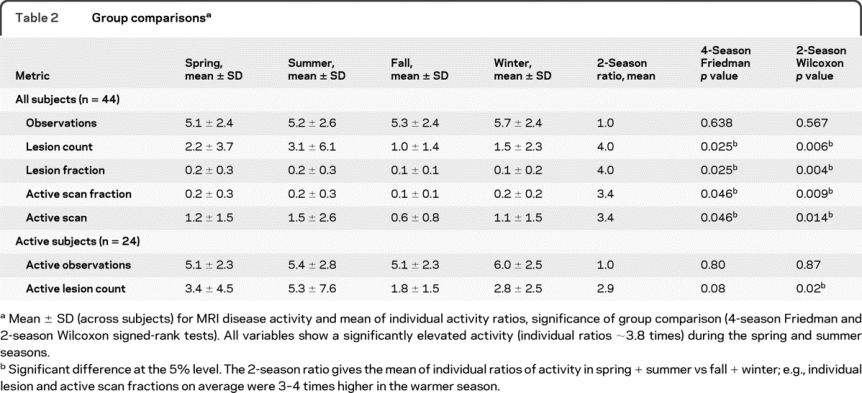
Both 4- and 2-season models were tested in 1,000 Monte Carlo simulations, with both models showing significantly different likelihood and intensity of disease activity across the seasons (figure 3). About 1.8 times elevated activity (group average) was observed during the spring and summer compared to fall and winter, with individual ratios more than 3 times higher (table 2). To obtain a distinction between likelihood and intensity, the same analysis was repeated including only subjects with activity in both seasons (n = 25). Similar ratios were observed, suggesting that both likelihood and intensity are seasonally affected. Calendar seasons used were defined as spring (March 21 to June 20), summer (June 21 to September 22), fall (September 23 to December 20), and winter (December 21 to March 20). The same 1,000 Monte Carlo tests with grouping activity into 12 calendar months did not yield a significant difference in a Friedman test, due to insufficient number of observations of new lesions per subject, i.e., only when grouped into seasonal bins do trends for differences become apparent. The distributions shown in figure 2 were built based on daily bins and also show the month-by-month behavior.
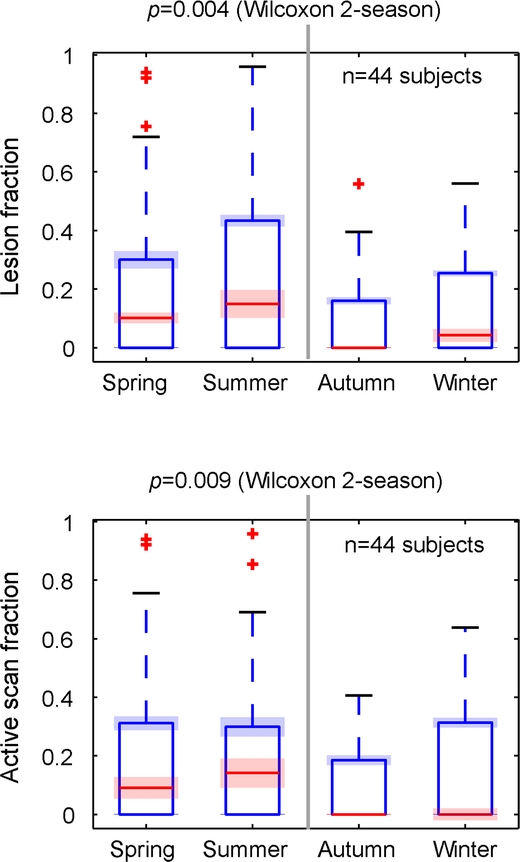
Figure 3 Seasonal differences in disease activity
Box and whisker plots of seasonal differences in disease activity. Variables were the fractions of the total lesion count or active scans over a calendar year, concentrated on any particular season; e.g., the 44 subjects included had less than 20% of their disease activity during fall and winter months. The red and blue bands show 2 standard deviations across the 1,000 Monte Carlo simulations, representing the (very low) contribution of temporal uncertainty of lesion occurrence, compared to the (much larger) intersubject variability. Both lesion and active scan metrics show significantly higher rates in the spring and summer months.
Table 2 Group comparisons
Likelihood estimates of seasonal effects.
The above findings were further confirmed by the analysis of the likelihood function derived from a repeated-measures Poisson model as outlined above. Strong differences among the 4 seasons and between spring/summer vs fall/winter were observed (p < 0.001 for each comparison). The point estimates (95% confidence intervals) for rate of new lesion accrual per day in each season were spring 0.024 (0.012–0.035), summer 0.030 (0.015–0.045), fall 0.010 (0.0046–0.016), and winter 0.016 (0.0073–0.024), showing the increased tendency for lesion accrual in spring and summer compared to winter and fall. This again yields a ratio of new activity to be twice as likely in the summer than winter seasons.
Meteorologic data.
We also tested for associations of seasonality with recorded meteorologic data in the Boston vicinity in the years 1991–1993 when the MRI examinations were acquired. Temperature, solar radiation, and precipitation were analyzed (figure 2). There was a strong correlation of disease activity with warmer temperature (figure 2C, Pearson correlation r = 0.50, p < 0.0001) and solar radiation (figure 2, A and B, r = 0.55, p < 0.0001), which both peaked at close to zero lag (cross-correlation function). Precipitation alone (figure 2D) did not correlate significantly.
Clinical phenotype.
Disease activity is known to diminish over the transition from a relapsing to a progressive course, with the dominant disease process shifting from inflammatory to degenerative.19 To test whether this phenotypic transition also affects seasonal disease activity, we compared the distributions between relapsing and progressive patients in this cohort. As expected, disease activity was lower overall in the progressive cohort. Furthermore, the summer prevalence partially abated into an earlier and more pronounced peak in spring (figure e-1 on the Neurology® Web site at www.neurology.org). Separating the distribution into two equal-length seasons with maximum difference in activity yielded a high-activity period from March to September for relapsing MS. For the progressive cohort, the high-activity interval becomes more distinct (January to July), but lacks the peaks in August found for the relapsing cohort.
Contrast-enhancing lesions and attacks.
The above Monte Carlo analysis was repeated for CEL counts; no significant seasonal differences were found for the CEL variable. The absolute CEL counts showed distributions with enhanced activity in spring and summer, but those modulations did not persist when normalizing for individual levels of disease activity. Attacks likewise did not show any seasonal prevalence.
Steroid treatment.
A subset of 18 subjects received brief bouts of steroid treatment during the course of the study. When repeating the above Monte Carlo analysis with all 18 subjects excluded, results did not change significantly, and seasonal differences in T2 activity remained strong (lesion fraction p = 0.0026, active scan fraction p = 0.0066, 2-season Wilcoxon).
DISCUSSION
In this natural history cohort, we found significantly increased levels of disease activity, as defined by new T2 lesion occurrence, during the spring and summer seasons. Our results agree with seasonality of clinical variables from studies in Japan,3 Sweden,5 and the United States (Ohio20 and Arizona2). Relapsing and progressive MS exhibited different seasonal patterns, with peak prevalence shifting toward spring for progressive MS. We also found associations of activity prevalence with climate data, particularly temperature and solar radiation levels, although this does not suggest a causal relationship. In contrast, as with other studies,10,11 the CEL count was unable to show a seasonal effect. The number of attacks recorded likewise did not have sufficient power to show a seasonal bias. All variables were controlled for individual levels of disease activity as well as variable number and frequency of observations.
We tried to distinguish between the likelihood of new activity and the intensity of activity. Both were clearly elevated during the warmer months in all analyses. Lesion fraction measured the new lesions observed in a season relative to each subject's total amount, emphasizing disease intensity, whereas the active scan metric disregarded the number of new lesions per examination and thus emphasized more the likelihood of the presence of an inflammatory process. When further excluding subjects with no activity in either season altogether, the lesion count remained significantly elevated in the warmer months. Together these findings suggest that both likelihood and intensity of active MS are modulated by seasonal effects.
There are limitations to this retrospective study arising from cohort size and unrecorded variables: the 44 subjects studied here are insufficient to extrapolate prevalence and range of susceptibility for a seasonal effect onto the entire MS population, as well as a putative link to vitamin D. However, the exquisite longitudinal follow-up of this cohort makes these results particularly valuable, because they demonstrate that a robust effect can be captured with sufficient longitudinal coverage and a sensitive metric such as new T2 lesions. Ethnicity was not recorded in all subjects and hence could not be controlled in analysis. Given that the patient population at our center is over 90% Caucasian,21 any confounding effect of ethnicity on the results is likely small. This is also validated in part by the results of the random split shown in figure 2, indicating that the observed seasonality did not originate from a particular subgroup of the cohort. Age and steroid treatment, which can influence MRI metrics such as brain volume,22 were not controlled directly in analysis due to the limited statistical power, but separate sensitivity analyses were performed to evaluate the effect of each: the seasonal modulation prevailed when splitting the cohort based on median age, making age an unlikely confounder. Also no change in seasonal prevalence was observed when excluding all steroid-treated subjects from the above analysis.
Because follow-up frequency was highest at study entrance, an irregular distribution of subjects entering the study could be a concern. The distribution of high-frequency follow-up examinations across the year is important in assessing potential bias from too many examinations concentrated in a particular period. Table 1 lists the number of subjects entering the study over the year and the percentages of high-frequency examinations in each month. On average 66% (range 53%–78%) of all scans performed in a month were high-frequency examinations. The subject and examination frequencies are also shown in figure 1.
The observed seasonality with 2-fold to 3-fold shifts in activity may raise concerns for design and analysis of clinical trials with MRI outcome measures. If left unaccounted, this effect could bias longitudinal assessment both at individual as well as group level. Factors like genetic affinity, disease phenotype, and geographic location are likely to contribute to the magnitude of seasonality effects. The latter will have particular implications for multicenter trials that pool data from geographically distant locations. Studies with prescreening MRI will experience selection bias. Crossover trials also could be biased, depending on the timing of the trial arms, if both disease likelihood and intensity are nonuniform across the calendar year. Similarly, inaccurate power calculations may result from the assumption of a uniform yield of activity.
New T2 lesions served as the main MRI surrogate for active disease in this study. New T2 lesions commonly leave a long-lasting residual area of hyperintensity,14,15 whereas CEL enhance only briefly for about 1–3 weeks.23 New T2 lesions therefore provide an integrated view of disease activity that is much less sensitive toward the interval between MRI assessments and consequently a more robust outcome measure for longitudinal trials. Only one study thus far reports testing for potential seasonal bias of trials with prescreening MRI and CEL, finding seasonal variation but of insignificant impact on the main trial variables.11 The effect on the final power to detect a treatment effect, however, remains inaccessible. We also consider it critical to distinguish in this context between effects that influence the likelihood for new activity and effects that modulate the intensity of activity when it occurs. Seasonal effects, as far as the present results suggest, modulate both, hence trials with active disease enrollment criteria and pooled data are likely to be affected.12
Thus far only clinical and immunologic variables showed seasonal effects in MS. Neither, however, unlike MRI, strictly represents the CNS, making observations on MRI an important complementary finding. For example, the seasonal variations in immunoregulatory cytokine production, reported for interferon-γ, tumor necrosis factor–α, and interleukin-10,6-8 represent the response of peripheral blood mononuclear cells stimulated in vitro and do not reflect immune regulation in the CNS.
DISCLOSURE
Dr. Meier has received research support from the NIH (R01 AG022092-01 [coinvestigator] and NCRR P41 RR013218 [consultant]). Dr. Balashov has received research support from Bayer Schering Pharma, the NIH (NINDS K23NS052553, Balashov), and the National Multiple Sclerosis Society. Dr. Healy reports no disclosures. Dr. Weiner has served/serves on scientific advisory boards for and received speaker honoraria from Biogen Idec, Genentech, Inc., EMD Serono, Inc., and Teva Pharmaceutical Industries Ltd.; serves on the editorial boards of Clinical Immunology, Multiple Sclerosis, the Journal of Immunology, and the Journal of Autoimmunity; and receives research support from the NIH (NINDS P01 NS 038037-06A2 [Program Director], NIAID R01 AI43458 [PI], and R01 AG027437 [PI]) and the National Multiple Sclerosis Society. Dr. Guttmann has served on a scientific advisory board for Tibotec Therapeutics/Johnson & Johnson; holds patents re: Versatile stereotactic device, versatile stereotactic device and methods of use, and overlay of tinted images for visualizing change in serial radiologic images; and has received/receives research support from Teva Pharmaceutical Industries Ltd., the NIH (R01 AG022092-01 [PI of subcontract], HRCA PO1AG004390 [PI of subcontract], NIH R01 NS036524-05 [PI of subcontract], R01 NS055083-01A1 [coinvestigator], NCRR UL1 RR025758-01 [coinvestigator], 2P41RR013218 Supplement [coinvestigator], 2U01AI063623-06 [coinvestigator], NCRR P41 RR013218[coinvestigator]), the Maurice Pechet Foundation, and the National Multiple Sclerosis Society.
Supplementary Material
Address correspondence and reprint requests to Dr. Dominik S. Meier, Center for Neurological Imaging, Brigham & Women's Hospital, 221 Longwood Avenue, RF396, Boston, MA 02115 meier@bwh.harvard.edu
Editorial, page 762
Supplemental data at www.neurology.org
Study funding: The study acquiring the MRI and clinical data (1991–1993) was supported by NIH contract N01-NS-0-2397.
Disclosure: Author disclosures are provided at the end of the article.
Received October 19, 2009. Accepted in final form March 16, 2010.
REFERENCES
- 1.Sibley WA, Bamford CR, Clark K. Clinical viral infections and multiple sclerosis. Lancet 1985;1:1313–1315. [DOI] [PMC free article] [PubMed] [Google Scholar]
- 2.Bamford CR, Sibley WA, Thies C. Seasonal variation of multiple sclerosis exacerbations in Arizona. Neurology 1983;33:697–701. [DOI] [PubMed] [Google Scholar]
- 3.Ogawa G, Mochizuki H, Kanzaki M, Kaida K, Motoyoshi K, Kamakura K. Seasonal variation of multiple sclerosis exacerbations in Japan. Neurol Sci 2004;24:417–419. [DOI] [PubMed] [Google Scholar]
- 4.Wüthrich R, Rieder HP. The seasonal incidence of multiple sclerosis in Switzerland. Eur Neurol 1970;3:257–264. [DOI] [PubMed] [Google Scholar]
- 5.Jin YP, de Pedro-Cuesta J, Soderstrom M, Link H. Incidence of optic neuritis in Stockholm, Sweden, 1990–1995: II: time and space patterns. Arch Neurol 1999;56:975–980. [DOI] [PubMed] [Google Scholar]
- 6.Balashov KE, Olek MJ, Smith DR, Khoury SJ, Weiner HL. Seasonal variation of interferon-gamma production in progressive multiple sclerosis. Ann Neurol 1998;44:824–828. [DOI] [PubMed] [Google Scholar]
- 7.Killestein J, Rep MH, Meilof JF, et al. Seasonal variation in immune measurements and MRI markers of disease activity in MS. Neurology 2002;58:1077–1080. [DOI] [PubMed] [Google Scholar]
- 8.Stewart N, Taylor B, Ponsonby AL, et al. The effect of season on cytokine expression in multiple sclerosis and healthy subjects. J Neuroimmunol 2007;188:181–186. [DOI] [PubMed] [Google Scholar]
- 9.Auer DP, Schumann EM, Kumpfel T, Gossl C, Trenkwalder C. Seasonal fluctuations of gadolinium-enhancing magnetic resonance imaging lesions in multiple sclerosis. Ann Neurol 2000;47:276–277. [PubMed] [Google Scholar]
- 10.Killestein J, Rep MH, Barkhof F, et al. Active MRI lesion appearance in MS patients is preceded by fluctuations in circulating T-helper 1 and 2 cells. J Neuroimmunol 2001;118:286–294. [DOI] [PubMed] [Google Scholar]
- 11.Rovaris M, Comi G, Sormani MP, Wolinsky JS, Ladkani D, Filippi M. Effects of seasons on magnetic resonance imaging–measured disease activity in patients with multiple sclerosis. Ann Neurol 2001;49:415–416. [PubMed] [Google Scholar]
- 12.Tremlett H. Effects of seasons on magnetic resonance imaging-measured disease activity in patients with multiple sclerosis. Ann Neurol 2001;50:422–423. [DOI] [PubMed] [Google Scholar]
- 13.Weiner HL, Guttmann CR, Khoury SJ, et al. Serial magnetic resonance imaging in multiple sclerosis: correlation with attacks, disability, and disease stage. J Neuroimmunol 2000;104:164–173. [DOI] [PubMed] [Google Scholar]
- 14.Meier DS, Weiner HL, Guttmann CR. MR imaging intensity modeling of damage and repair in multiple sclerosis: relationship of short-term lesion recovery to progression and disability. AJNR Am J Neuroradiol 2007;28:1956–1963. [DOI] [PMC free article] [PubMed] [Google Scholar]
- 15.Meier DS, Guttmann CR. Time-series modeling of MS lesion development. Neuroimage 2006;32:531–537. [DOI] [PubMed] [Google Scholar]
- 16.Barkhof F, Polman CH, Radue EW, et al. Magnetic resonance imaging effects of interferon beta-1b in the BENEFIT study: integrated 2-year results. Arch Neurol 2007;64:1292–1298. [DOI] [PubMed] [Google Scholar]
- 17.Sormani MP, Bruzzi P, Miller DH, Gasperini C, Barkhof F, Filippi M. Modelling MRI enhancing lesion counts in multiple sclerosis using a negative binomial model: implications for clinical trials. J Neurol Sci 1999;163:74–80. [DOI] [PubMed] [Google Scholar]
- 18.Cook RJ, Wei W. Selection effects in randomized trials with count data. Stat Med 2002;21:515–531. [DOI] [PubMed] [Google Scholar]
- 19.Meier DS, Weiner HL, Guttmann CR. Time-series modeling of multiple sclerosis disease activity: a promising window on disease progression and repair potential? Neurotherapeutics 2007;4:485–498. [DOI] [PMC free article] [PubMed] [Google Scholar]
- 20.Sibley WA, Foley JM. Infection and Immunization in Multiple Sclerosis. Ann NY Acad Sci 1965;122:457–466. [DOI] [PubMed] [Google Scholar]
- 21.Chitnis T, Glanz B, Jaffin S, Healy B. Demographics of pediatric-onset multiple sclerosis in an MS center population from the Northeastern United States. Mult Scler 2009;15:627–631. [DOI] [PubMed] [Google Scholar]
- 22.Rao AB, Richert N, Howard T, et al. Methylprednisolone effect on brain volume and enhancing lesions in MS before and during IFN-beta-1b. Neurology 2002;59:688–694. [DOI] [PubMed] [Google Scholar]
- 23.Cotton F, Weiner HL, Jolesz FA, Guttmann CR. MRI contrast uptake in new lesions in relapsing-remitting MS followed at weekly intervals. Neurology 2003;60:640–646. [DOI] [PubMed] [Google Scholar]
Associated Data
This section collects any data citations, data availability statements, or supplementary materials included in this article.