

Abstract
Objective:
To assess whether the risk of incidence of Alzheimer disease (AD) varies over time. The increase in numbers of people at the oldest ages in the population will bring an increase in the number of people with AD. Projections of the size of the increase assume the risk of AD is constant.
Methods:
All persons age 65 or older in a biracial, geographically defined area were invited to participate in a home interview every 3 years. From the approximately 10,000 participants, stratified random samples were selected for detailed clinical evaluation. At each cycle, individuals determined free of AD in a previous cycle, either by examination or by high score on cognitive function tests, were sampled in the subsequent cycle for evaluation for incident AD. The evaluations for disease were structured and uniform across time. These analyses include 1,695 subjects evaluated for incident disease from 1997 through 2008.
Results:
AD developed in 360 participants. Change over time in risk of incident disease was assessed in logistic regression analyses including evaluation date and controlling for age, gender, education, race, interval from disease-free designation to evaluation for incident disease, and sample design. The time variable (in years) was not significant (odds ratio = 0.970, 95% confidence interval = 0.902 to 1.044).
Conclusions:
The null relation of evaluation date to disease incidence suggests no recent change in risk of AD over time, and supports this assumption for projections of AD.
GLOSSARY
- AD
= Alzheimer disease;
- CI
= confidence interval;
- NLTCS
= National Long Term Care Study;
- OR
= odds ratio.
Alzheimer disease (AD) has severe consequences for both the individuals involved and the burden on the health care system. Projections of the number of cases over time assumed that the risk of AD would remain constant.1,2 Evidence for an increasing or decreasing risk of disease would demonstrate the need for revised projections.
Studies of the possible changes in AD risk over time have had differing results. Some articles reported that the incidence or prevalence remained stable over time.3–7 One article reported a decline in rates,8 while others suggested that rates increased.9–12 These increases were particularly large when the analyses used cases identified through the Medicare system. AD also has increased as the underlying cause of death on death certificates.13,14 While at least some of this increase was probably due to increased interest in the disease, the numbers raise disturbing questions of whether the occurrence of AD is increasing over time. In this article, we report direct assessment of change in uniformly ascertained incidence of AD over 11 years.
METHODS
Study population.
We used data from a longitudinal study of AD among people aged 65 or older in a geographically defined community of 3 neighborhoods of Chicago, IL.15,16 The study was approved by the Rush University Medical Center Institutional Review Board. The study began with a door-to-door census from 1994 to 1996, and all individuals aged 65 or older were invited to participate in a home interview. Institutionalized persons were also included, although 1 of the 3 nursing homes in the area declined to participate. Of 8,509 people identified in the census, 432 died and 251 moved from the area before participating and 6,158 (78.7%) participated in cycle 1. Surviving participants were interviewed again after 3, 6, 9, and 12 years (cycles 2, 3, 4, and 5). In addition, individuals who turned 65 after the initial enrollment were invited to participate in a rolling enrollment (successive age cohorts). These individuals also received follow-up interviews every 3 years in a pattern identical to that for the original enrollees.
Over 10,000 people have participated when including the successive age cohorts. The cycle 1 interview obtained information about age, gender, race, and years of education. Each interview contained brief tests of cognitive function. Observation continued even if participants entered nursing homes. Cognitive function tests were obtained from the participant even when a proxy was required for other parts of the interview.
Sampling for detailed clinical evaluation.
Random samples for detailed evaluation for AD were drawn from participants in each interview cycle. The samples were stratified to enrich the samples with people most likely to have AD, while maintaining the ability to weight the sample to represent the full population. Specifically, at each cycle, a cohort of persons free of AD was identified, using the following 2 methods: 1) all persons scoring high on the 4 brief tests of cognitive function were considered to be disease-free; 2) of those persons who did not score high on the 4 tests, only those people on whom we had a detailed clinical evaluation (see below) and who were determined to be free of AD at the evaluation were included in the cohort of disease-free persons. To obtain a sample of persons to evaluate for incident disease, we drew a stratified random sample of the persons in the disease-free cohort at the next cycle. For example, the first incidence sample was drawn at cycle 2. From among those persons who participated in the cycle 2 full-population interview, we identified 2,948 persons who met either criterion 1 or criterion 2, above, for being disease-free at cycle 1.
We then stratified this sampling frame by age group, race (black/nonblack), gender, and change in performance on the brief tests of cognitive function between cycle 1 and cycle 2. We used Poisson sampling (independent Bernoulli sampling) to keep the selection of each person independent from every other person.16–18 At the later cycles, sampling proceeded along identical lines. Persons could be included more than once (i.e., in the first incidence sample and again in the second incidence sample) if they met the criteria both times. This feature maintained the integrity and representativeness of the sampling procedure, by giving everyone who was disease-free at any given cycle a chance to be selected into the incidence sample at the next cycle. We kept track of all of the probabilities of selection and incorporated them in our estimation procedure.18,19 AD incidence has been evaluated in disease-free cohorts beginning in 1997 and continuing to the present time. For these analyses, we used data accrued between 1997 and 2008.
Clinical evaluation for AD.
Sampled individuals received uniform, structured clinical evaluation for AD and other dementing illnesses. Examiners were blinded to population interview cognitive testing results and sampling stratum. Specially trained nurse-clinicians performed structured neurologic examinations and obtained a medical history. A neuropsychologist, blinded to age, gender, race, and clinical data other than years of education, occupation, and information about sensory or motor deficits, summarized impairment in each of 5 domains (orientation, attention, memory, language, and perception) based on a battery of 17 cognitive tests. A board-certified neurologist or geriatrician reviewed all data and examined each participant. Brain MRI was offered to all participants and was obtained for approximately 55%. Diagnosis of dementia required loss of cognitive function by the neurologist's assessment and impairment in 2 or more functions on the cognitive tests. Criteria for diagnosis of AD were those of the working group of the National Institute of Neurological and Communicative Disorders and Stroke–Alzheimer's Disease and Related Disorders Association for probable AD,20 except that persons who met these criteria and also had another condition impairing cognition were retained. Diagnostic uniformity is encouraged through the highly structured evaluation process.
Potentially confounding factors.
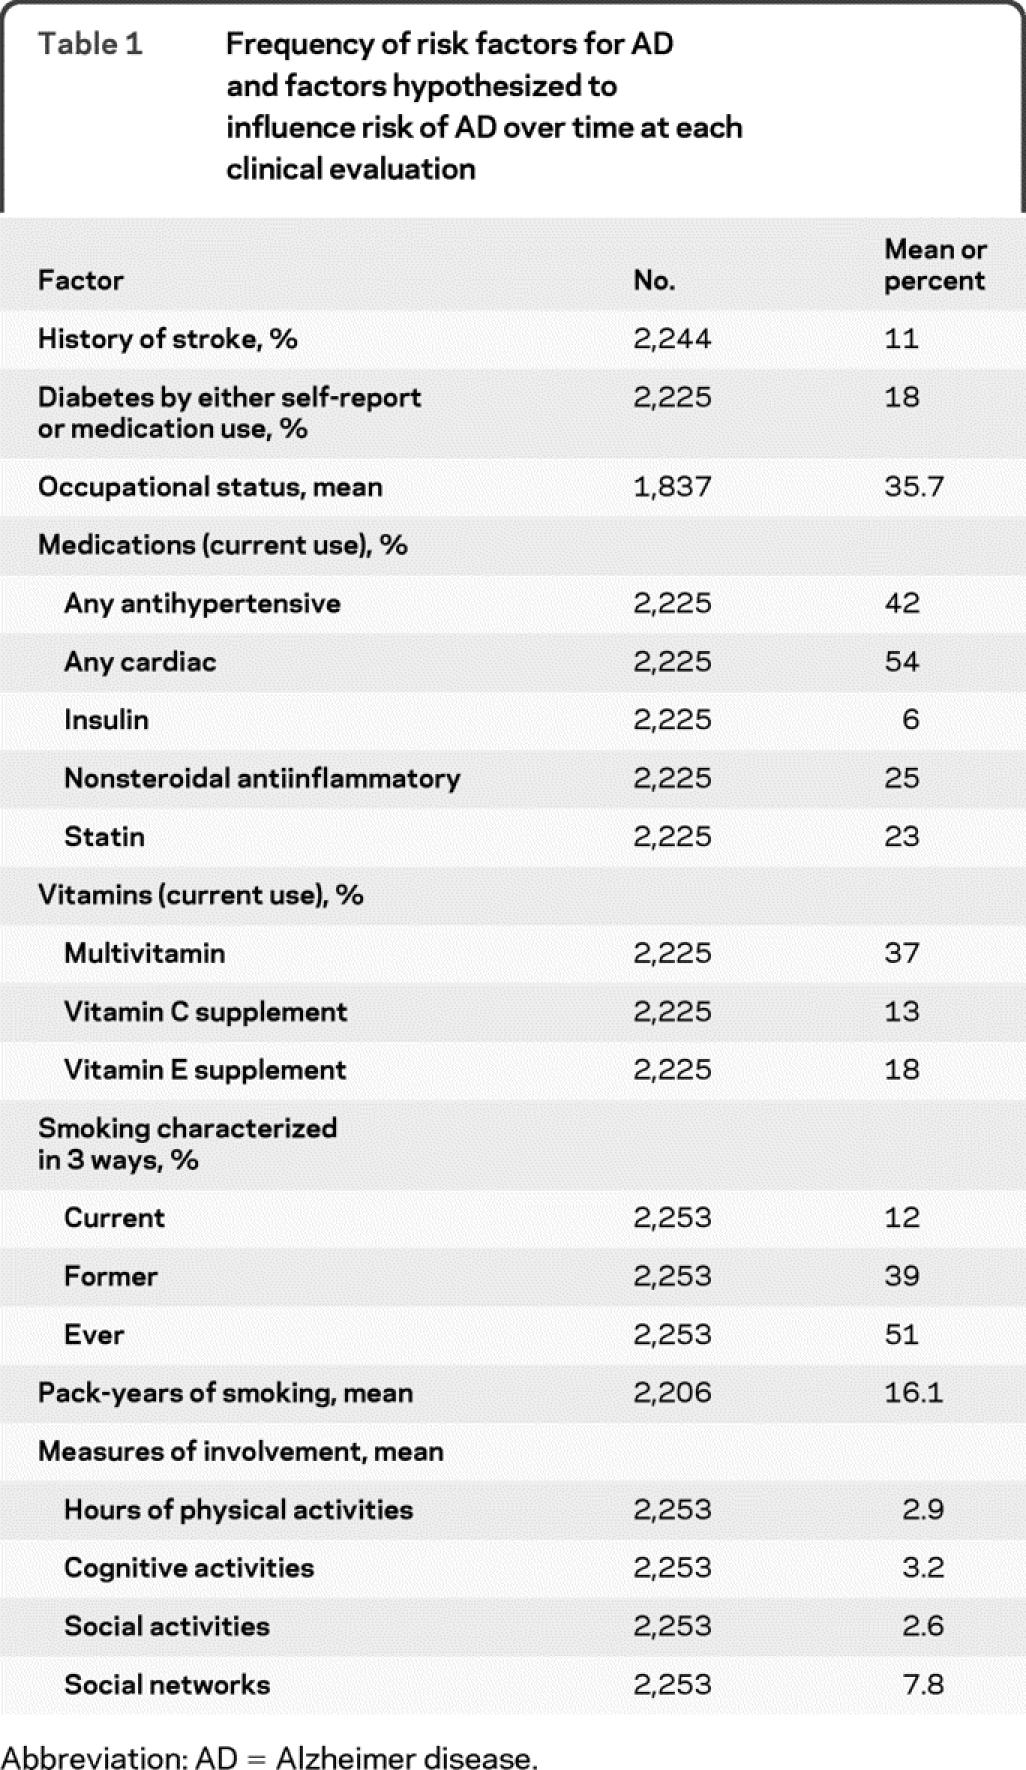
Age was calculated from date of birth to date of clinical evaluation. We considered both age and years of education as continuous variables in analyses. We identified race by asking participants the question used in the 1990 US Census then summarized the 6 categories to black or white, including the few of other races in the white category. We included race because previous work has found racial differences in risk of AD.15,21 We coded usual lifetime occupation using the Featherman occupational prestige index.22 At each interview, we asked about history of stroke and diabetes, use of prescription and nonprescription medications, smoking, and cognitive, physical, and social activities. We separately tested for current use or prior use of the drugs and vitamins listed in table 1. We tested for effect of physical and social activities determined at the interview which began the disease-free interval. We characterized participation in 7 cognitively stimulating activities as the average of a 5-point scale of frequency for each activity.23 We asked about frequency of participation in 6 physical activities and summed the number of hours per week.24 Frequency of participation in 4 social activities was summed in a 0–8 scale.25 Social networks were characterized as the number of people contacted monthly.25
Table 1 Frequency of risk factors for AD and factors hypothesized to influence risk of AD over time at each clinical evaluation
Statistical analysis.
All analyses were weighted to reflect the sample design, which in turn allowed us to make inferences about the full Chicago Health and Aging Project community population. To adjust for nonparticipation in the clinical evaluation for AD, we used iterative proportional fitting26 to produce smoothed cell-based adjustment factors. To test for the influence of calendar time, we used logistic regression and controlled for length of observation interval (time from previous cycle disease-free designation). Because our observation intervals were approximately the same length (3 years) for everyone, we were able to use logistic regression and could thus avoid problems with interval censoring in survival models. We controlled for age at disease evaluation, gender, race, years of education, and the interval between assessment of disease-free status and disease evaluation in all analyses. We computed point estimates using the sampling weight and used jackknife-based procedures for variance estimation.18,19,27 This approach accounts for the complexity of the sampling design, including the fact that people can be sampled more than once. It allows us to draw valid inferences for the population represented by the sample. Models included age, gender, race, and observation interval in addition to the factor of interest: evaluation date. We then added an indicator for the presence of any apolipoprotein ε4 (apoE4) allele to the model, followed by other potential risk factors. In 31 additional models, we tested for potential confounding effects of factors listed in table 1 by adding each separately to the model including the apoE4 indicator. We also tested for interaction of calendar time with age, gender, race, and education in separate models.
RESULTS
These analyses included 1,695 individuals and 2,254 evaluations for incident disease over 11.04 calendar years. At the time of these analyses, 33.7% of those sampled had not participated in the clinical evaluation, including both those who died before participation was obtained and those who declined to participate. There were 360 cases of incident AD. The demographic characteristics of the sample are listed in table 2. Results of the logistic model are in table 3. Whether or not there was a change in risk of AD over time was assessed by examining if AD evaluation date was related to the risk of developing incident AD. The odds ratio (OR) for AD evaluation date was 0.97 (95% confidence interval [CI] 0.90–1.04), indicating no significant change in risk of developing AD over time.
Table 2 Characteristics of the study sample
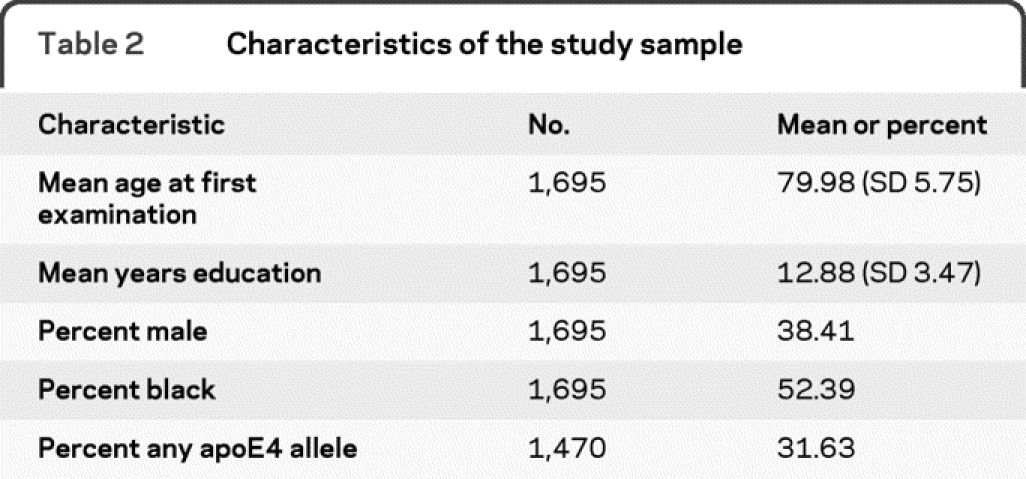
Table 3 Probability of incident Alzheimer disease in a logistic model
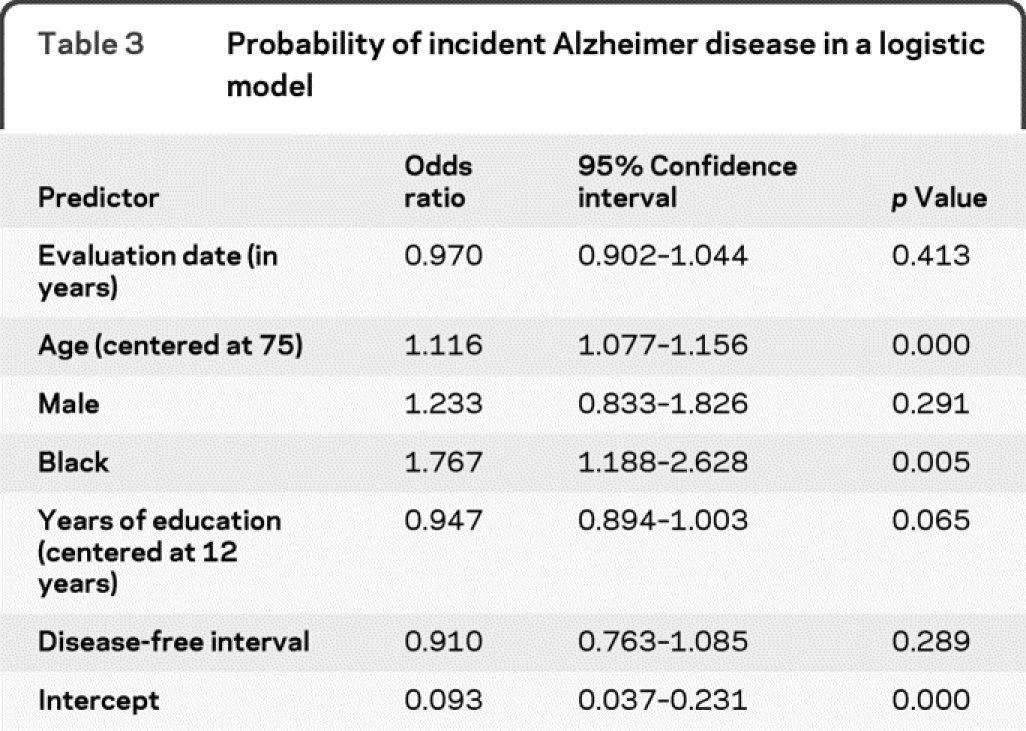
For insights about biologic processes producing AD, it is desirable to control for invariant biologic risk factors such as apoE4. With an indicator for presence of at least 1 ε4 allele in the model, date of examination was still not significant (OR = 0.95, 95% CI = 0.89–1.02). Interactions of age, gender, race, education, or apoE4 with evaluation date were not significant. Other factors added to the model containing apoE4 did not explain the nonsignificant decrease in risk of AD over time. About half the factors listed in table 1 significantly predicted AD risk, but including them in the model had little effect on the predicted impact of evaluation date. With another factor in the model, the OR for evaluation date ranged only between 0.94 and 0.97 and was never significant. Interactions of these factors with time were never significant. In tests of model fit, there were 5 outliers (df β >2) and eliminating them did not change any effect estimates more than 2 standard deviations; however, it did make several variables significant, including examination date. The 5 outlier participants varied in age, race, gender, apoE4 status, and time of diagnosis. They had substantial, but not the highest weights. They all had low education (4 had 0 years and 1 had 6 years). There was no indication that their data were invalid, so they were retained. Adding variables to characterize education in more detail did not change their outlier status.
DISCUSSION
We did not find a significant change in risk of AD over time. The point estimate was in the direction of decline in risk but very small. A number of factors proposed to influence changes in AD risk had little effect on the estimate. Previous reports of changes in risk of AD over time have had inconsistent findings. Even different analyses of the same studies have found different results. The earliest study was in Sweden and began in 1947 and ended in 1972. A first article reported a decrease in incidence of AD from the first 10-year period to the second 15-year period.8 A second article, however, found no significant change in either incidence or prevalence between the 2 periods.6 Informants were used to identify disease and to estimate the time of onset of symptoms. Adjustment for age was by broad 10-year age, the sample size was small, and while the long follow-up period of 25 years is a substantial strength, it was diminished by combining the 25 years into only 2 intervals.
The second set of related articles used data from Rochester, MN, from 1960 through 1984. The first analysis of prevalence found no change over time,3 the second found decreasing incidence,9 and the third, which used finer age groupings, found no change in either incidence or prevalence.4 Diagnosis and date of onset were obtained from medical records, but AD does not always come to medical attention, and changes in common knowledge of, and interest in, AD can result in changing patterns of diagnosis over time.
A recent set of articles was related to the National Long Term Care Study (NLTCS) and used Medicare data from 1984 through 2000 for identification of AD. The NLTCS drew representative samples from Medicare enrollment lists, collected data in 5 waves, and added participants at each wave. Of 2 studies of the NLTCS participants, one found no significant change in prevalence of AD7 and the other found significant increase in both incidence and prevalence of AD.11 A third analysis used the entire pool of Medicare data that was used to select samples for the NLTCS and found significant increase in Medicare prevalence of AD over time.10 Use of Medicare claims data has the strong advantage of near-uniform availability for people over the age of 65 but the disadvantages inherent in ascertaining AD diagnosis over time from medical records and potential difficulty in distinguishing between testing for AD and diagnosis of the disease from billing records.
A study in Japan screened and then evaluated people in a defined geographic area for prevalence of AD in 1985 and again in 1992.5 There was no significant difference in age-specific AD prevalence between the 2 periods, but there were few cases of AD (12 in 1985 and 21 in 1992) and comparisons were of 5-year age groups. In a study12 in China, from 1986 to 1989 and again from 1997 to 1999, samples of people in a defined geographic area were screened then evaluated for 2-year incidence of AD. There was no significant difference in age-standardized incidence between the 2 periods, but the population was relatively young with few incident cases of AD (13 in the first period and 25 in the second) and age standardization was in 10-year groups.
Our analyses have both advantages and limitations. Among the advantages, we used data from a rigorously conducted population-based study having representation of both African American and white subjects. Age is an extremely important predictor of AD risk, and we had a sufficient sample size to adequately consider age in our analyses. AD was assessed with uniform, structured methods that were identical at all times. Onset interval was directly observed, because disease-free status was determined before each interval for development of disease. We directly examined changes in risk of AD over time, rather than attempting to infer changes in risk either from incidence rates or indirectly from prevalence estimates. Rather than computing rates, we modeled risk of incident AD predicted by specific time of incident diagnosis, permitting more sensitive evaluation of time differences and close control for age.
Among the limitations of our study, AD incidence was observed in only 1 community, not a nationally representative sample, although this approach provided advantages in better assuring uniformity of procedures. Few other studies have been sufficiently extensive: for example, the East Boston study28 included detailed information, but it did not continue for enough years to provide evidence of change in AD incidence over calendar time. The ADAMS study29 included a nationally representative sample, but has not continued long enough to measure incidence. Perhaps the strongest limitation is that even very small changes in risk of AD over time can have a substantial impact if they continue over a long period, and even a large study over more than a decade such as ours cannot convincingly exclude the possibility of such small changes. Our point estimate of the change in risk per year (0.97; CI 0.90–1.04) was small and nonsignificant but slightly in the direction of decline in risk. Longer observation or a larger study would be needed to convincingly exclude smaller changes in risk over time. Even the small annual change could have substantial effect on estimates of future numbers of people affected by AD, depending on the length of time the change continued. It is uncertain if the necessary commitment exists to provide resources for a longer study necessary to detect even smaller changes in risk over time.
Although there is no clear evidence of recent change in AD incidence over time, even a small change in risk could result in substantial changes in projected number of people with AD, and this would change the public health impact of this disease with the aging of the populations of all developed countries, so continued observations for even more extended periods from large-scale population studies are advisable.
AUTHOR CONTRIBUTIONS
Statistical analysis was conducted by Dr. Liesi Hebert and Dr. Julia Bienias.
ACKNOWLEDGMENT
The authors thank Dr. Paul Scherr for assistance with analyses and Kenneth Tonnissen and Todd Beck, Rush Institute for Healthy Aging, for statistical analysis.
DISCLOSURE
Dr. Hebert receives research support from the NIH (R01NR010211 [PI], R01AG030544 [biostatistician], R01AG009966 [biostatistician], RO1AG011101 [epidemiologist], RC2AG036650 [biostatistician]). Dr. Bienias reports no disclosures. Dr. Aggarwal has served on a scientific advisory board for and received honoraria from Pfizer Inc. and receives research support from the NIH (R01AG022018 [coinvestigator], P30AG010161 [coinvestigator], R01AG011101 [coinvestigator], R01AG009966 [coinvestigator], R01HL084209 [coinvestigator], R01AG032247 [coinvestigator]) and the Alzheimer's Association. Dr. Wilson serves as a Consulting Editor for Aging, Neuropsychology, and Cognition and Psychology and Aging and receives research support from the NIH/NIA (R01AG024871 [PI], P30AG10161 [coinvestigator], R01AG11101 [coinvestigator], R01AG15819 [coinvestigator], R01AG021972 [coinvestigator], U24AG026395 [coinvestigator], R01AG017917 [coinvestigator], R01AG009966 [coinvestigator], U01AG016979 [coinvestigator]) and the NIH/NIEHS (ES10902 [coinvestigator]). Dr. Bennett serves on the editorial board of Neurology®; has served as a consultant to Schering-Plough Corp., Medivation, Inc., and the Gerson Lehrman Group; and receives research support from Danone Inc., the NIH (R01AG017917 [PI], R01AG015819 [PI], R01AG036042 [PI], RC2AG036547 [PI], U01AG032984 [co-PI, Leader of Epidemiologic Cohort Studies], R01AG024480 [coinvestigator], R01AG024871 [coinvestigator], P01AG009466 [coinvestigator], U24AG026395 [coinvestigator], R01AG030142 [coinvestigator], P01AG01449 [coinvestigator], R01HL096944 [coinvestigator], R01AG033678 [coinvestigator], R01AG034374 [coinvestigator], R01AG032755 [coinvestigator], P30AG010161 [PI-Administrative core leader, Religious Orders Study core leader]), and the Illinois Department of Public Health. Dr. Shah has served on the speakers' bureau for Eisai Inc.; receives research support from Ceregene, Danone Research B.V., Eisai Inc., Elan Corporation, Merck & Co., Inc., Pamlab LLC, Orasi Medical, Inc., Pfizer Inc., the NIH (P30 AG101061 [Education and Information Transfer Core Leader], P01 AG009466 [coinvestigator, Administrative Core], R01NR009543 [coinvestigator], R01 AG11101 [coinvestigator], U01 AG010483 [Site Investigator]), and the Illinois Department of Public Aid Alzheimer's Disease Assistance Center. Dr. Evans has served on a data monitoring committee for Eli Lily and Company and receives research support from the NIH (AG11101 [PI], AG036650 [PI], AG09966 [PI], AG030146 [PI], AG10161 [coinvestigator], AG021972 [coinvestigator], ES10902 [coinvestigator, NR009543 [coinvestigator], HL084209 [coinvestigator], AG12505l [coinvestigator]).
Address correspondence and reprint requests to Dr. Liesi Hebert, Rush Institute for Healthy Aging, 1645 W. Jackson Blvd. Suite 675, Chicago, IL 60612 Liesi_Hebert@rush.edu
See page 779
Study funding: Supported by the NIH/NIA AG029652 and AG11101.
Disclosure: Author disclosures are provided at the end of the article.
Received March 16, 2010. Accepted in final form May 24, 2010.
REFERENCES
- 1.Hebert LE, Beckett LA, Scherr PA, Evans DA. Annual incidence of Alzheimer disease in the United States projected to the years 2000 through 2050. Alzheimer Dis Assoc Disord 2001;15:169–173. [DOI] [PubMed] [Google Scholar]
- 2.Brookmeyer R, Gray S, Kawas C. Projections of Alzheimer's disease in the United States and the public health impact of delaying disease onset. Am J Public Health 1998;88:1337–1342. [DOI] [PMC free article] [PubMed] [Google Scholar]
- 3.Beard CM, Kokmen E, Offord K, Kurland LT. Is the prevalence of dementia changing? Neurology 1991;41:1911–1914. [DOI] [PubMed] [Google Scholar]
- 4.Rocca WA, Cha RH, Waring SC, Kokmen E. Incidence of dementia and Alzheimer's disease: a reanalysis of data from Rochester, Minnesota, 1975–1984. Am J Epidemiol 1998;148:51–62. [DOI] [PubMed] [Google Scholar]
- 5.Kiyohara Y, Yoshitake T, Kato I, et al. Changing patterns in the prevalence of dementia in a Japanese community: the Hisayama study. Gerontology 1994;40(suppl 2):29–35. [DOI] [PubMed] [Google Scholar]
- 6.Rorsman B, Hagnell O, Lanke J. Prevalence and incidence of senile and multi-infarct dementia in the Lundby Study: a comparison between the time periods 1947–1957 and 1957–1972. Neuropsychobiology 1986;15:122–129. [DOI] [PubMed] [Google Scholar]
- 7.Manton KC, Gu XL, Ukraintseva SV. Declining prevalence of dementia in the U.S. elderly population. Adv Gerontol 2005;16:30–37. [PubMed] [Google Scholar]
- 8.Hagnell O, Lanke J, Rorsman B, Ohman R, Ojesjo L. Current trends in the incidence of senile and multi-infarct dementia: a prospective study of a total population followed over 25 years: the Lundby Study. Arch Psychiatr Nervenkr 1983;233:423–438. [DOI] [PubMed] [Google Scholar]
- 9.Kokmen E, Beard CM, O'Brien PC, Offord KP, Kurland LT. Is the incidence of dementing illness changing? A 25-year time trend study in Rochester, Minnesota (1960–1984). Neurology 1993;43:1887–1892. [DOI] [PubMed] [Google Scholar]
- 10.Taylor DH Jr, Sloan FA, Doraiswamy PM. Marked increase in Alzheimer's disease identified in medicare claims records between 1991 and 1999. J Gerontol A Biol Sci Med Sci 2004;59:762–766. [DOI] [PubMed] [Google Scholar]
- 11.Ukraintseva S, Sloan F, Arbeev K, Yashin A. Increasing rates of dementia at time of declining mortality from stroke. Stroke 2006;37:1155–1159. [DOI] [PubMed] [Google Scholar]
- 12.Li S, Yan F, Li G, et al. Is the dementia rate increasing in Beijing? Prevalence and incidence of dementia 10 years later in an urban elderly population. Acta Psychiatr Scand 2007;115:73–79. [DOI] [PubMed] [Google Scholar]
- 13.Deaths and death rates for 2004. Available at: www.cdc.gov/nchs/products/pubs/pubd/hestats/prelimdeaths04/preliminarydeaths04.htm. Accessed September 16, 2009.
- 14.Death rates 1995. Available at: http://www.cdc.gov/nchs/data/mvsr/supp/mv45_11s2.pdf. Accessed September 16, 2009.
- 15.Evans DA, Bennett DA, Wilson RS, et al. Incidence of Alzheimer disease in a biracial urban community: relation to apolipoprotein E allele status. Arch Neurol 2003;60:185–189. [DOI] [PubMed] [Google Scholar]
- 16.Bienias JL, Beckett LA, Bennett DA, Wilson RS, Evans DA. Design of the Chicago Health and Aging Project (CHAP). J Alzheimers Dis 2003;5:349–355. [DOI] [PubMed] [Google Scholar]
- 17.Wilson RS, Bennett DA, Beckett LA, et al. Cognitive activity in older persons from a geographically defined population. J Gerontol B Psychol Sci Soc Sci 1999;54:155–160. [DOI] [PubMed] [Google Scholar]
- 18.Bienias JL, Kott PS, Beck TL, Evans DA. Incorporating multiple observations into logistic regression models of incident disease. In: Proceedings of the Annual Meeting of the American Statistical Association, Section on Survey Research Methods (CD-ROM: 2767–2774). Alexandria, VA: American Statistical Association; 2005.
- 19.Bienias JL, Kott PS, Evans DA. Applying the delete-a-group jackknife variance estimator to analyses of data from a complex longitudinal survey. In: Proceedings of the Annual Meeting of the American Statistical Association, Section on Survey Research Methods (CD-ROM: 539–544). Alexandria, VA: American Statistical Association; 2003.
- 20.McKhann G, Drachman D, Folstein M, Katzman R, Price D, Stadlan EM. Clinical diagnosis of Alzheimer's disease: report of the NINCDS-ADRDA Work Group under the auspices of Department of Health and Human Services Task Force on Alzheimer's Disease. Neurology 1984;34:939–944. [DOI] [PubMed] [Google Scholar]
- 21.Tang MX, Stern Y, Marder K, et al. The APOE-epsilon4 allele and the risk of Alzheimer disease among African Americans, whites, and Hispanics. JAMA 1998;279:751–755. [DOI] [PubMed] [Google Scholar]
- 22.Featherman DL, Hauser RM. The Measurement of Occupation in Social Surveys: The Process of Stratification: Trends and Analyses. New York: Academic Press; 1977:51–80. [Google Scholar]
- 23.Wilson RS, Mendes De Leon CF, Barnes LL, et al. Participation in cognitively stimulating activities and risk of incident Alzheimer disease. JAMA 2002;287:742–748. [DOI] [PubMed] [Google Scholar]
- 24.Wilson RS, Krueger KR, Gu L, Bienias JL, Mendes De Leon CF, Evans DA. Neuroticism, extraversion, and mortality in a defined population of older persons. Psychosom Med 2005;67:841–845. [DOI] [PubMed] [Google Scholar]
- 25.Barnes LL, Mendes De Leon CF, Wilson RS, Bienias JL, Evans DA. Social resources and cognitive decline in a population of older African Americans and whites. Neurology 2004;63:2322–2326. [DOI] [PubMed] [Google Scholar]
- 26.Little RJA, Rubin DB. Statistical Analysis with Missing Data. New York: Wiley; 1987. [Google Scholar]
- 27.Wolter KM. Introduction to Variance Estimation. New York: Springer-Verlag; 1985. [Google Scholar]
- 28.Hebert LE, Scherr PA, Beckett LA, et al. Age-specific incidence of Alzheimer's disease in a community population. JAMA 1995;273:1354–1359. [PubMed] [Google Scholar]
- 29.Langa KM, Plassman BL, Wallace RB, et al. The Aging, Demographics, and Memory Study: study design and methods. Neuroepidemiology 2005;25:181–191. [DOI] [PubMed] [Google Scholar]