Abstract
Angiotensin II (Ang II) and vascular endothelial growth factor (VEGF) are important mediators of kidney injury in diabetes. Acute hyperglycemia increased synthesis of intrarenal Ang I and Ang II and resulted in activation of both Ang II receptors, AT1 and AT2, in the kidney. Losartan (specific AT1 antagonist) or PD123319 (specific AT2 antagonist) did not affect hyperglycemia but prevented activation of renal AT1 and AT2, respectively. In murine renal cortex, acute hyperglycemia increased VEGF protein but not mRNA content after 24 hours, which suggested translational regulation. Blockade of AT2, but not AT1, prevented increase in VEGF synthesis by inhibiting translation of VEGF mRNA in renal cortex. Acute hyperglycemia increased VEGF expression in wild type but not in AT2 knockout mice. Binding of heterogeneous nuclear ribonucleoprotein K to VEGF mRNA, which stimulates its translation, was prevented by blockade of AT2, but not AT1. The Akt-mTOR-p70S6K signaling pathway, involved in the activation of mRNA translation, was activated in hyperglycemic kidneys and was blocked by the AT2 antagonist. Elongation phase is an important step of mRNA translation that is controlled by elongation factor 1A (eEF1A) and 2 (eEF2). Expression of eEF1A and activity of eEF2 was higher in kidney cortex from hyperglycemic mice and only the AT2 antagonist prevented these changes. To assess selectivity of translational control of VEGF expression, we measured expression of fibronectin (FN) and laminin β1 (lamβ1): acute hyperglycemia increased FN expression at both protein and mRNA levels, indicating transcriptional control, and did not affect the expression of lamβ1. To confirm results obtained with PD123319, we induced hyperglycemia in AT2 knockout mice and found that in the absence of AT2, translational control of VEGF expression by hyperglycemia was abolished.
Our data show that acute hyperglycemia stimulates Ang II synthesis in murine kidney cortex, this leads to AT2 activation and stimulation of VEGF mRNA translation, via the Akt-mTOR-p70S6K signaling pathway. Our data show that exclusive translational control of protein expression in the kidney by acute hyperglycemia is not a general phenomenon, but do not prove that it is restricted to VEGF
1) Introduction
Hyperglycemia, a hallmark of type 1 diabetes, is directly responsible for most of the organ damage observed in diabetic patients, such as retinopathy and nephropathy. Although hyperglycemia can directly damage cells, some of its effects are also mediated by hormones and growth factors, the synthesis of which is increased by hyperglycemia, such as Ang II, TGFβ, connective tissue growth factor [1] and VEGF [2].
A role for VEGF in the pathogenesis of diabetic nephropathy has been established and anti-VEGF strategies such as administration of neutralizing antibodies have effectively ameliorated cardinal features of diabetic nephropathy in rodents [3]. Therefore, it is important to understand the mechanisms of VEGF regulation by hyperglycemia in the kidney.
The best documented regulation of VEGF synthesis by hyperglycemia occurs during diabetic retinopathy: in the retina of rats with type 1 diabetes, VEGF synthesis is increased in the ganglion cell layer and the inner nuclear layer [4]. Other studies have shown that upregulation of VEGF in the retina is mediated by activation of a local renin-angiotensin system [5].
The regulation of VEGF by high glucose has been studied in various kidney cells in culture. Stimulation of VEGF synthesis by high glucose has been observed in podocytes [6, 7], where it is mediated by endogenous TGFβ [7], and in proximal tubule epithelial cells [6, 8], where it is due to activation of a local renin angiotensin system [8].
Our previous study in proximal tubule epithelial cells has shown that Ang II rapidly stimulates VEGF synthesis, within 5 minutes of stimulation, through activation of the cap-dependent translation of its mRNA [9-11]. However, these studies were performed in vitro using renal cells in culture without corresponding studies in animal models of hyperglycemia. In this study, we investigate whether the rapid regulation of VEGF synthesis through a translational mechanism occurs in the kidney of hyperglycemic mice and whether Ang II plays a role in that process.
2) Materials & Methods
2.1) Materials
Streptozotocin, PD123,319, and antibody directed against β-actin were purchased from Sigma (Saint Louis, MO). ZD7155 was purchased from Tocris (Ellisville, MO). Conformation-specific antibodies directed against activated AT1 and AT2 were from Assay Designs (Ann Arbor, MI), and antibodies directed against AT1 and AT2 were purchased from Alomone Labs (Jerusalem, Israel). Monoclonal antibody directed against VEGF was from Santa Cruz Biotechnology (Santa Cruz, CA). All other antibodies were from Cell Signaling Technology (Danvers, MA).
2.2
Induction of hyperglycemia in mice was performed as described in [12]. Four week-old C57Bl mice received daily intraperitoneal injections of streptozotocin (STZ; 50 mg/kg) for four days, followed by a fifth injection of 120 mg/kg STZ. Blood glucose was monitored using a glucometer (Ascensia Elite XL, Mishawaka, IN) every day following the last injection. Mice became hyperglycemic 4 days after the last injection. Hyperglycemic mice were injected subcutaneously with 10 mg/kg of ZD7155, 10 mg/kg of PD123319 or the equivalent volume of saline. Mice were sacrificed 24 hours after injection of the antagonists, kidneys were surgically removed and cortex was dissected out for further analysis. Age- and sex-matched AT2 knockout mice (a generous gift from Dr Victor Dzau, Duke University) and their wild-type controls (129S6/SvEvTac, Jackson Laboratories, Bar Harbor, ME) received STZ as described above and were sacrificed 24 hours after onset of hyperglycemia. Animal protocols were approved by the Institutional Animal Care and Use Committee according to guidelines from the NIH.
2.3
Immunofluorescence histochemistry was performed as previously described [13]. Six-micron thick frozen kidney sections were cut using a cryostat and allowed to air dry for 45 minutes. The sections were fixed in ice-cold acetone for 5 minutes, air dried, then rehydrated in PBS, 1% BSA. After blocking with 0.5 mg/ml donkey IgG, the sections were incubated with primary antibody to AT1 and AT2 (Alomone Labs, Jerusalem, Israel), followed by FITC- or Cy-3-labeled donkey anti-rabbit IgG (Chemicon International, Inc, Temecula, CA). The sections were repetitively washed with PBS, BSA after each step. After mounting under glass coverslips the sections were viewed and photographed using an Olympus Research microscope equipped for epifluorescence.
2.4
Immunoblot analyses were performed as previously described [9, 11]. Slices of kidney cortex were homogenized in RIPA buffer (50 mM Tris HCl, pH 7.4, 150 mM potassium chloride, 1 mM DTT, 1 mM EDTA, 50 mM glycerophosphate pH 7.5, 50 mM sodium fluoride, 0.1 mM sodium orthovanadate, 1 mM EGTA, 2 mM benzamidine, 1 mM PMSF, 1 μg/ml aprotinin and 1 μg/ml leupeptin). Protein concentration was measured using the Biorad protein reagent (Biorad, Hercules, CA). Fifty to one hundred micrograms of kidney homogenates were separated on SDS-PAGE, transferred to nitrocellulose membranes and probed overnight at 4°C with various primary antibodies at a 1:500 dilution, and fluorochrome-coupled secondary antibodies (Rockland, Gilbertsville, PA) were used at a 1:20,000 dilution for 15 minutes at room temperature for detection using Odyssey Infrared Imaging System (Li-Cor Biosciences, Lincoln, NE). For the activated AT1 and AT2 immunoblots, electrophoresis was carried out under non-denaturating conditions, using a low concentration of antibodies (1:1500 dilution).
2.6
Polysome assay was performed as previously described [9, 10]. Slices of kidney cortex were homogenized in 0.4 ml of resuspension buffer containing: 10 mM Tris (pH 7.5), 250 mM KCl, 2 mM MgCl2. A 10% Tween-80, 5% (w/v) deoxycholate mix was added to the lysates, which were centrifuged for 10 min at 14,000 rpm. The post-nuclear supernatants were laid on top of a 15-40% sucrose gradient, and centrifuged for 90 min at 200,000 × g. After ultracentrifugation, the gradients were separated into 4 fractions, and RNA was extracted from each fraction using Trizol (Invitrogen, Carlsbad, CA). Semi-quantitative RT-PCR amplification of VEGF or glyceraldehyde 3-phosphate dehydrogenase (GAPDH) transcript was performed in polyribosomal fractions using the Superscript One-Step RT-PCR kit (Invitrogen), and the primers previously described [9].
2.7
Association of hnRNP K with VEGF mRNA was performed as described [11, 14]. Briefly, kidney cortices were homogenized in resuspension buffer and used for immunoprecipitation using anti hnRNP K antibody. After extensive wash, RNA was extracted and RT-PCR amplification of VEGF or GAPDH transcript was performed as described above. PCR products were analyzed by electrophoresis on agarose gel.
2.8
Phosphatase 2A (PP2A) activity was measured using an immunoprecipitation phosphatase assay kit from Millipore (Temecula, CA) according to the manufacturer's instruction. Equal amounts of renal cortical homogenates (250 μg) were used for immunoprecipitation for each sample. Immunoprecipitation using a non-immune serum was carried out as a negative control.
2.8) Statistics
Data from a minimum of three experiments were expressed as mean ± SEM and analyzed by ANOVA for comparison among multiple groups using Newman-Keuls post-test analysis (GraphPad Prizm®) and Student's t-test was used for comparison between two groups; p <0.05 was considered significant.
3) Results
3.1) Induction of hyperglycemia in mice and effect of angiotensin receptors antagonists
We used streptozotocin (STZ) to induce hyperglycemia in mice, as described in the Methods section. Blood glucose was monitored daily: mice became hyperglycemic (> 250 mg/dl) 4 days after the last STZ injection. At that point, angiotensin receptor antagonists (ZD7155, a long-acting AT1 antagonist [15] or PD123319, an AT2 antagonist) or vehicle were injected subcutaneously and mice were sacrificed 24 hours after injection. We chose to study an early time-point when mechanisms of rapid control of protein synthesis, such as activation of mRNA translation, are activated. STZ-injected mice became significantly hyperglycemic (299.2 ± 15.5 vs 154.1 ± 5.3 mg/dl, p<0.01), and injection of AT1 or AT2 antagonists, alone (283.0 ± 3.1 and 292.6 ± 21.0 mg/dl, respectively, p<0.01 vs control) or in combination (323.2 ± 15.4 mg/dl, p<0.01 vs control), did not affect hyperglycemia.
3.2) Ang II synthesis and receptor activation in diabetic kidney cortex
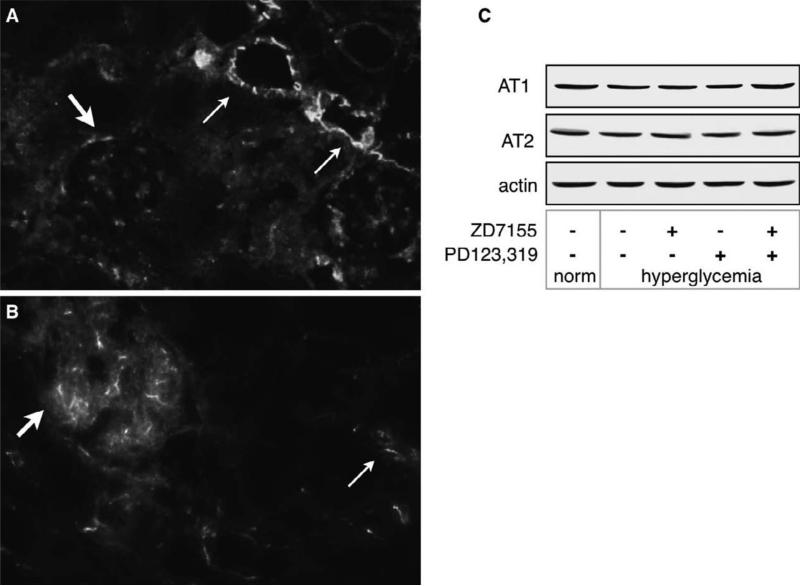
We examined Ang II receptor expression in kidney sections from normoglycemic mice by immunofluorescence using antibodies directed against the extracellular domain of AT1 and AT2. Figure 1 shows that AT1 is strongly expressed in the apical and lateral membranes of the tubules, and in glomerular mesangial cells (Fig. 1A), and that AT2 is expressed mostly in glomerular endothelial cells and in the proximal tubules (Fig. 1B). Not all glomeruli and tubules are positive for angiotensin receptor immunostaining in normoglycemic kidneys.We used the same antibodies to detect AT1 and AT2 kidney cortex homogenates and found that AT1 was detected as a ~ 40 kDa band and AT2 as a ~ 50 kDa band (Fig. 1C).
Figure 1. Angiotensin receptors are expressed in normal murine kidneys.
AT1 (A) and AT2 (B) were detected in kidney slices as described in the methods section. Arrows indicate localization of AT1 and AT2. Magnification = 20X. AT1 is strongly expressed in the apical and lateral membranes of the tubules (thin arrows), and in mesangial cells (thick arrow),.AT2 is expressed mostly in glomerular endothelial cells (thick arrow) and in the proximal tubules (thin arrow). The pictures are representative of kidneys from 2 individual mice. C) detection of AT1 and AT2 by western blot in kidney cortex homogenates using the same antibodies as in A and B.
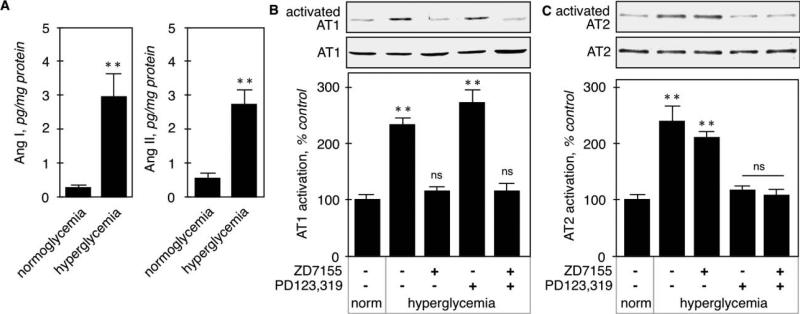
We then measured Ang II content by ELISA and found that both contents of both Ang I and Ang II were significantly increased in hyperglycemic kidney cortex (Fig. 2A). Ang II receptor activation was assessed by immunoblot using conformation-specific antibodies that bind preferentially to amino-terminal sequences that are exposed only when the receptor is occupied by its ligand [16]. Figure 2B shows that total AT1 expression was unchanged by acute hyperglycemia or treatment with the receptor antagonists. Basal activation of AT1 in kidney cortex from control animals was increased in hyperglycemic animals (233 ± 12%, p<0.001 by ANOVA) and this increased activation was reversed by the AT1 antagonist (116 ± 8%, p<0.001 vs control by ANOVA), but not the AT2 antagonist (271 ± 24%, p<0.001 vs control, NS vs STZ by ANOVA). Similar to AT1, the expression of AT2 was not altered by the various treatments (Fig. 2B). Basal AT2 activation was increased by hyperglycemia (239 ± 31%, p<0.001 by ANOVA, and was brought back to basal level by the AT2 antagonist (118 ± 6%, p<0.001 vs STZ, NS vs control by ANOVA), but not the AT1 antagonist (211 ± 10%, p<0.001 vs control, NS vs STZ by ANOVA). These data show that acute hyperglycemia activates both AT1 and AT2 receptors in the kidney cortex, and confirm the specificity of the AT1 and AT2 antagonists.
Figure 2. Ang I and Ang II synthesis and receptor activation in hyperglycemic kidneys.
A. Angiotensin (Ang I and Ang II) concentration in kidney cortex homogenates was determined by ELISA. **p<0.01 by Student's t-test. Activation of AT1 (B) and AT2 (C) was assessed on kidney cortex homogenates by immunoblot using conformation-specific antibodies. For each analysis, loading control was assessed by detection of the corresponding receptor, regardless of its activation state, using antibodies directed against the extracellular part of the receptors. The lower panel shows combined data obtained on kidneys from 5 individual mice in each group. **p<0.01, ns = not significant by ANOVA.
3.3) VEGF expression is increased in hyperglycemic kidneys due to increased mRNA translation
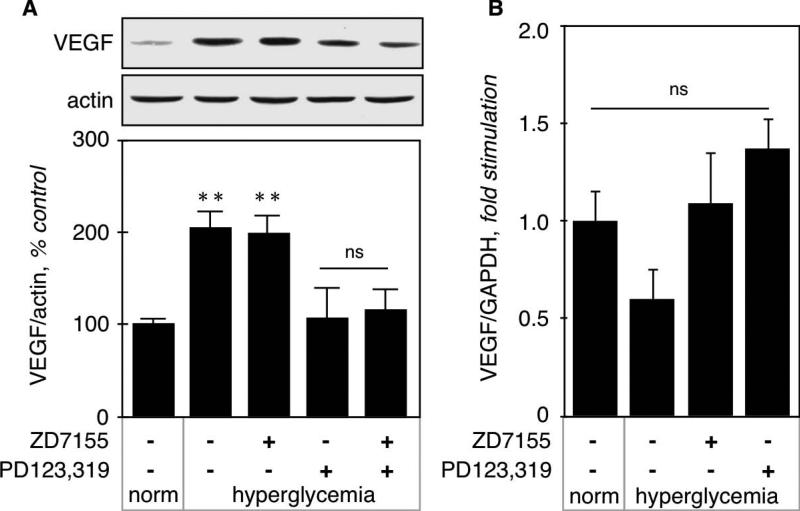
VEGF expression in kidney cortex from normo- and hyperglycemic mice was measured by immunoblot. Figure 3A shows that hyperglycemia significantly increased VEGF expression (208 ± 17%, p<0.001 vs control by ANOVA) that was not affected by the AT1 antagonist (202 ± 18%, p<0.001 vs control, NS vs STZ by ANOVA), but was prevented by the AT2 antagonist (108 ± 16%, NS vs control, p<0.001 vs STZ by ANOVA). We next examined VEGF expression at the mRNA level by RT-qPCR (Fig. 3B), and found no significant difference between the experimental groups, although there was a tendency for decrease in hyperglycemic kidneys. These data indicate that increased VEGF expression in kidney cortex by acute hyperglycemia is not due to increased transcription of its gene, but could be due to increased translation of its mRNA.
Figure 3. VEGF synthesis in hyperglycemic kidneys.
A. VEGF expression at the protein level was measured on kidney cortex homogenates by immunoblot using a monoclonal antibody directed against VEGF. Actin was used as a loading control. The lower panel shows combined data obtained on kidneys from 5 individual mice for each experimental condition. B. VEGF expression at the mRNA level was measured by RT-qPCR as described in the Methods section. Data was obtained on RNA extracted from kidneys from 5 individual mice for each experimental condition. **p<0.01, ns = not significant by ANOVA.
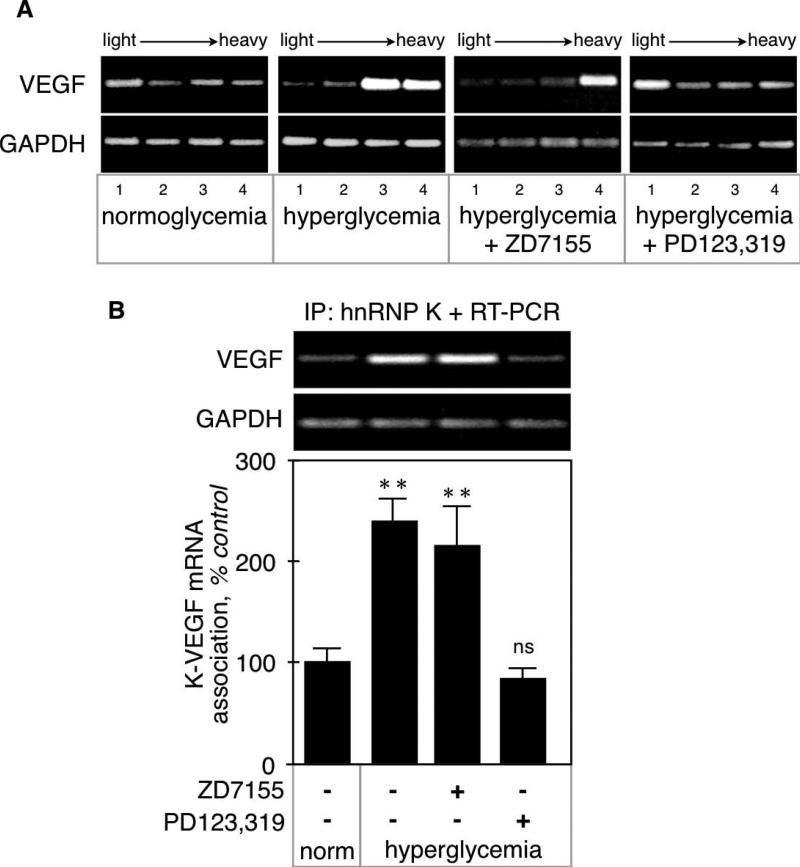
VEGF mRNA translation was assessed by polysome assay. During the initiation phase of mRNA translation, several 80S ribosomal units bind to the target mRNA forming a polysome. Upon ultracentrifugation on a sucrose gradient, polysomes segregate to the densest fractions whereas “naked” mRNAs are found in the lightest fractions [17]. In kidney cortex from normoglycemic mice, VEGF mRNA was evenly distributed in all the polysomal fractions. In contrast, hyperglycemia triggered a selective enrichment of VEGF mRNA in the heaviest polysomal fractions (Fig. 4A), which indicates that it is actively translated. Polysomal profile for VEGF mRNA in renal cortex from hyperglycemic mice given the AT1 antagonist was similar to that of untreated hyperglycemic mice. These data suggest that AT1 does not mediate the increased translation of VEGF mRNA in hyperglycemic mice. Only the AT2 receptor antagonist reversed the redistribution of VEGF mRNA toward the heaviest polysomal fractions, resulting in a polysomal profile similar to that of normoglycemic mice.
Figure 4. VEGF mRNA translation in hyperglycemic kidneys.
A. VEGF mRNA translation was studied by polysome assay. The shift of VEGF mRNA toward the heaviest fractions in diabetic kidneys indicates active translation, and is reversed by the AT2 but not the AT1 antagonist. Note that the distribution of GAPDH mRNA is unaffected by the various treatments. The figure is representative of experiments performed on kidneys from 3 individual mice. B. Association of hnRNP K with VEGF mRNA was studied by immunoprecipitation with anti-hnRNP K antibody followed by extraction of associated RNA associated and RT-PCR. Note that hnRNP K is constitutively associated with both VEGF and GAPDH mRNAs and that only the association with VEGF mRNA is increased in diabetic kidneys. The figure is representative of experiments performed on kidneys from 3 individual mice. **p<0.01, ns = not significant by ANOVA.
We have previously shown that in proximal tubular epithelial cells in culture, binding of heterogeneous ribonucleoprotein K (hnRNP K) to the VEGF mRNA stimulated its translation [11]. We thus investigated whether hyperglycemia affected hnRNP K binding to the VEGF mRNA in kidney cortex. Constitutive binding of hnRNP K to VEGF mRNA in normoglycemic kidney cortex was significantly increased by hyperglycemia (239 ± 23%, p<0.01 vs control by ANOVA; Fig. 4B). Increased binding was not affected by the AT1 antagonist (217 ± 39%, p<0.01 vs control, NS vs STZ by ANOVA), but was prevented by the AT2 antagonist (89 ± 10%, NS vs control, p<0.01 vs STZ by ANOVA).
3.4) Signaling pathways activated in diabetic kidneys
It has been established that mRNA translation is under the control of multiple signaling pathways, particularly the Akt-mTOR signaling pathway [17-19], and we have previously shown that this is indeed the case in proximal tubular epithelial cells in culture [9, 10].
3.4.1
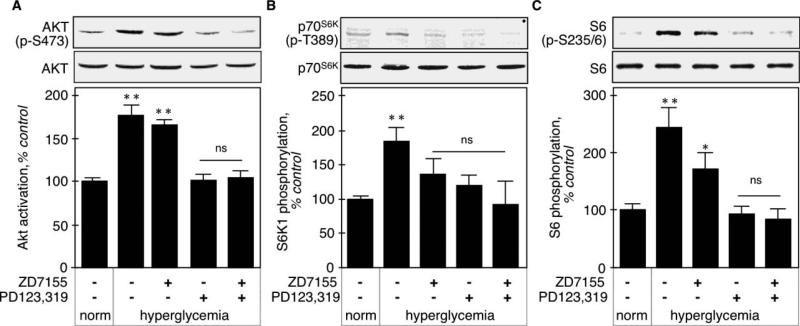
We monitored Akt activation in kidney cortex by assessing its activating phosphorylation on Thr473. Figure 5A shows that hyperglycemia increased Akt activation in the kidney cortex (178 ± 11%, p<0.001 vs control by ANOVA) that was prevented by the AT2 antagonist (102 ± 6%, p<0.001 vs STZ, NS vs control by ANOVA), but not the AT1 antagonist (167 ± 5%, NS vs STZ, p<0.001 vs control ANOVA).
Figure 5. activation of Akt-mTOR-p70S6K in hyperglycemic kidneys.
A. Akt activation was assessed by measuring the activating phosphorylation on Thr473 by immunoblot using a phospho-specific antibody. Total Akt was used as a loading control. The lower panel shows combined data obtained on kidneys from 5 individual mice for each experimental condition. B. mTOR activity was assessed by phosphorylation of its substrate, p70S6K, on Thr389 by immunoblot using a phospho-specific antibody. Actin was used as a loading control. The lower panel shows combined data obtained on kidneys from 4 individual mice for each experimental condition. C. p70S6K activity was assessed by phosphorylation of Ser235/236 on its substrate, ribosomal protein S6, by immunoblot using a phospho-specific antibody. Total S6 was used as a loading control. The lower panel shows combined data obtained on kidneys from 5 individual mice for each experimental condition. **p<0.01, *p<0.05, ns = not significant by ANOVA.
3.4.2
mTOR activity was assessed by phosphorylation of its substrate, p70S6K, on Thr389 [20]. Figure 5B shows that hyperglycemia activated mTOR (185.0 ± 19.5%, p<0.01 vs control ANOVA), and this was prevented by either AT1 or AT2 antagonist, alone or in combination (137.0 ± 22.6%, p<0.05 vs STZ by ANOVA, 121 ± 14%, p<0.05 vs STZ by ANOVA, and (116 ± 10%, p<0.05 vs STZ by ANOVA, respectively).
3.4.3
p70S6K activity was assessed by phosphorylation of its substrate, S6, on Ser235/236 [21]. Figure 5C shows that acute hyperglycemia increased S6 phosphorylation on these residues (244 ± 32%, p<0.001 vs control by ANOVA), and this is significantly, albeit incompletely, inhibited by the AT1 antagonist (173 ± 26%, p<0.05 vs STZ, p<0.05 vs control by ANOVA). The AT2 receptor antagonist prevented the increase in S6 phosphorylation (95 ± 10%, p<0.001 vs STZ, NS vs control by ANOVA).
3.5) Elongation phase of mRNA translation is activated in diabetic kidneys
The elongation phase of mRNA translation is regulated at the level of binding of aminoacyl-transfer RNAs (tRNAs) to the A-site and of their translocation from A- to P-site on the 80S ribosome, by eEF1A and eEF2, respectively [17]. eEF1A is constitutively active and is regulated at the level of expression [17]. The control of eEF2 is more complex: it is kept inactive by phosphorylation on Thr56 by eEF2 kinase (eEF2K), and eEF2K is inactivated by p70S6K-dependent phosphorylation on Ser366 [22]. eEF2 activation requires both inactivation of eEF2K and activation of a phosphatase that belongs to the PP2A family [23].
3.5.1
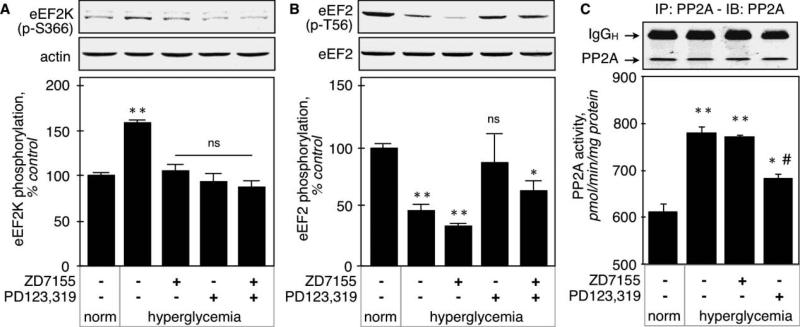
eEF2K inactivation in renal cortex was assessed by monitoring its phosphorylation on Ser366. Figure 6A shows that this phosphorylation was increased by hyperglycemia (159 ± 3%, p<0.001 vs control by ANOVA), and that both AT1 and AT2 antagonists prevented this increase (106 ± 6%, p<0.001 vs STZ by ANOVA, and 95 ± 8%, p<0.001 vs STZ by ANOVA, respectively). These data show that eEF2K inactivation in renal cortex in early diabetes is mediated by both AT1 and AT2 receptors. This is consistent with inhibition of p70S6K by both AT1 and AT2 antagonists.
Figure 6. activation of elongation phase of mRNA translation in hyperglycemic kidneys.
A. eEF2K inactivation was assessed by measuring the inactivating phosphorylation on Ser366 by immunoblot using a phospho-specific antibody. Actin was used as a loading control. The lower panel shows combined data obtained on kidneys from 5 individual mice for each experimental condition. B. eEF2 activation was assessed by measuring the dephosphorylation of Thr56 by immunoblot using a phospho-specific antibody. Total eEF2 was used as a loading control. The lower panel shows combined data obtained on kidneys from 5 individual mice for each experimental condition. C. PP2A activity was measured as described in the Methods section in kidney homogenates from 5 individual mice for each experimental condition. The upper immunoblot shows a representative sample of immunoprecipitation of PP2AC. **p<0.01 vs normoglycemic, #p<0.05 vs hyperglycemic by ANOVA.
3.5.2
eEF2 activation was measured by dephosphorylation of Thr56. Figure 6B shows that hyperglycemia decreased the phosphorylation of eEF2 on Thr56 (47 ± 5%, p<0.01 vs control by ANOVA), and that the AT2 antagonist (87 ± 23%, p<0.001 vs STZ, NS vs control by ANOVA), but not AT1 antagonist (34 ± 2%, NS vs STZ, p<0.001 vs control by ANOVA) prevented eEF2 dephosphorylation. The inability of AT1 to induce dephosphorylation of eEF2 occurs in spite of inactivation of eEF2K, the upstream kinase. These data indicate that AT1 fails to activate the phosphatase that is responsible for dephosphorylation of eEF2. We next measured the activity of PP2A, which is involved in eEF2 dephosphorylation [23]. The catalytic subunit of PP2A was immunoprecipitated and the immunoprecipitates used in an in vitro phosphatase assay. Figure 6C shows that basal PP2A activity (613 ± 19 pmol phosphate/min/mg protein) was significantly increased by hyperglycemia (781 ± 4 pmol/min/mg, p<0.01 vs control), and that losartan, the AT1 antagonist, did not affect it (773 ± 5 pmol/min/mg, NS vs STZ). The AT2 antagonist partially inhibited PP2A activity (684 ± 1 pmol/min/mg, p<0.05 vs control and vs STZ). This result confirms that PP2A activation by hyperglycemia is mediated in part by AT2, but not AT1.
3.5.3
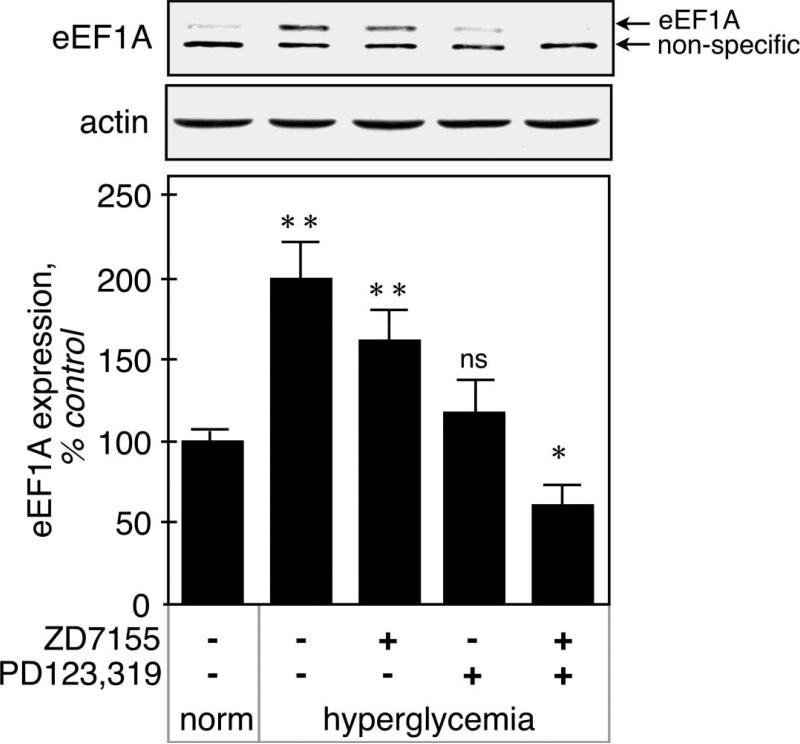
Figure 7 shows that eEF1A expression, measured by immunoblot, was increased by hyperglycemia in kidney cortex (200 ± 24%, p<0.001 vs control by ANOVA). The AT1 antagonist had a tendency to decrease its expression, but the difference did not reach significance (162 ± 19%, NS vs STZ, p<0.05 vs control by ANOVA). The AT2 antagonist returned eEF1A expression to basal level (132 ± 8%, ns vs control by ANOVA), and surprisingly, administration of both AT1 and AT2 antagonists decreased eEF1A expression below control level (61 ± 12%, p<0.05 vs control by ANOVA), significantly more that the AT2 antagonist alone.
Figure 7. Regulation of eEF1A expression in hyperglycemic kidneys.
eEF1A expression was measured by immunoblot using a specific antibody. Actin was used as a loading control. The position of eEF1A (~50 kDa) is shown by the upper arrow, and the lower arrow indicates a non-specific 45 kDa band detected by the antibody. The lower panel shows combined data obtained on kidneys from 5 individual mice for each experimental condition. **p<0.01, *p<0.05, ns = not significant by ANOVA.
3.6) Specificity of translational control of VEGF expression
3.6.1
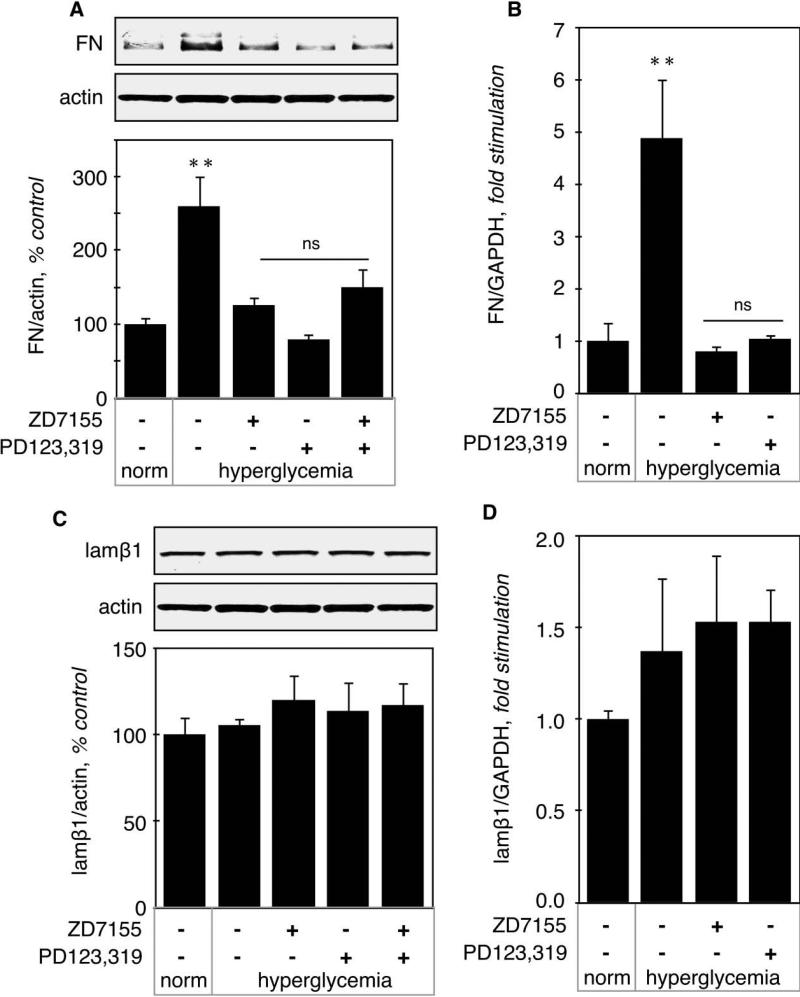
Regulation of matrix fibronectin (FN) expression. Renal content of FN was significantly increased in hyperglycemic mice both at the protein level (260 ± 42%, p<0.01 vs control, Fig. 8A) and the mRNA level (488 ± 113%, p<0.01 vs control, Fig. 8B), This increase was prevented by either AT1 or AT2 antagonist (Fig. 8A-B). These data suggest that increased FN expression is due to increased transcription and mediated by both AT1 and AT2.
Figure 8. Regulation of fibronectin and laminin β1 expression in hyperglycemic kidneys.
A. Fibronectin (FN) protein level was measured by immunoblot using a specific antibody. The lower panel shows combined data obtained on kidneys from 5 individual mice for each experimental condition. B. FN mRNA level was measured by RT-qPCR. Data was obtained on RNA extracted from kidneys from 5 individual mice for each experimental condition. Identical experiments were performed for protein level (C) and mRNA level (D) of laminin β1. **p<0.01, ns = not significant by ANOVA.
3.6.2
Regulation of laminin β1 (lamβ1) expression. Lamβ1 is a component of the glomerular basement membrane. Lamβ1 expression was not affected by hyperglycemia either at the protein (105 ± 4%, NS vs control, Fig. 8C) or at the mRNA level (137 ± 0.4, NS vs control, Fig. 8D). Together, these data show that stimulation of synthesis of individual proteins exclusively by mRNA translation by hyperglycemia is not a general phenomenon; it was seen with VEGF but not other renal proteins such as FN or laminin β1.
3.7) Studies in AT2KO mice
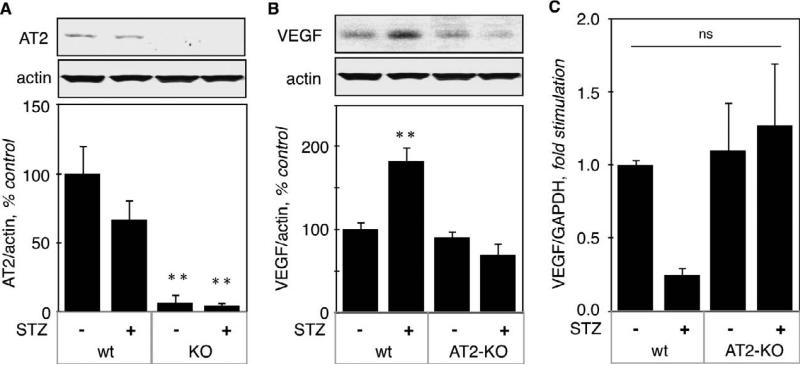
To confirm a role for AT2 in the regulation of VEGF mRNA translation, we studied AT2 knockout mice (AT2 KO) and their wild type control (AT2wt). STZ-injected AT2KO mice became highly hyperglycemic (582 ± 18 mg/dl, p<0.001 vs control). STZ also induced hyperglycemia in AT2wt (231 ± 27 mg/dl, p<0.01 vs control), although hyperglycemia was less severe than in AT2 KO mice. Figure 9A shows that AT2 was absent in kidney cortex from AT2KO mice and that acute hyperglycemia did not significantly affect expression of AT2.
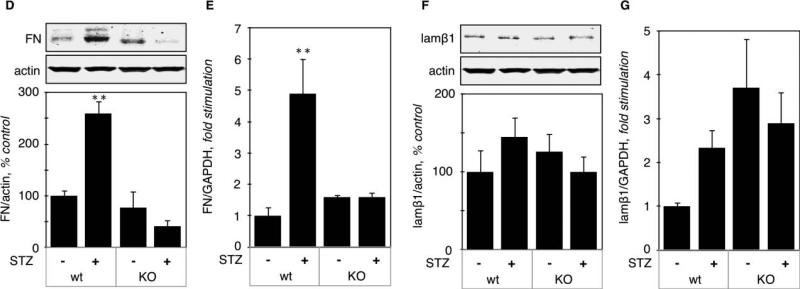
Figure 9. Regulation of VEGF, fibronectin and laminin β1 expression in kidneys from hyperglycemic AT2KO mice.
A. AT2 protein level was measured by immunoblot using a specific antibody. The lower panel shows combined data obtained on kidneys from 5 individual mice for each experimental condition. B. VEGF protein (B) and mRNA (C) levels were measured by immunoblot and RT-qPCR, respectively, on the same number of kidneys as in panel A. Identical experiments were performed for the protein and mRNA levels of fibronectin (D - E) and laminin β1 (F - G). **p<0.01, ns = not significant by ANOVA.
3.7.1
Regulation of VEGF expression. Renal content of VEGF protein was increased by acute hyperglycemia (183 ± 17%, p<0.001 vs wt control) in AT2wt mice, but not in AT2 KO mice (69 ± 14%, ns vs KO control) (Fig. 9B). VEGF mRNA was not significantly affected by acute hyperglycemia in either ATwt or AT2KO mice (Fig. 9C), although we did observe a decrease in VEGF mRNA, which did not reach statistical significance by ANOVA. It is possible that acute hyperglycemia stimulates translation of an existing pool of VEGF mRNA, leading to its eventual depletion.
3.7.2
Regulation of FN expression: in AT2wt mice, hyperglycemia increased FN expression both at the protein (259 ± 30 %, p<0.01 vs control, Fig. 9D) and mRNA level (489 ± 11, p<0.01 vs control, Fig. 9E), but in AT2KO mice, hyperglycemia failed to increase FN expression, at either protein or mRNA level (Fig. 9D-E).
3.7.3
Regulation of lamβ1 expression. Figure 9F-G shows that lamβ1 expression was not affected by acute hyperglycemia in either AT2KO or wt mice.
4) Discussion
Our data demonstrate the following in mice: (1) Both AT1 and AT2 are activated in renal cortex by acute hyperglycemia. (2) Increased mRNA translation significantly contributes to hyperglycemia-induced increase in VEGF expression. (3) Increased VEGF synthesis is mediated by the AT2, but not the AT1 receptor. (4) Exclusive control of expression of individual proteins by translation is not a general phenomenon; while it was seen with VEGF it did not seem to be involved in regulation of FN or laminin β1.
4.1) Roles of AT1 and AT2 receptors in the kidney
Ang II is a major mediator of kidney injury, and has been implicated in the development of fibrosis as well as inflammation. It has been shown that Ang II, acting through the AT1 receptor, promotes synthesis of pro-fibrotic factors, such as connective tissue growth factor (CTGF) [24] and subsequent accumulation of extracellular matrix protein [25]. Ang II also promotes the infiltration of monocytes into the kidney, which is due to increased expression of adhesion molecules, pro-inflammatory cytokines and chemokines by kidney cells [26]. Although it was initially thought that this inflammatory response was mediated by the AT2 receptor alone [27], subsequent experiments have shown that only combined inhibition of AT1 and AT2 with specific antagonists caused complete inhibition this inflammatory response and decreased the number of infiltrating cells as well as expression of proinflammatory cytokines [28].
Expression of several growth factors, such as transforming growth factor-beta (TGF-β), CTGF and VEGF, is increased in diabetic nephropathy. There is evidence that increased expression of these growth factors in the diabetic kidney is due to activation of local renin-angiotensin system [1]. We investigated the regulation of VEGF synthesis by hyperglycemia in mouse renal cortex.
4.2) Stimulation of VEGF synthesis
We have previously shown that VEGF was expressed strongly in proximal tubules and more weakly in the distal tubules and glomeruli [9]. Since both AT1 and AT2 are expressed in the proximal tubule (Fig. 1), we sought to evaluate if one or both of them were involved in the regulation of VEGF synthesis by hyperglycemia. Our data using specific antagonists of AT1 and AT2 indicated that AT2 is predominantly in control of renal cortical VEGF expression in hyperglycemic mice. VEGF protein but not mRNA was increased in renal cortex of hyperglycemic mice, suggesting that regulation of VEGF synthesis occurs at the level of mRNA translation, rather than gene transcription. Polysome assay confirmed that VEGF mRNA translation initiation is increased by hyperglycemia.
Elongation phase is a critical step of mRNA translation. During this phase, peptide elongation occurs by systematic addition of amino acids in accordance with the codon sequence in the mRNA [17]. Elongation phase is regulated at the level of binding of amino-acyl tRNAs to the A-site and of their translocation from A- to P-site on the ribosome, by eEF1A and eEF2, respectively [17].
4.3) Specificity of translational control of VEGF expression
To study the specificity and selectivity of the translational control of VEGF expression, we chose two extracellular matrix proteins, FN and lamβ1. We chose FN because it is known to be regulated at the transcriptional level in the heart of mice with STZ-induced type 1 diabetes [29], and lamβ1 because it has been shown to be regulated at the translation level in kidney from mice with type 1 diabetes [30] and in renal proximal epithelial cells in culture in response to high glucose [31]. We found that acute hyperglycemia was sufficient to induce transcriptional activation of the FN gene, but that at the same time, lamβ1 expression was not changed. Our results are different from those described in Ha et al. [30]; however, Ha et al studied mice with type 2 diabetes after at least 1 month of diabetes, indicating that stimulation of lamβ1 mRNA translation by hyperglycemia could take a few day to set in. Expression of other proteins, such as vascular cell adhesion molecule 1 and E-selectin, was not affected by acute hyperglycemia in our current study (data not shown). These data do not prove that translational regulation of individual protein expression is selective to VEGF, but indicate that it is not a generalized phenomenon.
4.4) eEF2 activation
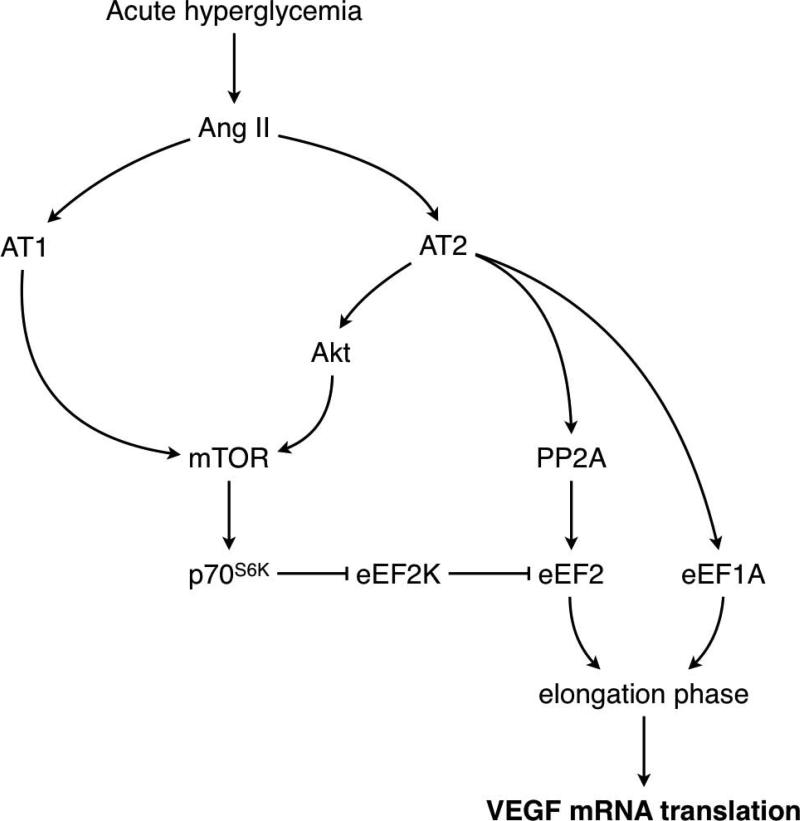
eEF2 is kept inactive by phosphorylation of Thr56 by eEF2K and activated by dephosphorylation by protein phosphatase 2A (PP2A) [32]. Because protein phosphorylation is a covalent modification, activation of eEF2 requires inactivation of eEF2K, achieved by phosphorylation on Ser366 by p70S6K [22], as well as by activation of PP2A [23]. Our data show that during acute hyperglycemia, both AT1 and AT2 contribute to eEF2K inactivation, but that only AT2 mediates eEF2 dephosphorylation. Measure of PP2A confirmed that AT2, but not AT1, is involved in activation of PP2A by hyperglycemia (Fig. 10). This is similar to neurons, in which AT2 has been shown to activate PP2A [33]. However, in cardiomyocytes, Ang II activates eEF2 through dephosphorylation by PP2A through stimulation of the AT1 receptor [23]. Thus, regulation of PP2A by AT1 or AT2 appears to be tissue-specific. Our study shows that both AT1 and AT2 receptors are activated in kidney cortex by acute hyperglycemia, and that they activate different signaling pathways. AT2 activates the Akt-mTOR signaling cascade leading to p70S6K-dependent activation of eEF2, and it also leads to increased expression of eEF1A. This combined activation stimulates the elongation phase of mRNA translation and increases VEGF mRNA translation (Fig. 10). AT1 activation leads to Akt-independent activation of mTOR, and inactivation of eEF2K, but fails to activate eEF2 and to increase eEF1A expression. Therefore AT1 does not appear to stimulate the elongation phase of mRNA translation in the renal cortex in acute hyperglycemia (Fig. 10).
Figure 10. Signaling pathways activated by AT1 and AT2 in diabetic kidneys.
The diagram depicts a summary of the data obtained in this study. AT1 activation by hyperglycemia activates mTOR independently of Akt and leads to inactivation of eEF2K but is not sufficient to cause the dephosphorylation and activation of eEF2. Activation of AT2 stimulates the Akt-mTOR pathway that inactivates eEF2K and activates PP2A that dephosphorylates eEF2; AT2 also mediates hyperglycemia-induced increment in eEF1A. Activation of eEF2 and up-regulation of eEF1A stimulate elongation phase of mRNA translation, leading to increased translation of VEGF mRNA.
4.5) Roles of VEGF in the kidney
VEGF has been shown to play an important role in type 1 diabetes in rodents. Cooper et al. have shown that expression of VEGF and its receptor VEGF-R2, as well as binding activity of VEGF, are increased in kidneys from mice with early type 1 diabetes [2]. De Vries et al. found that administration of a neutralizing anti-VEGF antibody prevents hyperglycemia-induced structural and functional microvascular alterations in rats with type 1 diabetes [34]. Regulation of VEGF by Ang II receptors has been studied by others. Increased VEGF expression in retinas from rats with type 1 diabetes was mediated by both AT1 and AT2 receptors [35]; likewise, upregulation of VEGF in the glomeruli of rats infused with Ang II was mediated by AT1 and AT2 [36]. These data indicate that the regulation of VEGF synthesis by AT2 could be a general phenomenon in diabetes.
4.6) Role of AT2 in kidney disease
AT2 is thought to generally oppose the actions of AT1. Although this has well been demonstrated for the hemodynamic effects of AT1 [37, 38], the situation appears more complex in other pathways. In mice with myocardial infarction, it has been shown that activation of AT2 plays an important role in the therapeutic effect of AT1 blockade [39, 40]. In mice with 5/6 nephrectomy, indices of renal injury, such as proteinuria and glomerulosclerosis, were significantly worse in AT2 knockout mice [41] or after administration of an AT2 receptor antagonist [42]. In atherosclerotic arteries, delivery of AT2 with an adenovirus system decreased collagen accumulation in atherosclerotic plaques [43]. On the other hand, in subtotally nephrectomized rats, proteinuria, expression of nephrin in the podocytes, and monocyte infiltration in the kidney were all reduced to the same extent by the AT1 and the AT2 antagonists [44]. In rats with STZ-induced type 1 diabetes, renal AT2 receptor has been shown to worsen natriuresis [45]. These data indicate that AT2 activation contributes to injury phenotype in diabetic kidney disease.
5) Conclusions
Our study shows that hyperglycemia increases VEGF expression in the diabetic kidney through activation of the AT2 receptor, and suggests that chronic inhibition of renal AT2 receptor could be further explored for its beneficial effect on diabetic nephropathy.
6) Acknowledgements
This work has been supported by the American Heart Association (grant SDG 0630283N to DF), the National Institute of Health (grants DK061597 to BSK and JLB, DK077295 and RC2AGO36613 to BSK), the American Diabetes Association (grant 7-05-RA-60 to BSK), and the Veterans Administration Research Service (to BSK and JLB). We would like to express our gratitude to Dr Victor Dzau (Duke University) for the generous gift of the AT2KO mice.
Footnotes
Publisher's Disclaimer: This is a PDF file of an unedited manuscript that has been accepted for publication. As a service to our customers we are providing this early version of the manuscript. The manuscript will undergo copyediting, typesetting, and review of the resulting proof before it is published in its final citable form. Please note that during the production process errors may be discovered which could affect the content, and all legal disclaimers that apply to the journal pertain.
7) References
- 1.Rincon-Choles H, Kasinath BS, Gorin Y, Abboud HE. Kidney Int Suppl. 2002;(82):8–11. doi: 10.1046/j.1523-1755.62.s82.3.x. [DOI] [PubMed] [Google Scholar]
- 2.Cooper ME, Vranes D, Youssef S, Stacker SA, Cox AJ, Rizkalla B, Casley DJ, Bach LA, Kelly DJ, Gilbert RE. Diabetes. 1999;48(11):2229–2239. doi: 10.2337/diabetes.48.11.2229. [DOI] [PubMed] [Google Scholar]
- 3.de Vriese AS, Tilton RG, Elger M, Stephan CC, Kriz W, Lameire NH. J Am Soc Nephrol. 2001;12(5):993–1000. doi: 10.1681/ASN.V125993. [DOI] [PubMed] [Google Scholar]
- 4.Gilbert RE, Vranes D, Berka JL, Kelly DJ, Cox A, Wu LL, Stacker SA, Cooper ME. Lab Invest. 1998;78(8):1017–1027. [PubMed] [Google Scholar]
- 5.Wilkinson-Berka JL, Kelly DJ, Gilbert RE. J Vasc Res. 2001;38(6):527–535. doi: 10.1159/000051088. [DOI] [PubMed] [Google Scholar]
- 6.Kim BS, Chen J, Weinstein T, Noiri E, Goligorsky MS. J Am Soc Nephrol. 2002;13(8):2027–2036. doi: 10.1097/01.asn.0000024436.00520.d8. [DOI] [PubMed] [Google Scholar]
- 7.Iglesias-de la Cruz MC, Ziyadeh FN, Isono M, Kouahou M, Han DC, Kalluri R, Mundel P, Chen S. Kidney Int. 2002;62(3):901–913. doi: 10.1046/j.1523-1755.2002.00528.x. [DOI] [PubMed] [Google Scholar]
- 8.Feliers D, Kasinath BS. Mol Cell Endocrinol. 2010;314(1):136–142. doi: 10.1016/j.mce.2009.09.009. [DOI] [PMC free article] [PubMed] [Google Scholar]
- 9.Feliers D, Duraisamy S, Barnes JL, Ghosh-Choudhury G, Kasinath BS. Am J Physiol Renal Physiol. 2005;288(3):F521–529. doi: 10.1152/ajprenal.00271.2004. [DOI] [PubMed] [Google Scholar]
- 10.Feliers D, Gorin Y, Ghosh-Choudhury G, Abboud HE, Kasinath BS. Am J Physiol Renal Physiol. 2006;290(4):F927–936. doi: 10.1152/ajprenal.00331.2005. [DOI] [PubMed] [Google Scholar]
- 11.Feliers D, Lee MJ, Ghosh-Choudhury G, Bomsztyk K, Kasinath BS. Am J Physiol Renal Physiol. 2007;293(2):F607–615. doi: 10.1152/ajprenal.00497.2006. [DOI] [PubMed] [Google Scholar]
- 12.Senthil D, Choudhury GG, McLaurin C, Kasinath BS. Kidney Int. 2003;64(2):468–479. doi: 10.1046/j.1523-1755.2003.00135.x. [DOI] [PubMed] [Google Scholar]
- 13.Faulkner JL, Szcykalski LM, Springer F, Barnes JL. Am J Pathol. 2005;167(5):1193–1205. doi: 10.1016/S0002-9440(10)61208-4. [DOI] [PMC free article] [PubMed] [Google Scholar]
- 14.Sataranatarajan K, Lee MJ, Mariappan MM, Feliers D. Cell Signal. 2008 doi: 10.1016/j.cellsig.2008.01.016. [DOI] [PMC free article] [PubMed] [Google Scholar]
- 15.Junggren IL, Zhao X, Sun X, Hedner T. J Pharm Pharmacol. 1996;48(8):829–833. doi: 10.1111/j.2042-7158.1996.tb03983.x. [DOI] [PubMed] [Google Scholar]
- 16.Gupta A, Decaillot FM, Gomes I, Tkalych O, Heimann AS, Ferro ES, Devi LA. J Biol Chem. 2007;282(8):5116–5124. doi: 10.1074/jbc.M609254200. [DOI] [PMC free article] [PubMed] [Google Scholar]
- 17.Kasinath BS, Mariappan MM, Sataranatarajan K, Lee MJ, Feliers D. J Am Soc Nephrol. 2006;17(12):3281–3292. doi: 10.1681/ASN.2006050488. [DOI] [PubMed] [Google Scholar]
- 18.Ruggero D, Sonenberg N. Oncogene. 2005;24(50):7426–7434. doi: 10.1038/sj.onc.1209098. [DOI] [PubMed] [Google Scholar]
- 19.Mariappan MM, Senthil D, Natarajan KS, Choudhury GG, Kasinath BS. J Biol Chem. 2005;280(31):28402–28411. doi: 10.1074/jbc.M504861200. [DOI] [PubMed] [Google Scholar]
- 20.Brown EJ, Beal PA, Keith CT, Chen J, Shin TB, Schreiber SL. Nature. 1995;377(6548):441–446. doi: 10.1038/377441a0. [DOI] [PubMed] [Google Scholar]
- 21.Shima H, Pende M, Chen Y, Fumagalli S, Thomas G, Kozma SC. Embo J. 1998;17(22):6649–6659. doi: 10.1093/emboj/17.22.6649. [DOI] [PMC free article] [PubMed] [Google Scholar]
- 22.Browne GJ, Proud CG. Mol Cell Biol. 2004;24(7):2986–2997. doi: 10.1128/MCB.24.7.2986-2997.2004. [DOI] [PMC free article] [PubMed] [Google Scholar]
- 23.Everett AD, Stoops TD, Nairn AC, Brautigan D. Am J Physiol Heart Circ Physiol. 2001;281(1):H161–167. doi: 10.1152/ajpheart.2001.281.1.H161. [DOI] [PubMed] [Google Scholar]
- 24.Ruperez M, Lorenzo O, Blanco-Colio LM, Esteban V, Egido J, Ruiz-Ortega M. Circulation. 2003;108(12):1499–1505. doi: 10.1161/01.CIR.0000089129.51288.BA. [DOI] [PubMed] [Google Scholar]
- 25.Ruperez M, Ruiz-Ortega M, Esteban V, Lorenzo O, Mezzano S, Plaza JJ, Egido J. Am J Pathol. 2003;163(5):1937–1947. doi: 10.1016/S0002-9440(10)63552-3. [DOI] [PMC free article] [PubMed] [Google Scholar]
- 26.Ruiz-Ortega M, Lorenzo O, Suzuki Y, Ruperez M, Egido J. Curr Opin Nephrol Hypertens. 2001;10(3):321–329. doi: 10.1097/00041552-200105000-00005. [DOI] [PubMed] [Google Scholar]
- 27.Wolf G, Ziyadeh FN, Thaiss F, Tomaszewski J, Caron RJ, Wenzel U, Zahner G, Helmchen U, Stahl RA. J Clin Invest. 1997;100(5):1047–1058. doi: 10.1172/JCI119615. [DOI] [PMC free article] [PubMed] [Google Scholar]
- 28.Esteban V, Ruperez M, Vita JR, Lopez ES, Mezzano S, Plaza JJ, Egido J, Ruiz-Ortega M. Kidney Int Suppl. 2003;(86):S33–38. doi: 10.1046/j.1523-1755.64.s86.7.x. [DOI] [PubMed] [Google Scholar]
- 29.Kaur H, Chen S, Xin X, Chiu J, Khan ZA, Chakrabarti S. Diabetes. 2006;55(11):3104–3111. doi: 10.2337/db06-0519. [DOI] [PubMed] [Google Scholar]
- 30.Ha TS, Barnes JL, Stewart JL, Ko CW, Miner JH, Abrahamson DR, Sanes JR, Kasinath BS. J Am Soc Nephrol. 1999;10(9):1931–1939. doi: 10.1681/ASN.V1091931. [DOI] [PubMed] [Google Scholar]
- 31.Mariappan MM, Feliers D, Mummidi S, Choudhury GG, Kasinath BS. Diabetes. 2007;56(2):476–485. doi: 10.2337/db05-1334. [DOI] [PubMed] [Google Scholar]
- 32.Proud CG, Denton RM. Biochem J. 1997;328(Pt 2):329–341. doi: 10.1042/bj3280329. [DOI] [PMC free article] [PubMed] [Google Scholar]
- 33.Huang XC, Richards EM, Sumners C. J Biol Chem. 1996;271(26):15635–15641. doi: 10.1074/jbc.271.26.15635. [DOI] [PubMed] [Google Scholar]
- 34.De Vriese AS, Tilton RG, Stephan CC, Lameire NH. J Am Soc Nephrol. 2001;12(8):1734–1741. doi: 10.1681/ASN.V1281734. [DOI] [PubMed] [Google Scholar]
- 35.Zhang X, Lassila M, Cooper ME, Cao Z. Hypertension. 2004;43(2):276–281. doi: 10.1161/01.HYP.0000113628.94574.0f. [DOI] [PubMed] [Google Scholar]
- 36.Rizkalla B, Forbes JM, Cooper ME, Cao Z. J Am Soc Nephrol. 2003;14(12):3061–3071. doi: 10.1097/01.asn.0000099374.58607.c9. [DOI] [PubMed] [Google Scholar]
- 37.Hein L, Barsh GS, Pratt RE, Dzau VJ, Kobilka BK. Nature. 1995;377(6551):744–747. doi: 10.1038/377744a0. [DOI] [PubMed] [Google Scholar]
- 38.Ichiki T, Labosky PA, Shiota C, Okuyama S, Imagawa Y, Fogo A, Niimura F, Ichikawa I, Hogan BL, Inagami T. Nature. 1995;377(6551):748–750. doi: 10.1038/377748a0. [DOI] [PubMed] [Google Scholar]
- 39.Xu J, Carretero OA, Liu YH, Shesely EG, Yang F, Kapke A, Yang XP. Hypertension. 2002;40(3):244–250. doi: 10.1161/01.hyp.0000029095.23198.ad. [DOI] [PubMed] [Google Scholar]
- 40.Oishi Y, Ozono R, Yoshizumi M, Akishita M, Horiuchi M, Oshima T. Life Sci. 2006;80(1):82–88. doi: 10.1016/j.lfs.2006.08.033. [DOI] [PubMed] [Google Scholar]
- 41.Benndorf RA, Krebs C, Hirsch-Hoffmann B, Schwedhelm E, Cieslar G, Schmidt-Haupt R, Steinmetz OM, Meyer-Schwesinger C, Thaiss F, Haddad M, Fehr S, Heilmann A, Helmchen U, Hein L, Ehmke H, Stahl RA, Boger RH, Wenzel UO. Kidney Int. 2009;75(10):1039–1049. doi: 10.1038/ki.2009.2. [DOI] [PubMed] [Google Scholar]
- 42.Naito T, Ma LJ, Yang H, Zuo Y, Tang Y, Han JY, Kon V, Fogo AB. Am J Physiol Renal Physiol. 2010;298:F683–F691. doi: 10.1152/ajprenal.00503.2009. [DOI] [PMC free article] [PubMed] [Google Scholar]
- 43.Dandapat A, Hu CP, Chen J, Liu Y, Khan JA, Remeo F, Carey RM, Hermonat PL, Mehta JL. Biochem Biophys Res Commun. 2008;366(4):871–877. doi: 10.1016/j.bbrc.2007.11.061. [DOI] [PubMed] [Google Scholar]
- 44.Cao Z, Bonnet F, Candido R, Nesteroff SP, Burns WC, Kawachi H, Shimizu F, Carey RM, De Gasparo M, Cooper ME. J Am Soc Nephrol. 2002;13(7):1773–1787. doi: 10.1097/01.asn.0000019409.17099.33. [DOI] [PubMed] [Google Scholar]
- 45.Hakam AC, Siddiqui AH, Hussain T. Am J Physiol Renal Physiol. 2006;290(2):F503–508. doi: 10.1152/ajprenal.00092.2005. [DOI] [PubMed] [Google Scholar]


