Abstract
Electrochemical immunosensors using vertically aligned single wall carbon nanotube (SWNT) forests can provide ultrasensitive, accurate cancer biomarker protein assays. Herein we report a systematic investigation of the structure, thickness and functionality of each layer of these immunosensors using atomic force microscopy (AFM), quartz crystal microbalance (QCM) and scanning white light interferometry (SWLI). This provides a detailed picture of the surface morphology of each layer along with surface concentration and thickness of each protein layer. Results reveal that the major reasons for sensitivity gain can be assigned to the dense packing of carboxylated SWNT forest tips, which translate to a large surface concentration of capture antibodies, together with the high quality of conductive SWNT forests.
Introduction
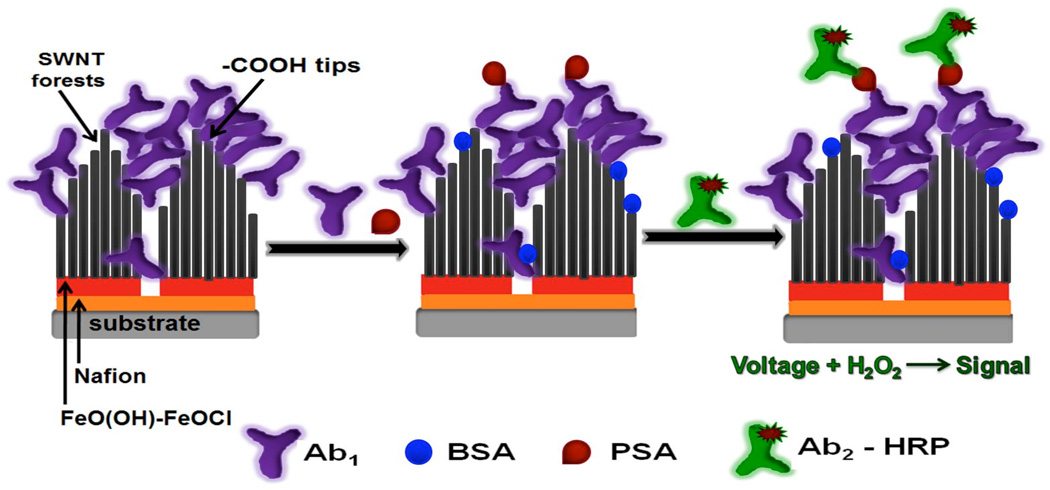
Carbon nanotubes (CNTs) are promising nanomaterials for fabrication of nanodevices,1–5 sensors,6–9 and high-aspect-ratio scanning microscopy probes.10–12 We have used single wall carbon nanotubes (SWNTs) in upright "forest" configurations13 to develop ultrasensitive electrochemical immunosensors14,15 for cancer biomarker proteins such as prostate specific antigen (PSA detection limit (DL) of 4 pg mL−1),16 interleukin-6 (IL-6, DL of 0.5 pg mL−1),17 and simultaneous detection of four prostate cancer biomarkers in human serum.18 We also used SWNT forests to develop an electrochemiluminescent immunosensor for proteins.19 These sensors feature 20–30 nm long, dense, terminally carboxylated, SWNT forests13 with capture antibodies attached to their ends (Figure 1). In typical amperometric sandwich immunoassays, antibodies on the sensor selectively capture analyte proteins from the sample, and an enzyme-labeled secondary antibody is added that binds to the analyte and generates an appropriate electrochemical signal.
Figure 1.
Strategy for amperometric SWNT forests immunosensors. On left in the SWNT forests assembly followed by the immunosensor that has been equilibrated with analyte protein PSA (center), along with biomaterials used in the assay protocol. On right, the immunosensor has been treated with enzyme-labeled secondary antibody: HRP-Ab2 (HRP = horseradish peroxidase). Detection involves immersing the sensor in an electrochemical cell containing buffer and mediator, applying voltage and injecting a small amount of hydrogen peroxide (H2O2) to activate HRP for amperometric reduction of H2O2.
The SWNT forest platform itself has consistently provided a 3–10 fold gain in sensitivity over immunosensors fabricated on flat carboxylated carbon surfaces without nanotubes.14–16,20 We have speculated that reasons for this may include a high density of antibodies on the high surface area nanostructured surface, and SWNT catalysis.14,15 In this paper, scanning probe microscopy, optical reflectance and quartz microbalance techniques.21–23 were used for sequential characterization of each layer of the nanostructured SWNT forest immunosensors to elucidate surface morphologies, surface concentrations and thicknesses for each protein layer. Results confirm for the first time that a major reason for the sensitivity gain is the large surface area of SWNT forests that together with their densely populated carboxylate tips enable large concentrations of capture antibodies on the sensor surface.
Experimental Section
Chemicals and Materials
Monoclonal (mouse) primary antihuman prostate specific antigen (PSA) antibody (clone no. CHYH1, MW 150 000 Da), tracer secondary anti-PSA antibody (clone no. CHYH2) with HRP conjugation (MW 184 000 Da) and PSA (MW 33 000 Da) standard in calf-serum were obtained from Anogen/Yes Biotech Lab, Ltd. Bovine serum albumin (BSA) and Tween-20 were obtained from Sigma-Aldrich. Single wall carbon nanotubes (Hipco) were procured from Carbon Nanotechnologies, Inc. Immunoreagents were dissolved in pH 7.0 phosphate saline (PBS) buffer (0.01 M phosphate, 0.14 M NaCl, 2.7 mM KCl). 1-(3-(dimethylamino)-propyl)-3-ethylcarbodiimide hydrochloride (EDC) and N-hydroxysulfosuccinimide (Sulfo-NHS) from Sigma were dissolved in water immediately before use.
Instrumentation
A Veeco Nanoscope IV Multimode Atomic Force Microscope (AFM) in AC mode (Tapping mode) was used for imaging. Weight and thickness were measured using Quartz Crystal Microbalance (QCM, USI Japan) Au-coated resonators (9 MHz, AT-cut, International Crystal Mfg.) and 3D non-contact Scanning White Light Interferometer (Zygo NewView 5000, Zygo Corp., Middlefield, CT). A Renishaw Ramanscope 2000 using 1.58 eV (785 nm) excitation laser focused on a <1 µm spot by 50× objective was used to obtain the Raman spectra of SWNT forests.
Sample preparation for AFM imaging
Nafion is an amphiphilic polymer that absorbs tremendous amounts of cations, and their corresponding counter ions. SWNT forests were assembled onto mica from aged dispersions of 20–30 nm oxidatively shortened SWNTs dispersed in dimethylformamide (DMF) using previously reported methods.14–16,20 Briefly, on a nm-thickness underlayer of Nafion and FeO(OH)-FeOCl, substrates were immersed into aged DMF dispersions (3 to 16 weeks after preparation) of shortened, carboxylated SWNTs prepared by ultrasonication in acid. Dense, vertical assemblies of SWNT forests were formed, which were washed with methanol and dried. Capture antibody (Ab1) was covalently linked by first depositing 30 µL of freshly prepared 400 mM EDC and 100 mM NHSS in water to the SWNT forests and washing with water after 10 min. This was followed by incubation for 3 h with 20 µL of 2 nmol mL−1 (0.33 mg mL−1) primary anti-PSA antibody (Ab1) in pH 7.0 PBS buffer containing 0.05% Tween-20. The substrate was then washed successively with 0.05% Tween-20 in PBS buffer and PBS buffer to remove unreacted antibody, followed by washing with pure water. The anti-PSA/SWNT sensor on mica was incubated for 1 h with 20 µL of 2% BSA + 0.05% Tween-20, followed by thorough washing with 0.05% Tween-20 in PBS buffer, PBS buffer and pure water to remove loosely bound BSA. The substrate was then incubated for 1.25 h with 10 µL of 40 ng mL−1 PSA in undiluted calf serum,16 followed by another thorough washing with 0.05% Tween-20 in PBS buffer, PBS buffer and with pure water to remove excess salt. In the last step, the immunosensor was incubated with 4 pmol mL−1 singly labeled secondary antibody (Ab2)-HRP in PBS buffer containing 0.05% Tween-20 for 1.25 h, followed by successive washing with 0.05% Tween-20 in PBS buffer, PBS buffer and pure water.
Quartz Crystal Microbalance monitoring of assembly
A quartz crystal microbalance (QCM, USI System) was used with Au-coated quartz QCM resonators coated with sensor layers as above. After each washing, QCM resonators were dried in a stream of nitrogen and the frequency change for dried films was measured at ambient temperature.
The Sauerbrey equation relates adsorbed mass to frequency shift ΔF (Hz) in the absence of viscoelasticity changes, and for 9 MHz quartz resonators, gives film mass per unit area M/A (g cm−2)24 as
| (1) |
Nominal thicknesses (d) of dry films on 0.16 cm2 quartz resonators was estimated using density (ρ') of each film from the previously validated expression24
| (2) |
Scanning White Light Interferometry (SWLI)
Films were fabricated on glass, and the thickness of each layer was measured by SWLI25–28 after drying at room temperature. Measurements were made at five different locations on the glass slide to assess uniformity, giving variation in film thickness <5%. Film thickness at the center of the glass slide was found to be characteristic of average values, and measurements were carried out at this location.
Results
Immunosensors were fabricated using Nafion/FeO(OH)-FeOCl to anchors the SWNT forest assembly.8 Capture antibodies (Ab1) were covalently linked to carboxylate ends of SWNTs using EDC/ NHSS coupling. The vacant spaces left by Ab1 were covered by blocking agent, 2% BSA + 0.05% Tween-20. The SWNT/Ab1 platform was incubated with 40 ng mL−1 PSA, followed by an incubation of electrochemically labeled secondary antibody (Ab2-HRP). Each incubation was followed by washing with 0.05% Tween-20 in PBS buffer and PBS buffer, to presumably remove any unbound protein. These procedures were identical to those used in previous immunosensor protocols.8,16,18
Atomic Force Microscopy (AFM)
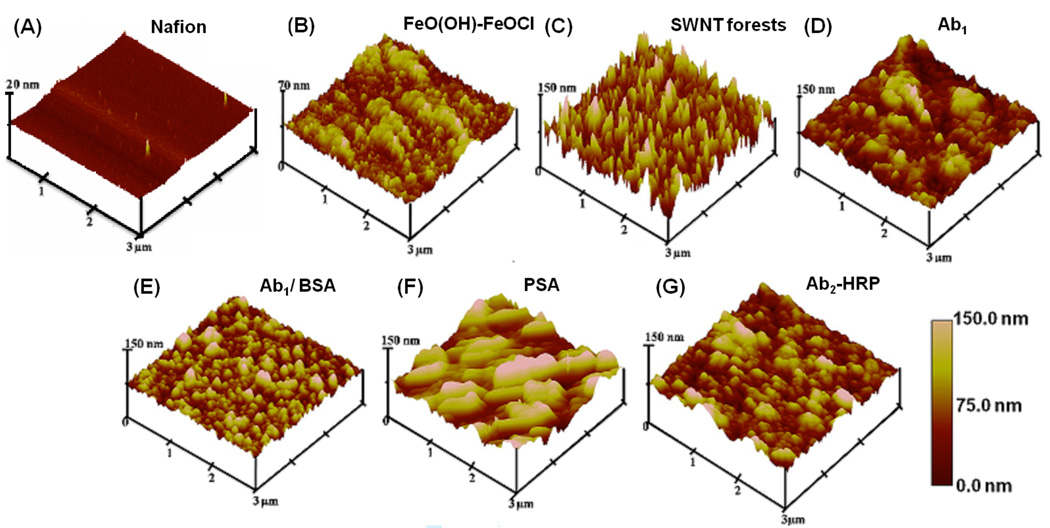
Tapping mode AFM images of each layer of the SWNT immunosensor assembly were acquired on 3 × 3 µm sections of freshly cleaved mica (see experimental section) (Figure 2). SWNT forests made from 3 month aged DMF dispersions of shortened, oxidized SWNTs feature a dense vertical assembly with high surface roughness and nearly full coverage of the underlying layer (Figure 2B), as reported previously.20 The spiky SWNT forest features in Figure 2C disappeared after anti-PSA antibody was covalently linked onto the nanotube forests to yield a globular coating featuring humps and valleys (Figure 2D). This general globular appearance is maintained with the sequential addition of various other protein layers (Figures 2E,F,G).
Figure 2.
Tapping mode atomic force microscope images of layers (top layers indicated) in sensor fabrication and use: (A) Nafion on freshly cleaved mica surface; (B) Nafion/FeO(OH)-FeOCl bilayer; (C) SWNT forests on Nafion/FeO(OH)-FeOCl bilayer; (D) after covalent linkage of 2 nmol mL−1 primary anti-PSA antibody (Ab1) in pH 7.0 PBS buffer + 0.05% Tween-20 followed by washing with 0.05% Tween-20, PBS buffer and water; (E) after addition of 2% BSA in 0.05% Tween-20 PBS buffer onto antibody layer and washing with 0.05% Tween-20, PBS buffer and water; (F) after addition of 40 ng mL−1 PSA in calf serum and washing with 0.05% Tween-20, PBS buffer and water; (G) after addition of 4 pmol mL−1 singly labeled secondary antibody (Ab2)-HRP in 0.05% Tween-20 followed by washing with buffer solutions and water.
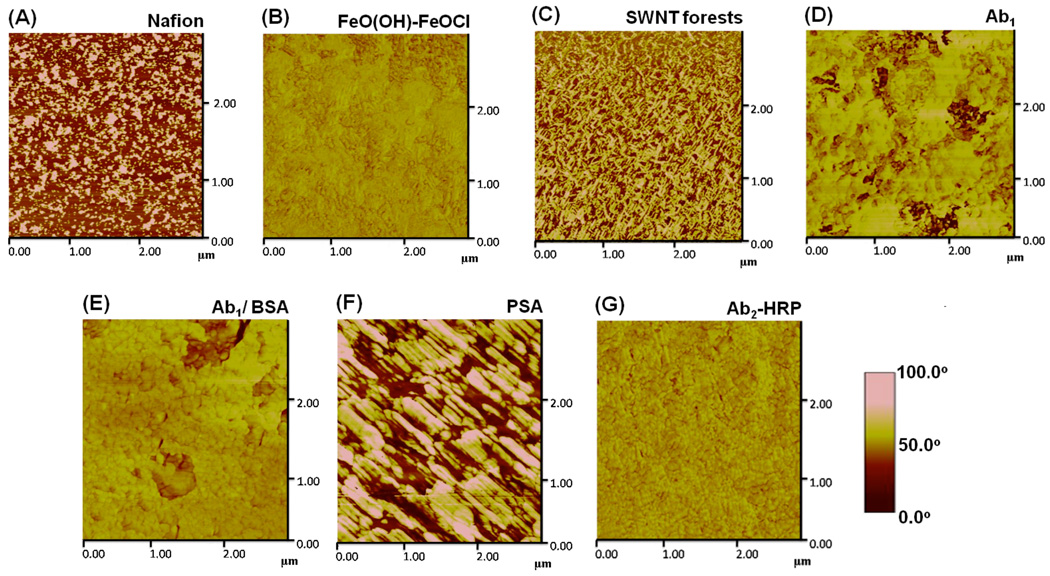
Phase contrast AFM enables a more detailed imaging of surface composition via monitoring spatial stiffness and viscoelastic properties.29 Figure 3 shows the phase contrast images corresponding to Figure 2 at each layer of the immunosensor assembly. These images provide significantly more contrast than the topographic images in Figure 2. The phase contrast image of a Nafion film on mica suggests a patchy deposit with an average feature size of 1.5 nm and width of 100 nm (Figure 3A). The immersion of these substrates in pH 1.8 FeCl3 solution followed by washing in DMF afforded the nucleation and growth of a microstructured FeO(OH)-FeOCl precipitate.13 The structure of the FeO(OH)-FeOCl deposit, while considerably rougher than the underlying Nafion film (Figure 2A), shows a less patchy phase contrast image indicative of complete coverage with the FeO(OH)-FeOCl layer (Figure 3B and Table 1). The phase contrast image of the SWNT forests on the mica/Nafion/FeO(OH)-FeOCl substrate is shown in Figure 3C. The re-appearance of a patchy phase image originates from the non-uniform height and covering ability of these needle-like SWNT forests (Figure 3C). The phase image of primary anti-PSA antibody, covalently linked to nanotube forests, provides a more uniform coverage, but a small fraction of SWNT forests remain exposed (Figure 3D). After the addition of blocking agent, 2% BSA in 0.05% Tween-20, the surface gets fully covered with protein-based layers (either primary anti-PSA antibody or BSA) (Figure 3E). Addition of PSA in serum develops large elongated deposits. While the reason for such orientation is still elusive, a possible explanation might originate to the small MW of PSA (i.e. 33 000 Da), which might organize in such a fashion to maximize interactions with both the underlying SWNT/Ab1 substrate and itself. Subsequent addition of Ab2-HRP resulted in filling in the space within these elongated domains to minimize surface roughness (Figure 3G).
Figure 3.
Tapping mode phase contrast AFM images of layers (top layers indicated) in sensor fabrication and use: (A) Nafion on freshly cleaved mica; (B) Nafion/FeO(OH)-FeOCl bilayer; (C) SWNT forests on Nafion/ FeO(OH)-FeOCl bilayer; (D) after covalent linkage of primary anti-PSA antibody (Ab1) followed by washing with 0.05% Tween-20, PBS buffer and water; (E) after addition of 2% BSA in 0.05% Tween-20 PBS buffer onto antibody layer and washing with 0.05% Tween-20, PBS buffer and water; (F) after addition of 40 ng mL−1 PSA in calf serum and washing with 0.05% Tween-20, PBS buffer and water; (G) after addition of 4 pmol mL−1 Ab2-HRP in PBS buffer containing 0.05% Tween-20 followed by washing with buffer solutions and water.
Table 1.
Mean surface roughness of layers in PSA-SWNTs sensor assembly from AFMa
| surface layer architecture | mean surface roughness (nm) |
|---|---|
| mica/Nafion | 2.2 ± 0.6 |
| mica/Nafion/FeO(OH)-FeOCl | 14.5 ± 1.2 |
| mica/Nafion/FeO(OH)-FeOCl/SWNT forests | 21.1 ± 2.5 |
| mica/Nafion/FeO(OH)-FeOCl/SWNT forests/ primary anti-PSA antibody |
18.9 ± 2.2 |
| mica/Nafion/FeO(OH)-FeOCl/SWNT forests/ primary anti-PSA antibody/BSA |
18.5 ± 2.0 |
| mica/Nafion/FeO(OH)-FeOCl/SWNT forests/ primary anti-PSA antibody/BSA/PSA in calf serum |
16.3 ± 1.7 |
| mica/Nafion/FeO(OH)-FeOCl/SWNT forests/ primary anti-PSA antibody/BSA/PSA in calf serum/singly labeled secondary antibody |
14.2 ± 1.6 |
Surface roughness was estimated using Nanoscope ® IV Version 5.30r3.Sr3 software (Veeco).
Table 1 tabulates the mean surface roughness from these AFM images. The largest value has been recorded for the SWNT forests, and decreases after covalent linkage of proteins to SWNT forests. Treatment with blocking agent, 2% BSA in 0.05% Tween- 20 apparently fills in empty sites left in the film of capture antibodies, further reducing surface roughness.
Quartz Crystal Microbalance (QCM) Monitoring of Film Assembly
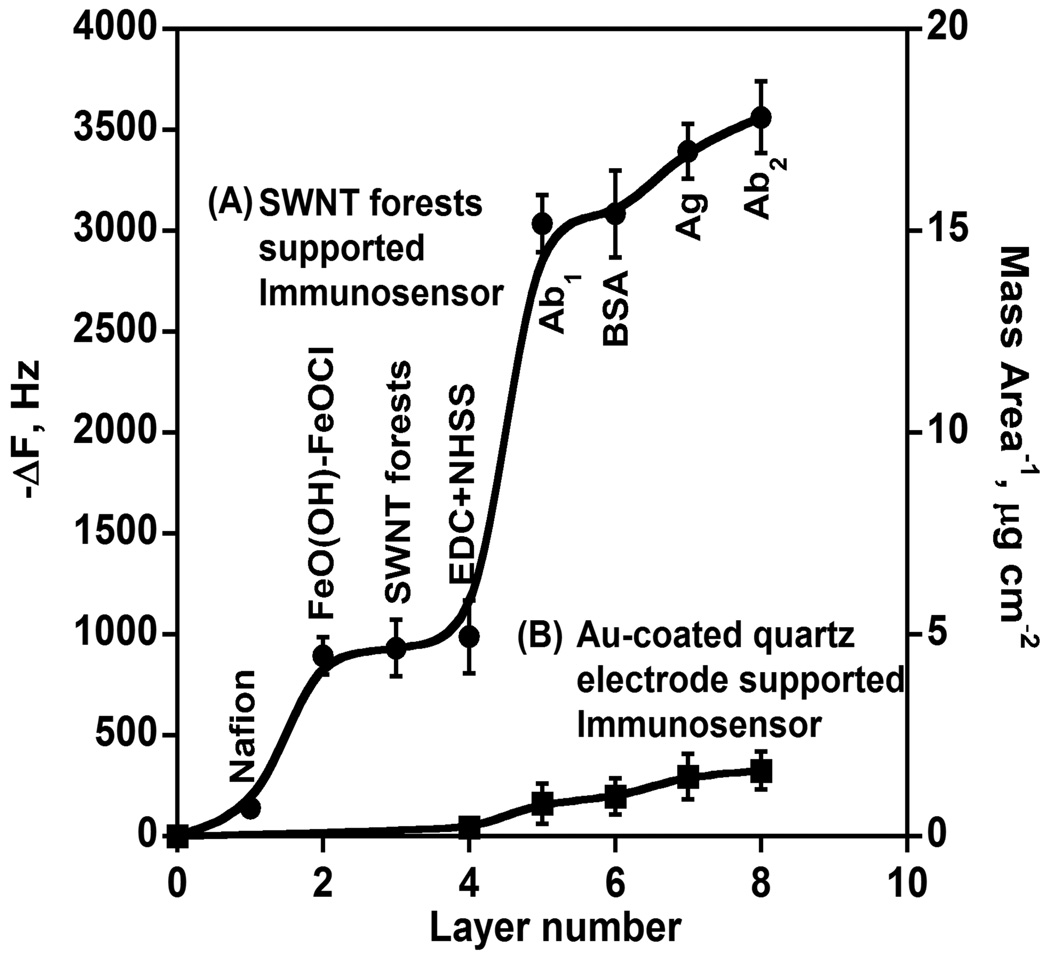
QCM was used to monitor the mass addition at each successive step in the fabrication of these immunosensors. Here the growth of these films was recorded on Au-coated quartz QCM resonators. Frequency shifts of dried assemblies decreased consistently with mass increase (eq 1) with the addition of layers until formation of the SWNT forests (Figure 4). Two major frequency shifts are recorded, one from the FeO(OH)-FeOCl inorganic layer growth and second from the addition of primary anti-PSA antibody. Smaller linear frequency shifts were measured upon addition of each new protein layer (BSA, PSA in calf serum, and Ab2-HRP). To mimic the partial coverage of carboxylate groups on pyrolytic graphite (PG) on the gold resonators,30 a partially carboxylated monolayer was made by treating the gold surface with a mixture of 0.7 mM 3-mercapto-1-propanol and 0.3 mM 3-mercaptopropionic acid in ethanol. This surface was used as a SWNT-free control, and has many fewer carboxylate groups than the SWNT forest assembly. The remaining sensor layers were added the same as for the SWNT forests immunosensor (Figure 4A). This control gave much smaller frequency decreases for all the proteins (Figure 4B). Another control sensor having the Nafion/FeO(OH)-FeOCl bilayer but no SWNTs (Figure S1, Supporting Information) showed almost negligible frequency change for all the proteins. These control results are consistent with the view that the density of carboxylate groups on SWNT forests is essential for high sensitivity.
Figure 4.
QCM frequency shifts (left) and mass per unit area (right) of layers in PSA immunosensors grown on (A) SWNT forests and (B) Au-coated quartz electrodes (control: no SWNTs): 1. Nafion; 2. Nafion/FeO(OH)-FeOCl bilayer; 3. SWNT forests on Nafion/ FeO(OH)-FeOCl bilayer; 4. 400 mM EDC and 100 mM NHSS in water; 5. after covalent linkage of 2 nmol mL−1 primary anti-PSA antibody (Ab1) in 0.05% Tween-20 PBS buffer to SWNT forests or 3-mercapto-1-propanol/ 3-mercaptopropionic acid layer in SWNT-free control sensor; 6. adsorption of 2% BSA in 0.05% Tween-20 PBS buffer onto antibody; 7. adsorption of 40 ng mL−1 PSA in calf serum; 8. adsorption of 4 pmol mL−1 Ab2-HRP in PBS containing 0.05% Tween-20.
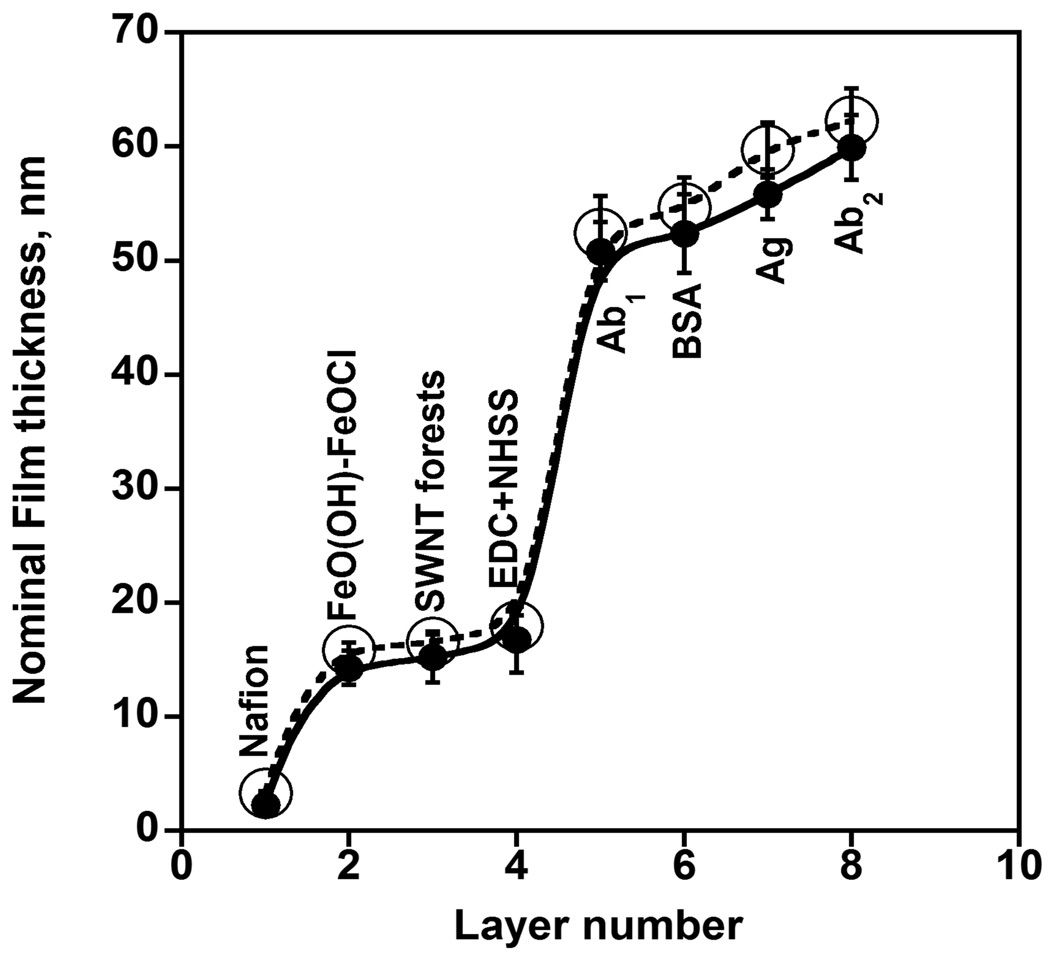
ΔF values and eq 1 were used to obtain weights of proteins in the immunosensor assemblies. Eq 2 was used to estimate the average nominal thicknesses (Table 2 and Figure 5). The layer thicknesses were obtainable using the density of Nafion (~ 1.3 g cm−3),24 FeO(OH)-FeOCl (~ 1.4 g cm−3),13 SWNTs (1.2 g cm−3), and protein-polyion films (~ 1.3 g cm−3).24 The low density of FeO(OH)-FeOCl oxide is due to its incomplete surface coverage, as shown in previous studies.31,32 Primary anti-PSA antibody layer was the thickest, consistent with the large size of immunoglobin G (IgG) antibody (MW 150 000 Da).33 The most striking difference in these data is that the weight of capture antibody (Ab1) on the SWNT immunosensor is 17-fold larger than that on the control without SWNT forests assembly.
Table 2.
Average characteristics of PSA immunosensor assembly from QCM results
| protein layer |
sensor type | wt. protein, µg cm−2 |
surface concentration, pmol cm−2 |
protein layer thickness, nm |
total thickness, nm |
|---|---|---|---|---|---|
| Ab1 | SWNT | 11.2 ± 0.4 | 862 ± 18 | 34.1 ± 1.1 | 50.8 ± 2.2 |
| Controla | 0.6 ± 0.3 | 50 ± 12 | 2.0 ± 0.4 | 2.6 ± 1.6 | |
| BSA | SWNT | 0.4 ± 0.04 | 6 ± 0.3 | 1.4 ± 0.04 | 52.2 ± 3.5 |
| Controla | 0.2 ± 0.2 | 2.9 ± 0.1 | 0.7 ± 0.03 | 3.3 ± 1.4 | |
| PSA | SWNT | 2.4 ± 0.2 | 72 ± 4 | 4.5 ± 0.2 | 56.8 ± 2.2 |
| Controla | 1.1± 0.1 | 33 ± 2 | 2.0 ± 0.2 | 5.3 ± 1.8 | |
| Ab2 | SWNT | 1.4 ± 0.1 | 7.6 ± 0.4 | 3.1 ± 0.1 | 59.9 ± 2.8 |
| Controla | 0.7 ± 0.1 | 3.8 ± 0.1 | 1.5 ± 0.1 | 6.8 ± 1.3 |
Control sensors (without SWNT forests assembly) = 0.7 mM 3-mercapto-1-propanol and 0.3 mM 3-mercaptopropionic acid in ethanol/ 2 nmol mL−1 Ab1 in 0.05% Tween-20 PBS buffer/ 2% BSA in 0.05% Tween-20 PBS buffer / 40 ng mL−1 PSA in calf serum/ 4 pmol mL−1 singly labeled Ab2-HRP in 0.05% Tween-20 PBS buffer.
Figure 5.
Thickness profile of each layer of PSA-SWNT immunoassembly determined using three-dimensional non-contact scanning white light interferometer (O) and quartz crystal microbalance (●). 1. Nafion was first deposited on the glass substrate followed by; 2. Nafion/ FeO(OH)-FeOCl bilayer; 3. SWNT forests on Nafion/ FeO(OH)-FeOCl bilayer; 4. 400 mM EDC and 100 mM NHSS in water; 5. after covalent linkage of 2 nmol mL−1 primary anti-PSA antibody (Ab1) in 0.05% Tween-20 PBS buffer to SWNT forests; 6. adsorption of 2% BSA in 0.05% Tween-20 PBS buffer onto antibody; 7. adsorption of 40 ng mL−1 PSA in calf serum; 8. 4 pmol mL−1 Ab2-HRP in PBS containing 0.05% Tween-20.
Scanning white light interferometry (SWLI)
SWLI offers a rapid, reliable and convenient way of performing surface thickness measurements. It involves Z-axis optical scanning in a non-contact mode, using white light, to construct a topological interferogram, which through algorithmic conversion is translated to height information.25,34 When the entire PSA-SWNT immunosensor assembly was monitored using SWLI, the total thickness of the sensor assembly was found to be 62.2 nm. This is in good agreement with the estimate of 59.9 nm from QCM. Figure 5 shows the thickness profile of each successive layer of this immunosensor assembly using SWLI. When these results are compared with the aforementioned QCM results, they show one-to-one correlation (Figure 5). In particular, average nominal thickness of the Nafion/FeO(OH)-FeOCl/SWNT assembly determined via QCM was 16.1 nm and by SWLI was and 17.2 nm, in reasonable agreement with the 25 nm step heights indicated from AFM analysis (Figure S2, Supporting Information) which may be prone to overestimation due to the presence of a fraction of longer vertical SWNTs in the assembly.
Resonance Raman Spectroscopy (RSS) of SWNT forests
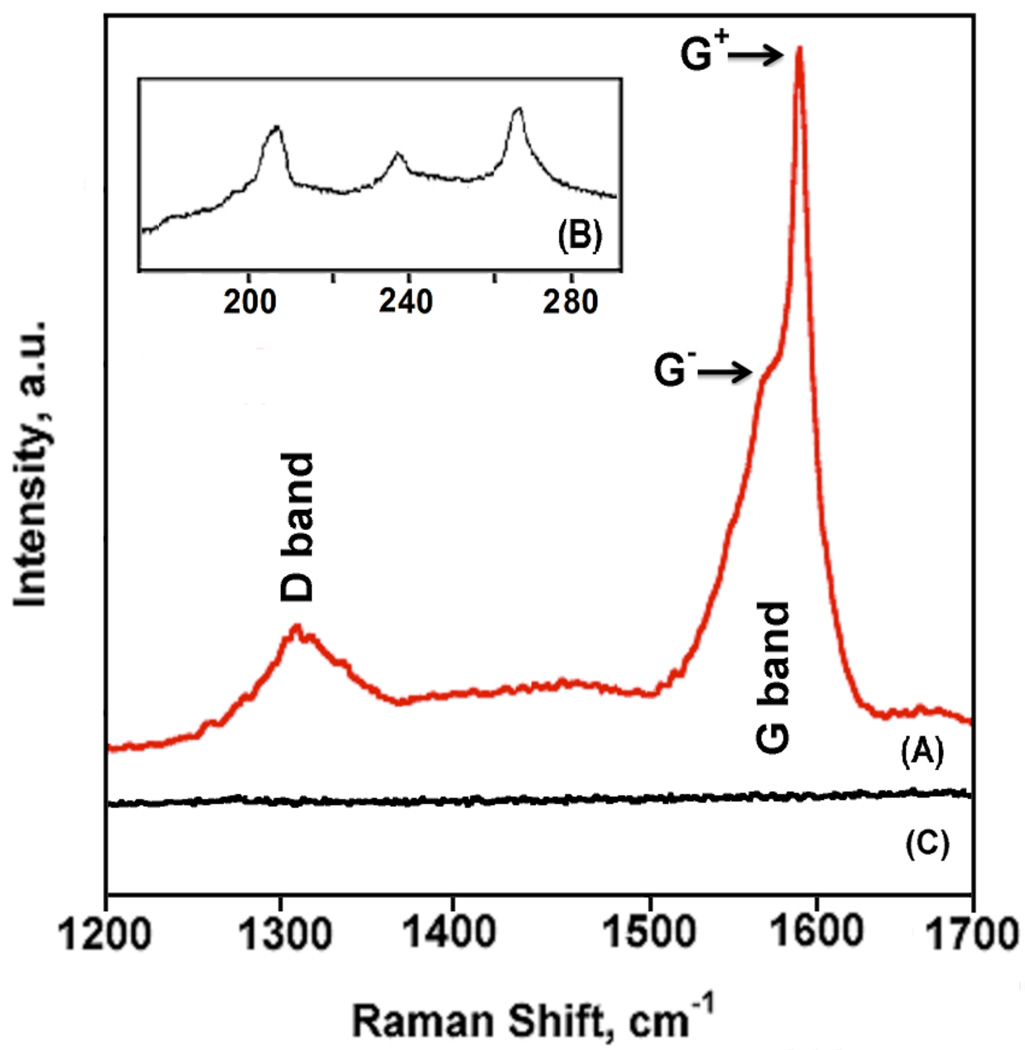
To investigate the purity of SWNTs on QCM quartz resonator, glass SWLI substrate, and mica as SWNT forests, RRS was performed on the same samples. Raman Spectroscopy is a valuable tool for detecting and characterizing SWNTs because it provides an insight into their purity.35,36 Figure 6 shows a 785 nm excitation resonance Raman spectrum of the SWNT forests assembly on the QCM resonator in the region of 1200 – 1700 cm−1, and the low frequency radial breathing mode (RBM) in the region of 170 – 290 cm−1 (Figure 6B). The strong resonance conditions of SWNTs allows excitation of only those (n,m) chirality nanotubes when their Eii transitions closely match that of Elaser.37 For HiPco SWNT samples, at 785 nm laser line, only semiconducting SE22 transitions are in resonance, which are manifested with the three characteristic RBM peaks at 209, 238, and 265 cm−1. The presence of these peaks indicates that these sem-SWNTs are relatively dope-free, as described elsewhere.38 Figure 6A shows the graphite- (G-) and defect- (D-) modes of the SWNT forests, which are also characteristic for all nanotube samples. The D-band, typically observed between 1250 and 1450 cm−1, originates from the first order scattering by in-plane hetero-atom substituents, vacancies or other finite size defects. Previous studies have shown the dependence of D-band width on prolonged aging of SWNTs in DMF.20 SWNT forests assembled from SWNTs/DMF dispersion aged for 12–15 weeks in DMF show well-defined D-band indicative of lack of doping, which translates to less charge-balancing counter ions and denser forests. The very fact that the observed D-band is well-defined and not broad corroborates with the aforementioned dope-free conclusion, which is also supported from the presence of sharp RBM peaks (Figure 6B). This in conjunction with the short length of the nanotubes within the forest (average height of 16.6 nm) indicate that the well defined 1320 cm−1 D-band in Figure 6A arise solely from nanotube defects, which are proportional to the carboxylate concentration at the nanotube tips.7 Similar Raman spectra of SWNT forests were observed on mica and glass substrates (Figures S3 and S4, Supporting Information).
Figure 6.
Resonance Raman spectra (785 nm excitation) showing (A) D-band at 1320 cm−1 and G-band at 1592 cm−1 for Nafion/FeO(OH)-FeOCl/SWNT forests on QCM gold resonator; (B) radial breathing mode (RBM) bands for Nafion/FeO(OH)-FeOCl/SWNT forests in low frequency region at 209 cm−1, 238 cm−1, and 265 cm−1; (C) control, bare Au.
Discussion
Results described above demonstrate the morphology and component amounts for successive fabrication of sensitive SWNT forest immunosensors for detection of proteins in serum. These SWNT forest immunosensors have consistently provided a 3–10 fold gain in sensitivity compared to nanotube-free geometries.14,15,16,20 This is a point of great of scientific and technological interest. Based on the data of Figure 4 and Table 2, one possible reason for enhanced sensitivity is the 17-fold larger amounts of Ab1 reported herein for the SWNT-forests architectures compared to flat sensors. The amount, however, of the Ab1-captured antigen (PSA) on the SWNT forests is only twice as much as that of nanotube-free sensors (Table 2). Since the 2 to 1 ratio is further maintained in the subsequent Ab2 binding event, the remaining 1.5–5 times signal amplification by the presence of nanotube forests have to be accounted for elsewhere. This could possibly be attributed to a number of novel features associated with SWNT forests: (i) nanostructured quality of electrodes, promoting more efficient diffusion of analyte (H2O2) and mediator (hydroquinone (HQ)),39,40 (ii) high surface area of the nanotube forest,15 also facilitating the very high surface antibody concentration (iii) electrocatalytic activity on the tips of SWNTs due to the presence of various oxygenated species,41and (iv) pristine nature of nanotubes which allow large intrinsic conductivity of carriers along their length.38,42 While more than one of these reasons might be applicable in the case of SWNTs, the aforementioned four factors will be discussed in light of the current and previously reported data. These issues are discussed further below.
Andrleux et al.39 have previously reported that microstructured electrodes experience greater diffusional flux of analyte and can be employed for ultrafast potential scan cyclic voltammetry to study fast electron transfer kinetics as well as amperometric signal enhancement. Microelectrodes facilitate efficient hemispherical diffusion of analytes and/or mediators.43 SWNT forests possess a certain resemblance to nanostructured electrodes, particularly since they are assembled selectively on FeO(OH)-FeOCl crystallites and leave within large interstitials voids for effective diffusion of analytes or mediators to their exposed tips.8 In addition, the large excess of unused Ab1, together with the BSA blocking step, is expected to result in a loose packing around the SWNT forest, further facilitating efficient diffusion.
The topographic data of Figure 2 and 3 with surface roughness of ca. 21 nm, clearly demonstrate the high surface-to-volume ratio of SWNT forest assembly as compared to a flat, PG electrode. This high surface-to-volume ratio originates from variable length nanotubes assembled within the bundles, which are well packed in the base with densities approaching that of rope-lattice SWNT crystal.13 Moreover, the space between bundles is maximized by the loose underlying morphology of FeO(OH)-FeOCl precipitates,31,32 and the short incubation time (30 min.) within the aged DMF suspension of SWNTs, which results in many nanotube bundles within a given iron oxide domain.13
Ji et al41 and other researchers have demonstrated that carbon nanotubes possess excellent electrocatalytic activity attributed to phenols/quinone functionalities together with SWNTs carboxylate groups that populate the chemically oxidized nanotube tips. Oxygenated carbon nanotube sites have been shown to be as electrocatalytic as edge defects in PG.14 However, this may not be a major factor in sensor response as our measurements are made under mass transport control.8
The HNO3/H2SO4 (3:1 v/v) acid-treatment, besides shortening the length of SWNTs to the size needed to result in forest growth, also leads to p-doping (i.e. electron withdraw from their extended pi-orbital manifold), or otherwise called “hole” formation.38 As part of charge neutralization, a number of negative ions become strongly associated along the length of SWNTs to counter the positive charges resulted by acid p-doping. The presence of these counter ions inhibit the formation of thick rope lattice bundles of SWNTs,42 and for the latter to occur, one needs to carefully de-dope these nanotubes. Kim et al.38 reported that such de-doping can gradually take place in DMF due to slow hydrolysis of the DMF’s amide bond that produces dimethyl amine, a much stronger base that the corresponding formic acid. As evident by the reimmergence of sharp RBM peaks in the resonance Raman spectra of SWNTs, the presence of dimethyl amine reverses the acid-induced doping and returns these shortened nanotubes close to their pristine state (see Figure 6B). In addition, the short length of nanotubes (ca. 16.6 nm), coupled with the presence of a well-defined and sharp D-band in Figure 6A, suggest that these nanotubes localize most of their defects on their tips, leaving their stem in a pristine state to form dense bundles that are expected to possess large intrinsic conductivities.44
Further research is needed to identify which of the aforementioned nanotube aspects play a major role on the enhanced immunosensor performance of SWNT forests. This will commence in future publications.
Summary
In the design and fabrication of SWNT immunosensors, the characterization of each layer of the assembly revealed crucial aspects. This paper has demonstrated the fundamental characteristics for successful SWNT-forest immunosensors elucidating features of sensor fabrication important for high sensitivity protein detection. Results have provided a detailed picture of the surface morphology of each layer along with surface concentration and thickness of each protein layer. These studies reveal that part the sensitivity gain can be assigned to the dense packing of carboxylated SWNT forest tips, which translates to a large surface concentration of capture antibodies, together with the high quality of SWNT forests. The characterization methods described herein can identify poorly fabricated sensors as well as catastrophic failures in sensor fabrication.
Supplementary Material
ACKNOWLEDGEMENTS
This research was supported by US PHS grant ES013557 from National Institutes of Environmental Health Sciences, NIH. F.P. also wishes to acknowledge financial support from AFOSR FA9550-09-1-0201 and NFS 0828772 / 0828824.
Footnotes
SUPPORTING INFORMATION AVAILABLE
Four additional figures showing QCM frequency shifts of layers in control sensor (without SWNT forests), section analysis of layers in SWNT forests assembly, and Raman spectra of SWNT forests on mica and glass substrates are provided.
REFERENCES
- 1.Bachtold A, Hadley P, Nakanishi T, Dekker C. Science. 2001;294:1317–1320. doi: 10.1126/science.1065824. [DOI] [PubMed] [Google Scholar]
- 2.Lefebvre J, Antonov RD, Radosavljevic M, Lynch JF, Llaguno M, Johnson AT. Carbon. 2000;38:1745–1749. [Google Scholar]
- 3.Bockrath M, Cobden DH, McEuen PL, Chopra NG, Zettl A, Thess A, Smalley RE. Science. 1997;275:1922–1925. doi: 10.1126/science.275.5308.1922. [DOI] [PubMed] [Google Scholar]
- 4.Yao Z, Postma HWC, Balents L, Dekker C. Nature. 1999;402:273–276. [Google Scholar]
- 5.Tans SJ, Devoret MH, Dal H, Thess A, Smalley RE, Geerligs LJ, Dekker C. Nature. 1997;386:474–477. [Google Scholar]
- 6.Kong J, Franklin NR, Zhou C, Chappline MG, Peng S, Chao K, Dai H. Science. 2000;287:622–625. doi: 10.1126/science.287.5453.622. [DOI] [PubMed] [Google Scholar]
- 7.O’Connor M, Kim SN, Killard AJ, Forster RJ, Smyth MR, Papadimitrakopoulos F, Rusling JF. Analyst. 2004;129:1176–1180. doi: 10.1039/b412805b. [DOI] [PubMed] [Google Scholar]
- 8.Yu X, Chattopadhyay D, Galeska I, Papadimitrakopoulos F, Rusling JF. Electrochem. Commun. 2003;5:408–411. [Google Scholar]
- 9.Sinha N, Ma J, Yeow JTW. J. Nanosci. Nanotechnol. 2006;6:573–590. doi: 10.1166/jnn.2006.121. [DOI] [PubMed] [Google Scholar]
- 10.Stevens R, Nguyen C, Cassel A, Delzeit L, Meyyappan M, Han J. Appl. Phys. Lett. 2000;77:3453–3455. [Google Scholar]
- 11.Hafner JH, Cheung CL, Lieber CM. Nature. 1999;398:761–762. [Google Scholar]
- 12.Hafner JH, Cheung CL, Oosterkamp TH, Lieber CM. J. Phys. Chem. B. 2001;105:743–746. [Google Scholar]
- 13.Chattopadhyay D, Galeska I, Papadimitrakopoulos F. J. Am. Chem. Soc. 2001;123:9451–9452. doi: 10.1021/ja0160243. [DOI] [PubMed] [Google Scholar]
- 14.(a) Kim SN, Rusling JF, Papadimitrakopoulos F. Adv. Mater. 2007;19:3214–3228. doi: 10.1002/adma.200700665. [DOI] [PMC free article] [PubMed] [Google Scholar]; (b) Rusling JF, Yu X, Munge BS, Kim SN, Papadimitrakopoulos F. Engineering the Bioelectronic Interface. In: Davis J, editor. Royal Soc. Chem. UK. 2009. pp. 94–118. [Google Scholar]
- 15.Rusling JF, Sotzing G, Papadimitrakopoulos F. Bioelectrochem. 2009;76:189–194. doi: 10.1016/j.bioelechem.2009.03.011. [DOI] [PMC free article] [PubMed] [Google Scholar]
- 16.Yu X, Munge B, Patel V, Jensen G, Bhirde A, Gong JD, Kim SN, Gillespie J, Gutkind JS, Papadimitrakopoulos F, Rusling JF. J. Am. Chem. Soc. 2006;128:11199–11205. doi: 10.1021/ja062117e. [DOI] [PMC free article] [PubMed] [Google Scholar]
- 17.(a) Munge BS, Krause CE, Malhotra R, Patel V, Gutkind JS, Rusling JF. Electrochem. Commun. 2009;11:1009–1012. doi: 10.1016/j.elecom.2009.02.044. [DOI] [PMC free article] [PubMed] [Google Scholar]; (b) Malhotra R, Patel V, Vaqué JP, Gutkind JS, Rusling JF. Anal. Chem. 2010;82:3118–3123. doi: 10.1021/ac902802b. [DOI] [PMC free article] [PubMed] [Google Scholar]
- 18.Chikkaveeraiah BV, Bhirde A, Malhotra R, Patel V, Gutkind JS, Rusling JF. Anal. Chem. 2009;81:9129–9234. doi: 10.1021/ac9018022. [DOI] [PMC free article] [PubMed] [Google Scholar]
- 19.Sardesai N, Pan S, Rusling JF. Chem. Commun. 2009:4968–4970. doi: 10.1039/b909220j. [DOI] [PMC free article] [PubMed] [Google Scholar]
- 20.Yu X, Kim SN, Papadimitrakopoulos F, Rusling JF. Mol. Biosyst. 2005;1:70–78. doi: 10.1039/b502124c. [DOI] [PubMed] [Google Scholar]
- 21.May RA, Kondrachova LV, Hahn BP, Stevenson KJ. J. Phys. Chem. C. 2007;111:18251–18257. [Google Scholar]
- 22.McEvoy TM, Stevenson KJ. Langmuir. 2005;21:3521–3528. doi: 10.1021/la047276v. [DOI] [PubMed] [Google Scholar]
- 23.Jensen GC, Yu X, Gong JD, Munge B, Bhirde A, Kim SN, Papadimitrakopoulos F, Rusling JF. J. Nanosci. Nanotechnol. 2009;9:249–255. doi: 10.1166/jnn.2008.J016. [DOI] [PMC free article] [PubMed] [Google Scholar]
- 24.(a) Lvov Y. In: Protein Architecture: Interfacing Molecular Assemblies and Immobilization Biotechnology. Lvov Y, Möhwald H, editors. N. Y.: Marcel Dekker; 2000. pp. 125–167. [Google Scholar]; (b) Lvov Y. In: Handbook Of Surfaces and Interfaces Of Materials, Vol. 3. Nanostructured Materials, Micelles and Colloids. Nalwa RW, editor. San Diego: Academic Press; 2001. pp. 170–189. [Google Scholar]
- 25.Duparre A, Notni G. SPIE Crit. Rev. Series. 1999;VCR72:213–231. [Google Scholar]
- 26.Grasset FM, Pham NT, Glynos E, Koutsos V. Mater. Sci. Eng. B. 2008;152:125–131. [Google Scholar]
- 27.Blodgett KB, Langmuir I. Phys. Rev. 1937;51:964–982. [Google Scholar]
- 28.Hartman RE, Hartman RS, Larson K, Bateman JB. J. Opt. Soc. Am. 1954;44:197–198. [Google Scholar]
- 29.Garcia R, Pérez R. Surf. Sci. Rep. 2002;47:197–301. [Google Scholar]
- 30.Zhou L, Rusling JF. Anal. Chem. 2001;73:4780–4786. doi: 10.1021/ac0105639. [DOI] [PubMed] [Google Scholar]
- 31.Wei A, Kim S, Kim SN, Huey BD, Papadimitrakopoulos F, Marcus HL. J. Mater. Chem. 2007;17:4577–4585. [Google Scholar]
- 32.Wei H, Kim SN, Marcus HL, Papadimitrakopoulos F. Chem. Mater. 2006;18:1100–1106. [Google Scholar]
- 33.Dinh TV, Cullum B, Fresen J. Anal. Chem. 2000;366:540–551. doi: 10.1007/s002160051549. [DOI] [PubMed] [Google Scholar]
- 34.Kuwamura S, Yamaguchi I. Appl. Opt. 1997;36:4473–4482. doi: 10.1364/ao.36.004473. [DOI] [PubMed] [Google Scholar]
- 35.Efremov EV, Ariese F, Gooijer C. Anal. Chem. Acta. 2008;2:119–134. doi: 10.1016/j.aca.2007.11.006. [DOI] [PubMed] [Google Scholar]
- 36.Zavaleta C, Zerda A, Liu Z, Keren S, Cheng Z, Schipper M, Chen X, Dai H, Gambhir S. Nano Lett. 2008;8:2800–2805. doi: 10.1021/nl801362a. [DOI] [PMC free article] [PubMed] [Google Scholar]
- 37.Dresselhaus MS, Eklund PC. Adv. Phys. 2000;49:705–814. [Google Scholar]
- 38.Kim SN, Luo Z, Papadimitrakopoulos F. Nano. Lett. 2005;5:2500–2504. doi: 10.1021/nl051840k. [DOI] [PubMed] [Google Scholar]
- 39.Andrleux CP, Garreau D, Hapiot P, Saveant JM. J. Electroanal.Chem. 1988;248:447–450. [Google Scholar]
- 40.Oldham KB, Zoski CG, Bond AM, Sweigart DA. J. Electroanal.Chem. 1988;248:467–473. [Google Scholar]
- 41.Ji X, Kadara RO, Krussma J, Chen Q, Banks CE. Electroanal. 2010;22:7–19. [Google Scholar]
- 42.Ju S-Y, Utz M, Papadimitrakopoulos F. J. Am. Chem. Soc. 2009;131:6775–6784. doi: 10.1021/ja809054c. [DOI] [PMC free article] [PubMed] [Google Scholar]
- 43.Bard AJ, Faulkner L. Electrochemical Methods: Fundamentals and Applications. New York: John Wiley & Sons, Inc.; 1980. pp. 239–243. [Google Scholar]
- 44.Collins PG, Arnold MS, Avouris P. Science. 2001;292:706–709. doi: 10.1126/science.1058782. [DOI] [PubMed] [Google Scholar]
Associated Data
This section collects any data citations, data availability statements, or supplementary materials included in this article.


