Abstract
Purpose
The aim of this study was to develop a method to characterize intact soluble monoclonal IgG1 antibody (IgG) oligomers by mass spectrometry.
Methods
IgG aggregates (dimers, trimers, tetramers and high-molecular-weight oligomers) were created by subjecting an IgG formulation to several pH jumps. Protein oligomer fractions were isolated by high performance size exclusion chromatography (HP-SEC), dialyzed against ammonium acetate pH 6.0 (a mass spectrometry-compatible volatile buffer), and analyzed by native electrospray ionization time-of-flight mass spectrometry (ESI-TOF MS).
Results
Monomeric and aggregated IgG fractions in the stressed IgG formulation were successfully isolated by HP-SEC. ESI-TOF MS analysis enabled us to determine the molecular weight of the monomeric IgG as well as the aggregates, including dimers, trimers and tetramers. HP-SEC separation and sample preparation proved to be necessary for good quality signal in ESI-TOF MS. Both the HP-SEC protocol and the ESI-TOF mass spectrometric technique were shown to leave the IgG oligomers largely intact.
Conclusions
ESI-TOF MS is a useful tool complementary to HP-SEC to identify and characterize small oligomeric protein aggregates.
KEY WORDS: HP-SEC, IgG1, monoclonal antibody, native ESI-TOF mass spectrometry, protein aggregation
INTRODUCTION
Monoclonal antibodies (mAb), also known as immunoglobulins (Ig), are glycoproteins used as therapeutics for the treatment of several life-threatening conditions, including cancer, inflammatory diseases, complications upon organ transplantation, and infectious and cardiovascular diseases (1–3). Among the five different classes of Ig, IgG is the most abundant one and widely used for therapeutic purposes. The IgG class is further divided into several subclasses—IgG1, IgG2, IgG3, and IgG4 (in order of relative abundance in human plasma). The structural differences among these subtypes are the number and location of inter-chain disulfide bonds and the length of the hinge region (3).
Like all other protein therapeutics, mAb can undergo various degradation processes during production, storage, transport, etc. (4). Aggregation is a common degradation process for therapeutic proteins and can occur during production, formulation and storage (5), e.g. due to pH changes, temperature variations and agitation (6–8). Partial unfolding or other types of conformational changes in the protein structure may cause aggregate formation (9–12). Aggregation of therapeutic proteins is highly undesired since it can lead to activity loss, decreased solubility, and enhanced unwanted immunogenicity (13–15). Therefore, there is a great interest in unraveling aggregation pathways and analyzing the quantity and characteristics of protein aggregates.
Aggregation of mAbs due to various types of stress factors has been studied extensively (3,6–8,11,14,16–18). Structural characterization of mAb aggregates involves multiple complementary techniques. High performance size-exclusion chromatography (HP-SEC) is commonly used for measuring and separating protein aggregates according to their size (19,20). However, for the identification of these separated compounds, other analytical techniques are required (17,21,22) Molecular weight determination is a common way in the identification and characterization of oligomeric mAb species. For this purpose, sodium dodecyl sulfate/polyacrylamide gel electrophoresis (SDS-PAGE) and on-line multi-angle laser light scattering detection are accepted techniques; however, both methods suffer from relatively low mass accuracy and precision. These limitations can be overcome by using mass spectrometry (MS), especially electrospray ionization time-of-flight mass spectrometry (ESI-TOF MS), a method that can accurately assign the molecular mass of proteins and aggregates thereof. Specifically, native ESI-TOF MS is particularly useful for structural characterization of intact protein aggregates due to the ability of preserving quaternary protein structures, maintaining non-covalent protein interactions and its theoretically unlimited mass range (23–25).
Native MS combines the advantages of ESI by replacing the commonly used volatile polar solvents (e.g. water, acetonitrile, methanol, etc.) with the MS-compatible volatile aqueous buffer solutions like ammonium acetate (26–29). With native MS, not only the mass of large protein complexes, such as ribosomes and whole viruses, can be determined (30), but also information on their structure, topology and architecture can be obtained (26,31). Although native MS does not provide detailed molecular structure information, its sensitivity, speed, selectivity and ability to simultaneously measure several species present in a mixture are clearly advantageous in comparison with traditional structural biology methods such as NMR spectroscopy or X-ray crystallography (26,32). An important requisite for obtaining meaningful results by native MS is high sample quality, such as the absence of non-volatile buffers or salts in the spraying solution (23,25,27). Therefore, method development is essential to answer any particular question to be addressed by native MS. This is particularly true when heterogeneous mixtures of aggregates proteins are to be analyzed, as aimed in the present study.
The coupling of chromatographic separation techniques such as HP-SEC directly to ESI-TOF MS for the analysis of antibody monomers has been previously reported (33). As for IgG aggregates, Remmele et al. (18) and Van Buren et al. (11) used ESI-MS on IgG dimers that were enzymatically digested after chromatographic separation. However, to our knowledge, we are the first group combining HP-SEC with native MS for the detection of intact monoclonal antibody aggregates. In this paper, we present a protocol to identify intact IgG oligomers (dimers, trimers, and tetramers), induced by pH stress on a monomeric monoclonal IgG1 (IgG), using native ESI-TOF MS. We analyzed and fractionated the aggregates by HP-SEC, dialyzed the isolated fractions to aqueous ammonium acetate and then analyzed them by ESI-TOF MS. We demonstrate that native ESI-TOF MS makes it possible to characterize IgG dimers, trimers and tetramers.
MATERIALS AND METHODS
Protein and Other Materials
A monoclonal human antibody of the IgG1 subclass (IgG), kindly provided by Biogen (Cambridge, MA USA), was formulated at 65 mg/ml in 10 mM sodium citrate buffer containing 5% sucrose, pH 6.0. It was diluted in a same formulation buffer containing 10 mM sodium citrate with 5% sucrose, pH 6.0. 150 mM ammonium acetate (puriss p.a., for mass spectrometry, Fluka, Sigma-Aldrich Steinheim, Germany) was used as the buffer solution for mass spectrometric analysis. The formulations were filtered using 0.22 μm PES (polyethersulfone) low binding syringe-driven filter units (MillexTM GP, Millipore, Ireland).
Sodium citrate dihydrate and glycine were from Merck (Merck KGaA, Darmstadt, Germany), NaH2PO4 dihydrate, Na2HPO4 dihydrate, tris(hydroxymethyl)aminomethane (Tris), β-mercaptoethanol and hydrochloric acid (HCl) were from Sigma (Sigma, Sigma-Aldrich Steinheim, Germany), sodium hydroxide from Boom (Boom BV. Meppel, The Netherlands), glycerol and sodium dodecyl sulfate (SDS) from Merck (Merck Darmstadt and Merck, Hohenbrunn, Germany), cesium iodide and sodium azide from Fluka (Fluka, Sigma-Aldrich Steinheim, Germany), bromophenol blue from Bio-Rad (Bio-Rad Hercules, USA) and 5% polyacrylamide tris-HCl ready gel, pre-stained broad range molecular weight markers, silver stain kit from Bio-Rad (Bio-Rad Veenendaal, The Netherlands).
Amicon 10 kDa molecular-weight cut-off filters were purchased from Millipore (Millipore SA, Molsheim, France). Deionized water was obtained from a MilliQ water purification system (Millipore, USA).
Preparation of Protein Aggregates
The sample under investigation was prepared by diluting the monoclonal antibody formulation with the 10 mM sodium citrate buffer containing 5% sucrose, pH 6.0 to a final concentration of 1 mg/ml IgG. To apply the pH stress, 1 M HCl was slowly added drop-wise with a pipette to the antibody solution to change the pH from 6.0 to 1.0. Then, 1 M NaOH was added to adjust the pH to 10.0. Finally, 1 M HCl was added again to adjust the pH back to 6.0. There was approximately 1 min waiting time between the pH shifts, while constant stirring at 500 rpm. No precipitation was observed after the pH stress treatments.
High Performance Size Exclusion Chromatography (HP-SEC)
Unstressed and pH-stressed samples were analyzed with HP-SEC for the detection and separation of IgG oligomers. For this purpose, we used a TSK Gel 3000 SWXL column (300 × 7.8 mm, 5.0 μm particle size) with a TSK Gel 3000 pre-column (TOSOH Bioscience, Stuttgart, Germany) combined with a Thermo UV detector and a Gilson 234 Autoinjector. The separation was performed at a flow rate of 0.5 mL/min, and 300 μL of sample was injected. The elution buffer was composed of 100 mM sodium phosphate, 100 mM sodium sulfate, 0.05% (w/v) sodium azide at pH 7.2. The elution buffer was freshly prepared, filtered and degassed prior to use. Elution was monitored by UV detection (280 nm). Monomer, dimer, trimer/tetramer and high molecular weight oligomer fractions were collected in separate vials after UV detection.
Native Mass Spectrometry
All samples were dialyzed against 150 mM ammonium acetate at pH 6.0 using 10-kDa molecular-weight cut-off Slide-A-Lyzer dialysis cassettes (Thermo Fisher Scientific, Pierce Biotechnology, Rockford, USA). The dimer and trimer/tetramer solutions were further washed with 150 mM ammonium acetate buffer solution pH 6.0, using Amicon ultracentrifuge filters (10 kDa) prior to MS analysis. The sample was centrifuged at 14.000 x g for 15 min at 4°C. The same devices were used to finally concentrate the protein to about 5 mg/ml.
The obtained protein samples were measured with a modified Waters Micromass nano-ESI-TOF MS (positive ion mode). Needles were made from borosilicate glass capillaries (Kwik-Fil, World Precision Instruments, USA) on a P-97 puller (Sutter Instruments, USA), coated with a thin gold layer by using an Edwards Scancoat six Pirani 501 sputter coater (Edwards Laboratories, USA). To produce intact gas phase ions, the source was operated at an elevated pressure (~7 mbar). The created droplet size was 1 μm. The typical spray concentration of the proteins was 5 μM and the injected volume 2 μl. Mass spectra were recorded with a capillary voltage of 1.2 kV and a cone voltage of 150 V. The pressure in the time-of-flight was 2.7 × 10⁻⁶ mbar. All spectra were calibrated using 25 mg/ml cesium iodide solution. Further details can be found elsewhere (34).
SDS-PAGE
Approximately 24 μg of unstressed and pH-stressed IgG and about 3 μg of dimer (fraction 2) and high-molecular-weight oligomers (fraction 4) collected from HP-SEC were mixed with either non-reducing or reducing denaturing sample buffer at a 1:4 volume ratio in 0.5 ml reaction vials (Eppendorf, Hamburg, Germany). The non-reducing sample buffer contained 0.06 M tris(hydroxymethyl)aminomethane (Tris), 25% (v/v) glycerol, 2% (w/v) sodium dodecyl sulfate (SDS) and 0.1% (w/v) bromophenol blue, and the reducing sample buffer also contained 0.7 M β- mercaptoethanol. The samples were treated for 2 min at 98°C in an Eppendorf Thermomixer Confort (Hamburg, Germany) and loaded in a 5% polyacrylamide tris-HCl ready gel, alongside with pre-stained broad range molecular weight markers.
Gel electrophoresis was performed in a Bio-Rad Mini-PROTEAN 3 cell equipped with a Bio-Rad PowerPac 300 power supply (Bio-Rad, Veenendaal, The Netherlands). The electrophoresis buffer containing 0.3% (w/v) Tris, 1.44% (w/v) glycine and 0.1% SDS, pH 8.3. Separation was performed at a constant current of 100 V and at maximally 50 mA for about 1 hour. The gel was stained using the Bio-Rad silver stain kit.
RESULTS AND DISCUSSION
HP-SEC Analysis of IgG Oligomers
IgG aggregates were prepared according to the procedure described in the “Materials and Methods” section. We initially compared unstressed IgG and pH-stressed IgG in formulation buffer (citrate buffer) with HP-SEC. As can be seen from the chromatograms in Fig. 1, it is evident that an applied pH stress on an IgG sample results in the formation of a number of additional peaks that are attributed to soluble IgG aggregates. The unstressed IgG was predominantly monomeric (peak at 17.7 min), with a minor peak at 14.8 min (Fig. 1, red line), whereas pH-stressed IgG was shown to contain substantial amounts of soluble aggregates (Fig. 1, black line), having distinct peaks at 15.1, and 14.0, 13.2 and 12.1 min. Presumably, these peaks belong to the dimer, trimer, tetramer and high-molecular-weight (HMW) oligomers of IgG, respectively. The observed slight shifts in retention times of unstressed and pH-stressed IgG monomers and dimers are indicative of different interactions with the column material, perhaps due to partial unfolding and increased hydrophobicity of these species.
Fig. 1.
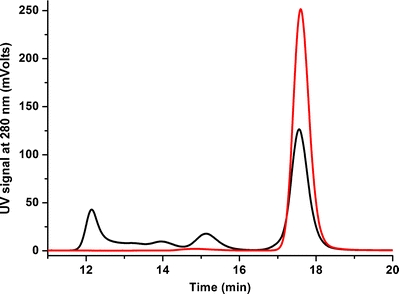
Size-exclusion chromatograms of unstressed IgG (red) vs. pH-stressed IgG (black) in 10 mM citrate buffer pH 6.0.
Mass Spectrometric Analysis of IgG Oligomers
While HP-SEC is ideal for initial screening of IgG oligomers, MS is far more suitable for accurate molecular weight determinations. ESI-MS produces multiply charged protein ions, resulting in a charge state distribution in the spectrum. From this distribution, the molecular weight of the protein can be determined using computer algorithms for the deconvolution of the charge envelope. However, ESI-MS sets stringent constraints on the sample buffer. Most buffer solutions used in structural biology and pharmaceutical formulations are not compatible with ESI-MS. The sample solution for ESI-MS needs to be free of any interfering charged species, such as salts and metal ions, as they may obstruct the protein ionization process (27,35). For this purpose, aqueous ammonium acetate solution has been introduced previously as an ESI-MS–compatible ‘volatile buffer.’ This volatile buffer easily desolvates, evaporation of solvents leading to the formation of gas-phased ions of protein molecules, and in the meantime the original quaternary structure of the protein is usually preserved (26,27).
Among many other approaches to identify the proteins by MS, we have followed a “top-down” method for the identification of intact protein aggregates (36). In this approach, the protein sample, dissolved in aqueous ammonium acetate buffer, is directly injected to ESI-TOF MS instrument without any chemical or enzymatic treatment. This results in a molecular mass of the intact protein and/or protein aggregates and their major post-translational modifications.
Figure 2 shows the mass spectra of unstressed IgG (top) and pH-stressed IgG (bottom). These spectra represent characteristic charge envelopes belonging to the protein species. Peaks distributed between m/z 5000 to 7000 represent the different charged states of monomeric IgG, both in unstressed and pH-stressed samples. At first glance the spectra are very similar. Detailed analysis, however, shows that the spectrum of unstressed IgG contains 99.8% monomer and 0.2% dimer (top panel, zoomed inset), whereas that of pH-stressed IgG shows 90.1% monomer, 9.5% dimer, and 0.4% trimer (Fig. 2, lower panel, zoomed inset). These percentages were calculated using the peak intensities of the entire charge state distribution for all species present.
Fig. 2.
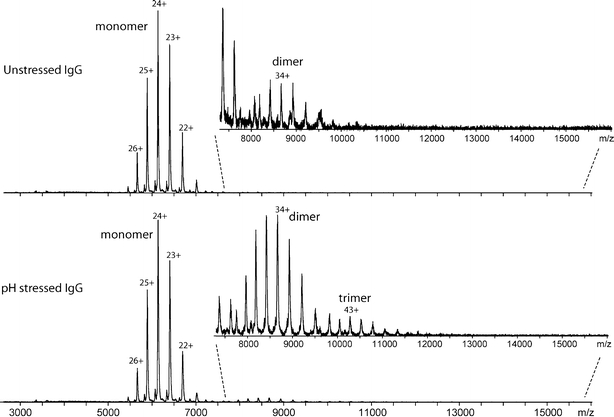
ESI-TOF MS spectra of unstressed (top) and pH-stressed (bottom) IgG solutions, without HP-SEC separation. Samples are in 150 mM ammonium acetate buffer pH 6.0.
Mass Spectrometric Analysis of HP-SEC Fractions
As can be seen in the previous section, the monomer signal is very abundant in pH-stressed IgG solution, and it suppresses the MS signals deriving from the other (higher oligomer) species in the solution. However, HP-SEC clearly showed the existence of other species. Therefore, chromatographic separation and purification of the individual fractions was performed. In this way, we can isolate and individually study the structural information and possible conformational variants within the dimers, trimers, and other oligomers.
HP-SEC was used to isolate the monomer, dimer, trimer/tetramer and HMW oligomer fractions of the stressed IgG mixture. The stability and purity of these fractions were tested by re-analyzing them with the same HP-SEC method (Fig. 3). Clearly, isolation of the individual species was successful: four fractions presumably corresponding to monomer, dimer, trimer/tetramer and HMW oligomers were obtained. The trimer and tetramer species were collected simultaneously because of the difficulty in separating the two species with this HP-SEC column. In addition, the results show that the separated products are largely irreversible as analysis of the individual fractions hardly shows other oligomeric forms or monomeric IgG in their respective chromatograms (Fig. 3).
Fig. 3.
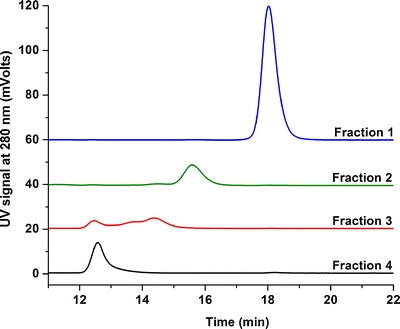
Size-exclusion chromatograms of collected fractions of pH-stressed IgG; HMW: High-molecular-weight aggregates (black), trimers/tetramers (red), dimers (green) and monomer (blue). Spectra are not normalized.
Unfortunately, mobile phases containing volatile salts, tested for HP-SEC coupled with MS analysis of a recombinant IgG product were shown to be poor in terms of chromatographic separation and mass spectrometric performance (37). Similarly, prior to MS analysis, we dialyzed the oligomer fractions isolated by HP-SEC against an aqueous ammonium acetate solution as in the case of non-fractioned samples. Re-analysis of the dialyzed samples by HP-SEC indicated that the oligomeric state of the different fractions was not measurably affected (data not shown).
Figure 4 shows the deconvoluted MS spectra of the HP-SEC fractions containing intact IgG monomer, dimers and trimers/tetramers. Deconvolution of their charge envelopes resulted in mass values of 147,339 ± 101 Da for the monomer, 294,709 ± 93 Da for the dimer, 441,950 ± 313 Da for the trimer and 589,745 ±228 Da for the tetramer. We were not able to obtain good signals for fraction 4.
Fig. 4.
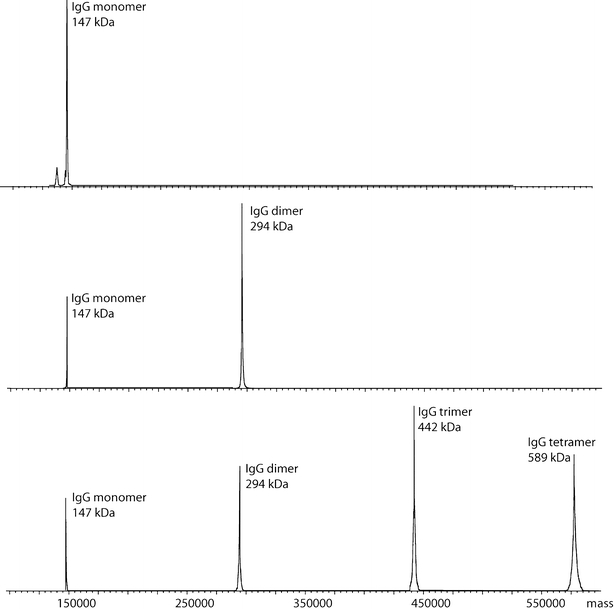
Deconvoluted ESI-TOF MS of pH-stressed IgG fractions. Spectra are belonging to HP-SEC fractions 1 (top), fraction 2 (middle), and fraction 3 (bottom). The corresponding approximate molecular weights are depicted next to the peaks.
In Fig. 5, we compare the relative abundances of the species in each fraction. In addition to the expected oligomeric state, other species were detected as well. There was a trace amount of dimer (0.5%) present in the fraction 1, whereas the MS spectrum of the fraction 2 showed ~15% monomer and 2% trimer. The MS spectrum of the fraction 3 consisted of 57% trimer, 17% tetramer, 13% dimer and 13% monomer IgG. Similar calculations on the HP-SEC results depicted in Fig. 3 show that the fraction 1 contained ~0.3% dimer, which is in good agreement with the MS estimations. On the other hand, the percentages of monomer and oligomers in fractions 2 and 3, as calculated from HP-SEC and MS, differed considerably. For instance, fraction 2 contained only 0.6% monomer according to HP-SEC, whereas in MS, 15% monomer was found. The discrepancies between the MS and HP-SEC results are likely due to intrinsic differences between the two separation techniques. Moreover, note that MS, unlike HP-SEC, is not considered to yield quantitative results.
Fig. 5.
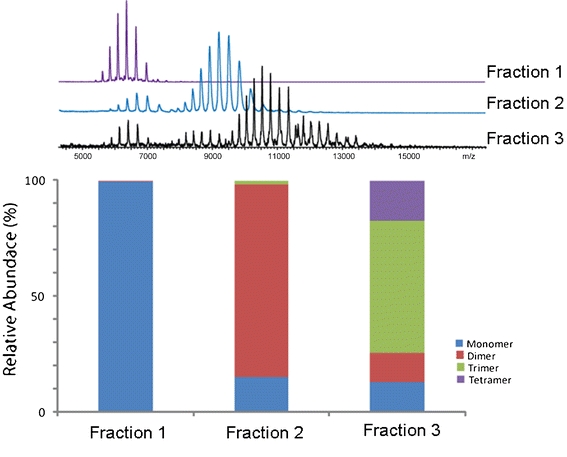
Bars representing the summed intensities for all IgG species observed in each fraction. For illustration, the raw MS spectra used to calculate the relative abundances are depicted above.
SDS-PAGE
SDS-PAGE is a well-established technique to investigate whether the aggregates formed were composed of covalently and/or non-covalently linked species (4,38).
In the literature, the simultaneous formation of covalent and non-covalent dimers has been reported for different IgG mAbs (18,39–41). In addition, it has been observed that some short-term stressed non-covalent antibody dimers can irreversibly convert into covalent dimers (18,42). The amount of non-covalent and covalent dimers formed by several IgG species depended on IgG type, solution conditions, and temperature (11).
We performed non-reducing and reducing SDS-PAGE on the unstressed IgG, pH-stressed IgG, isolated fraction 2 and fraction 4, as depicted in Fig. 6. Given that the amount of dimer was less abundant compared to monomer in both unstressed and pH-stressed IgG according to HP-SEC, an excessive amount of these samples was loaded in the slots of the gel in order to detect these dimers. This resulted in over-exposure of the monomer band at ~150 kDa in lanes 2 and 3 (Fig. 6), while the dimer bands were visible at ~300 kDa. In fact, the dimer bands under non-reducing conditions are rather similar in intensity between these two samples, which indicates that the majority of dimers were non-covalently linked. This was confirmed by SDS-PAGE analysis of the dimer fraction (Fig. 6, lane 4), where most of the dimers collected by HP-SEC fractionation had dissociated into monomers under denaturing conditions. For the HMW oligomer fraction 4, a band can be observed at the top of lane 5 and another one at ~150 kDa, which means that this fraction contained both covalent and non-covalent oligomers. The lack of any HMW bands on the gel run under reducing conditions (Fig. 6, lane 9) indicates that these covalent aggregates were disulfide mediated. Nevertheless, the pH-stressed IgG dimers were strong enough to remain intact during HP-SEC analysis, dialysis, and subsequent ESI-TOF MS analysis.
Fig. 6.
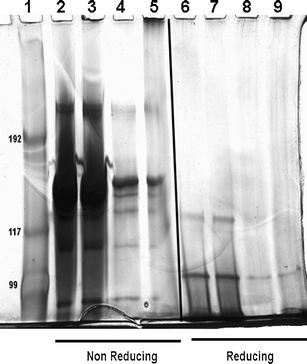
Silver-stained SDS-PAGE gel run under nonreducing (NR) and reducing (R) conditions. Lanes belong to standards (1), unstressed IgG (2 for NR, 6 for R), pH-stressed IgG (3 for NR, 7 for R), HP-SEC fraction 2 (4 for NR, 8 for R) and HP-SEC fraction 4 (5 for NR, 9 for R) of pH-stressed IgG (see Fig. 3 for HP-SEC profiles of the fractions).
CONCLUSION
In this paper, we have combined chromatographic separation of protein oligomers with intact protein characterization by native ESI-TOF MS. We have described a HP-SEC/buffer exchange protocol that enables native ESI-TOF MS analysis of pH-stressed IgG samples. We have shown that proper sample preparation and chromatographic separation of monomer, dimer and trimer/tetramer fractions by HP-SEC have resulted in improved MS analysis, as compared to MS analysis prior to HP-SEC separation. Both the sample preparation and the native ESI-TOF MS technique leave the aggregates intact. In conclusion, ESI-TOF MS is a useful method that adds to our current analytical arsenal to identify and characterize mAb oligomers.
ACKNOWLEDGEMENTS
This research was supported by the Technology Foundation STW, the applied science division of NWO and technology program of the Dutch Ministry of Economic Affairs. A VENI grant was awarded to E. van Duijn by the Netherlands Organization for Scientific Research (NWO) (VENI 700.58.402). We thank The Netherlands Proteomics Center for financial support.
Open Access
This article is distributed under the terms of the Creative Commons Attribution Noncommercial License which permits any noncommercial use, distribution, and reproduction in any medium, provided the original author(s) and source are credited.
REFERENCES
- 1.Carter PJ. Potent antibody therapeutics by design. Nat Rev Immunol. 2006;6:343–357. doi: 10.1038/nri1837. [DOI] [PubMed] [Google Scholar]
- 2.Schrama D, Reisfeld RA, Becker JC. Antibody targeted drugs as cancer therapeutics. Nat Rev Drug Discov. 2006;5:147–159. doi: 10.1038/nrd1957. [DOI] [PubMed] [Google Scholar]
- 3.Wang W, Singh S, Zeng DL, King K, Nema S. Antibody structure, instability, and formulation. J Pharm Sci. 2007;96:1–26. doi: 10.1002/jps.20727. [DOI] [PubMed] [Google Scholar]
- 4.Cromwell MEM, Hilario E, Jacobson F. Protein aggregation and bioprocessing. AAPS Journal. 2006;8:E572–579. doi: 10.1208/aapsj080366. [DOI] [PMC free article] [PubMed] [Google Scholar]
- 5.Mahler H-C, Friess W, Grauschopf U, Kiese S. Protein aggregation: pathways, induction factors and analysis. J Pharm Sci. 2009;98:2909–2934. doi: 10.1002/jps.21566. [DOI] [PubMed] [Google Scholar]
- 6.Vermeer AW, Norde W. The thermal stability of immunoglobulin: unfolding and aggregation of a multi-domain protein. Biophys J. 2000;78:394–404. doi: 10.1016/S0006-3495(00)76602-1. [DOI] [PMC free article] [PubMed] [Google Scholar]
- 7.Ejima D, Tsumoto K, Fukada H, Yumioka R, Nagase K, Arakawa T, Philo JS. Effects of acid exposure on the conformation, stability, and aggregation of monoclonal antibodies. Proteins. 2007;66:954–962. doi: 10.1002/prot.21243. [DOI] [PubMed] [Google Scholar]
- 8.Jiskoot W, Bloemendal M, Van Haeringen B, Van Grondelle R, Beuvery EC, Herron JN, Crommelin DJ. Non-random conformation of a mouse IgG2a monoclonal antibody at low pH. Eur J Biochem. 1991;201:223–232. doi: 10.1111/j.1432-1033.1991.tb16278.x. [DOI] [PubMed] [Google Scholar]
- 9.Jaenicke R. Protein folding: local structures, domains, subunits, and assemblies. Biochem. 1991;30:3147–3161. doi: 10.1021/bi00227a001. [DOI] [PubMed] [Google Scholar]
- 10.Kim Y-S, Wall JS, Meyer J, Murphy C, Randolph TW, Manning MC, Carpenter JF. Thermodynamic modulation of light chain amyloid fibril formation. J Biol Chem. 2000;276:1570–1574. doi: 10.1074/jbc.275.3.1570. [DOI] [PubMed] [Google Scholar]
- 11.Van Buren N, Rehder D, Gadgil H, Matsamura M, Jacob J. Elucidation of two major aggregation pathways in an IgG2 antibody. J Pharm Sci. 2009;98:3013–3030. doi: 10.1002/jps.21514. [DOI] [PubMed] [Google Scholar]
- 12.Fesinmeyer RM, Hogan S, Saluja A, Brych SR, Kras E, Narhi LO, Brems DN, Gokarn YR. Effects of ions on agitation and temperature induced aggregation reactions of antibodies. Pharma Res. 2009;26:903–913. doi: 10.1007/s11095-008-9792-z. [DOI] [PubMed] [Google Scholar]
- 13.Rosenberg AS. Effects of protein aggregates: an immunologic perspective. AAPS J. 2006;8:501–507. doi: 10.1208/aapsj080359. [DOI] [PMC free article] [PubMed] [Google Scholar]
- 14.Hermeling S, Crommelin DJA, Schellekens H, Jiskoot W. Structure-immunogenicity relationships of therapeutic proteins. Pharm Res. 2004;21:897–903. doi: 10.1023/B:PHAM.0000029275.41323.a6. [DOI] [PubMed] [Google Scholar]
- 15.Chi EY, Krishnan S, Randolph TW, Carpenter JF. Physical stability of proteins in aqueous solution: mechanism and driving forces in nonnative protein aggregation. Pharm Res. 2003;20:1325–1336. doi: 10.1023/A:1025771421906. [DOI] [PubMed] [Google Scholar]
- 16.Jøssang T, Feder J, Rosenqvist E. Heat aggregation kinetics of human IgG. J Chem Phys. 1985;82:574–589. doi: 10.1063/1.448730. [DOI] [Google Scholar]
- 17.Mahler H-C, Muller R, Frieß W, Delille A, Matheus S. Induction and analysis of aggregates in a liquid IgG1-antibody formulation. Eur J Pharm Biopharm. 2005;59:407–417. doi: 10.1016/j.ejpb.2004.12.004. [DOI] [PubMed] [Google Scholar]
- 18.Jr Remmele RL, Callahan WJ, Krisnanh S, Zhou L, Bondarenko PV, Nichols AC, Kleemann GR, Pipes GD, Park S, Fodor S, Kras E, Brems DN. Active dimer of epratuzumab provides insight into the complex nature of an antibody aggregate. J Pharm Sci. 2006;95:126–145. doi: 10.1002/jps.20515. [DOI] [PubMed] [Google Scholar]
- 19.Andersen CB, Manno M, Rischel C, Thorolfsson M, Martorana V. Aggregation of a multidomain protein: a coagulation mechanism governs aggregation of a model IgG1 antibody under weak thermal stress. Prot Science. 2010;19:279–290. doi: 10.1002/pro.309. [DOI] [PMC free article] [PubMed] [Google Scholar]
- 20.Arakawa T, Ejima D, Li T, Philo JS. The critical role of mobile phase composition in size exclusion chromatography of protein pharmaceuticals. J Pharm Sci. 2009;99:1674–1692. doi: 10.1002/jps.21974. [DOI] [PubMed] [Google Scholar]
- 21.Hawe A, Kasper JC, Friess W, Jiskoot W. Structural properties of monoclonal antibody aggregates induced by freeze–thawing and thermal stress. European J Pharma Scien. 2009;38:79–87. doi: 10.1016/j.ejps.2009.06.001. [DOI] [PubMed] [Google Scholar]
- 22.Carpenter JF, Randolph TW, Jiskoot W, Crommelin DJA, Middaugh CR, Winter G. Potential inaccurate quantitation and sizing of protein aggregates by size exclusion chromatography: essential need to use orthogonal methods to assure the quality of therapeutic protein products. J Pharm Sci. 2010;99:2200–2208. doi: 10.1002/jps.21989. [DOI] [PubMed] [Google Scholar]
- 23.Van Duijn E. Current limitations in native mass spectrometry based structural biology. J Am Soc Mass Spectrom. 2010;21:971–978. doi: 10.1016/j.jasms.2009.12.010. [DOI] [PubMed] [Google Scholar]
- 24.Van den Heuvel RH, Van Duijn E, Mazon H, Synowsky SA, Lorenzen K, Versluis C, Brouns SJJ, Langridge D, Van der Oost J, Hoyes J, Heck AJR. Improving the performance of a quadrupole Time-of-Flight instrument for macromolecular mass spectrometry. Anal Chem. 2006;78:7473–7483. doi: 10.1021/ac061039a. [DOI] [PubMed] [Google Scholar]
- 25.Lorenzen K, Vannini A, Cramer P, Heck AJR. Structural biology of RNA polymerase III: mass spectrometry elucidates subcomplex architecture. Structure. 2007;15:1237–1245. doi: 10.1016/j.str.2007.07.016. [DOI] [PubMed] [Google Scholar]
- 26.Heck AJR. Native mass spectrometry: a bridge between interactomics and structural biology. Nat Methods. 2008;5:927–933. doi: 10.1038/nmeth.1265. [DOI] [PubMed] [Google Scholar]
- 27.Hernandez H, Robinson CV. Determining the stoichiometry and interactions of macromolecular assemblies from mass spectrometry. Nat Protoc. 2007;2:715–726. doi: 10.1038/nprot.2007.73. [DOI] [PubMed] [Google Scholar]
- 28.McKay AR, Ruotolo BT, Ilag LL, Robinson CV. Mass measurements of increased accuracy resolve heterogeneous populations of intact ribosomes. J Am Chem Soc. 2006;128:11433–11442. doi: 10.1021/ja061468q. [DOI] [PubMed] [Google Scholar]
- 29.Chung EW, Henriques DA, Renzoni D, Morton CJ, Mulhern TD, Pitkeathly MC, Ladbury JE, Robinson CV. Probing the nature of interactions in SH2 binding interfaces—evidence from electrospray ionization mass spectrometry. Protein Sci. 1999;8:1962–1970. doi: 10.1110/ps.8.10.1962. [DOI] [PMC free article] [PubMed] [Google Scholar]
- 30.Uetrecht C, Rose RJ, Van Duijn E, Lorenzen K, Heck AJR. Ion mobility mass spectrometry of proteins and protein assemblies. Chem Soc Rev. 2010;39:1633–1655. doi: 10.1039/b914002f. [DOI] [PubMed] [Google Scholar]
- 31.Van den Heuvel RH, Heck AJR. Native protein mass spectrometry: from intact oligomers to functional machineries. Curr Opin Chem Biol. 2004;8:519–526. doi: 10.1016/j.cbpa.2004.08.006. [DOI] [PubMed] [Google Scholar]
- 32.Oda M, Uchiyama S, Noda M, Nishi Y, Koga M, Mayanagi K, Robinson CV, Fukui K, Kobayashi Y, Morikawa K, Azuma T. Effects of antibody affinity and antigen valence on molecular forms of immune complexes. Mol Immun. 2009;47:357–364. doi: 10.1016/j.molimm.2009.09.009. [DOI] [PubMed] [Google Scholar]
- 33.Brady LJ, Valliere-Douglass J, Martinez T, Balland A. Molecular mass analysis of antibodies by on-line SEC-MS. J Am Soc Mass Spectrom. 2008;19:502–509. doi: 10.1016/j.jasms.2007.12.006. [DOI] [PubMed] [Google Scholar]
- 34.Van Duijn E, Bakkes PJ, Heeren RMA, Van den Heuvel RH, Van Heerikhuizen H, Van der Vies SM, Heck AJR. Monitoring macromolecular complexes involved in the chaperonin-assisted protein folding cycle by mass spectrometry. Nat Methods. 2005;2:371–376. doi: 10.1038/nmeth753. [DOI] [PubMed] [Google Scholar]
- 35.Koschubs T, Lorenzen K, Baumli S, Sandstrom S, Heck AJR, Cramer P. Preparation and topology of the Mediator middle module. Nuc Acids Res. 2010;in press. [DOI] [PMC free article] [PubMed]
- 36.Zhang Z, Pan H, Chen X. Mass spectrometry for structural characterization of therapeutic proteins. Mass Spec Rev. 2009;28:147–176. doi: 10.1002/mas.20190. [DOI] [PubMed] [Google Scholar]
- 37.Lazar AC, Wang L, Blattler WA, Amphlett G, Lambert JM, Zhang W. Analysis of the composition of immunoconjugates using size-exclusion chromatography coupled to mass spectrometry. Rapid Commun Mass Spectrom. 2005;19:1806–1814. doi: 10.1002/rcm.1987. [DOI] [PubMed] [Google Scholar]
- 38.Ribarska JT, Jolevska ST, Panovska AP, Dimitrovska A. Studying the formation of aggregates in recombinant human granulocyte-colony stimulating factor (rHuG-CSF), lenograstim, using size-exclusion chromatography and SDS-PAGE. Acta Pharm. 2008;58:199–206. doi: 10.2478/v10007-008-0003-6. [DOI] [PubMed] [Google Scholar]
- 39.Paborji M, Pochopin NL, Coppola WP, Bogardus JB. Chemical and physical stability of chimeric L6, a mouse-human monoclonal antibody. Pharm Res. 1994;11:764–771. doi: 10.1023/A:1018948901599. [DOI] [PubMed] [Google Scholar]
- 40.Moore JM, Patapoff TW, Cromwell ME. Kinetics and thermodynamics of dimer formation and dissociation for a recombinant humanized monoclonal antibody to vascular endothelial growth factor. Biochem. 1999;38:13960–13967. doi: 10.1021/bi9905516. [DOI] [PubMed] [Google Scholar]
- 41.Yoo EM, Wims LA, Chan LA, Morrison SL. Human IgG2 can form covalent dimers. J Immunol. 2003;170:3134–3138. doi: 10.4049/jimmunol.170.6.3134. [DOI] [PubMed] [Google Scholar]
- 42.Tankersley DL, Preston MS, Finlayson JS. Immunoglobulin G dimer: an idiotype-antiidiotype complex. Mol Immunol. 1988;25:41–48. doi: 10.1016/0161-5890(88)90088-0. [DOI] [PubMed] [Google Scholar]


