Abstract
Vitamin D is an important determinant of bone health at all ages. The plasma concentrations of 25-hydroxy vitamin D (25-OH D) and other metabolites are used as biomarkers for vitamin sufficiency and function. To allow for the simultaneous determination of five vitamin D metabolites, 25-OH D3, 25-OH D2, 24,25-(OH)2 D3, 1,25-(OH)2 D3, and 1,25-(OH)2 D2, in low volumes of human plasma, an assay using ultra-high-performance liquid chromatography–tandem mass spectrometry (UHPLC-MS/MS) was established. Plasma samples were spiked with isotope-labeled internal standards and pretreated using protein precipitation, solid-phase extraction (SPE) and a Diels–Alder derivatization step with 4-phenyl-1,2,4-triazoline-3,5-dione. The SPE recovery rates ranged from 55% to 85%, depending on the vitamin D metabolite; the total sample run time was <5 min. Mass spectrometry was conducted using positive ion electrospray ionization in the multiple reaction monitoring mode on a quadrupole–quadrupole-linear ion trap instrument after pre-column addition of methylamine to increase the ionization efficiency. The intra- and inter-day relative standard deviations were 1.6–4.1% and 3.7–6.8%, respectively. The limit of quantitation for these compounds was determined to be between 10 and 20 pg/mL. The 25-OH D results were compared with values obtained for reference materials (DEQAS). In addition, plasma samples were analyzed with two additional Diasorin antibody assays. All comparisons with conventional methods showed excellent correlations (r 2 = 0.9738) for DEQAS samples, demonstrating the high degree of comparability of the new UHPLC-MS/MS technique to existing methods.
Keywords: Vitamin D, Metabolites, Plasma, UHPLC, Tandem mass spectrometry, Quantification, Multiple reaction monitoring (MRM)
Introduction
Vitamin D plays a pivotal role in calcium homeostasis and skeletal metabolism throughout life [1]. Vitamin D is also important for the functioning of many other systems, such as the immune, cardiovascular, and reproductive systems [2, 3]. Vitamin D appears in two forms: the naturally occurring vitamin D3 in mammals and vitamin D2 derived from plant sources and chemical synthesis. The synthetic D2 forms offer the potential to be used as a tracer for investigating vitamin D metabolism. Vitamin D is hydroxylated in the liver to 25-hydroxyvitamin D (25-OH D) and released in the circulation, where it circulates mostly bound to vitamin D binding protein (DBP). The plasma concentration of 25-OH D is the most commonly used biomarker for vitamin D status and serves as a reservoir for further hydroxylation in the kidney and extra-renal tissues to 1α,25-dihydroxy-vitamin D (1,25-(OH)2 D) or 24,25-dihydroxy-vitamin D (24,25-(OH)2 D) [4]. 1,25-(OH)2 D and 24,25-(OH)2 D produced in the kidney are secreted into the circulation bound to DBP. The 1,25-(OH)2 D metabolite is considered to be most biologically active form whereas 24,25-(OH)2 is generally thought to be the first step in the metabolic pathway of D 25-OH D [4–6]. The plasma concentration of 24,25-(OH)2 D, its ratio to other metabolites, and the rate of turnover of 25-OH D have been proposed to have potential as alternative markers of vitamin D status [1].
Measurement of vitamin D metabolites in plasma is challenging because they are lipophilic, they are tightly bound to DBP, and their plasma concentrations are very low, in the namomolar range for 25-OH D3 and 25-OH D3 and picomolar levels for 1,25-(OH)2 D3 [7]. In addition, quantitation of vitamin D metabolites has proven difficult due to anomalous behavior of exogenously spiked metabolites, particularly in immunoassays [8], limiting the possibilities for correction of recovery and international standardization of assays. Immunoassays for 25-OH D and 1,25-(OH)2 D measure total metabolite concentration because they cannot distinguish between the D2 and D3 forms [9]. In addition, immunoassays for 25-OH D cross-react with 24,25-(OH)2 D3 [10].
Liquid chromatography (LC) with ultraviolet detection was, until recently, regarded as the standard technique for quantifying vitamin D [11–13]. Unfortunately, the limits of detection (LOD) and the required sample amounts are too high for application to circulating vitamin D metabolites present at very low concentration levels. Gas chromatography (GC)–mass spectrometry has also been applied to vitamin D metabolite quantitation [14, 15]; however, the high temperatures used in GC analyses often result in the formation of pyro and isopyro isomers of the metabolites and there is a risk of metabolite degradation. This can be avoided by using LC-MS/MS based methods [16]. LC-MS methods allow the separation of compounds based on their polarities, ionization behaviors, and mass-to-charge (m/z) ratios and can offer very low limits of quantitation. LC-MS methods have been successfully used for the detection of vitamin D metabolites in conjunction with fast atom bombardment [16], thermospray [17], and atmospheric-pressure ionization techniques such as electrospray ionization (ESI) and atmospheric-pressure chemical ionization [18–34]. In addition, pre- and post-column derivatization has been used to the enhance ionization efficiencies of vitamin D compounds. Cookson-type triazolinediones and triazolinediones-related reagents (e.g., 4-phenyl-1,2,4-triazoline-3,5-dione (PTAD)) have been used as dienophiles to react with the cisoid diene moiety [35–40]. A further increase of the ionization efficiency of 25-OH D was achieved by adding methylamine to the mobile phase, after PTAD derivatization, as reported by Higashi et al. [41]. However, these techniques lacked the sensitivity required to detect the low abundant vitamin D metabolites such as 1,25-(OH)2 D3 and others. In this paper, we describe a sensitive assay using UHPLC-MS/MS after PTAD derivatization for the quantitative determination of 25-OH D3, 25-OH D2, 24,25-(OH)2 D3, 1,25-(OH)2 D3, and 1,25-(OH)2 D2 in human plasma. Different methods for sample pretreatment and chromatography parameters were tested to improve recovery and detection sensitivity.
Experimental
Materials
Standards of 25-OH D3, 25-OH D2, 24,25-(OH)2 D3, 1,25-(OH)2 D3, 1,25-(OH)2D2, and PTAD were purchased from Sigma-Aldrich (Gillingham, UK). Stable isotope-labeled D6-25-OH D3, D6-25-OH D2, D6-1,25-(OH)2 D3, and D6-1,25-(OH)2 D2 (containing six deuterium atoms, three at C-26 and three at C-27) were synthesized by Chemaphor Inc. (Ottawa, ON, Canada). The HPLC-grade solvents methanol, acetonitrile, ethyl acetate, formic acid, and acetic acid were bought from Fisher Chemicals (Loughborough, UK). Oasis HLB solid-phase extraction (SPE) syringe barrel cartridges (1 mL, 30 mg sorbent) and Oasis HLB μelution SPE plates were purchased from Waters (Elstree, UK). Water was purified with a Barnsted Nanopure Diamond System (Barnsted International, Dubuque, IA, USA). Water and solvents used for the mobile phases were filtered with a 0.2-μm Supelco Nylon 66 membrane (Supelco, Bellefonte, PA, USA). Oxygen-free nitrogen and zero air were generated with an AB5000TGS gas generator (Parker Dominick Hunter, Tyne & Wear, UK).
Preparation of standard solutions and biological samples
Standards were dissolved in acetonitrile and deuterated standards in methanol to obtain 0.5 mg/mL stock solutions and stored at −20 °C. Working solutions were made by serial acetonitrile dilutions of the stock solutions. Plasma samples for method development were obtained from healthy volunteers and pooled to ensure anonymity. Ethical approval was obtained from Cambridge LREC 05/Q0108/30. Cross-calibration with Diasorin methods was performed using plasma samples from subjects included in earlier studies as detailed below [42, 43]. Plasma samples (200 or 50 μL) were spiked with 20 or 5 μL respectively of deuterated vitamin D standards, for SPE and liquid–liquid extraction (LLE) or μelution SPE respectively as internal standards, and incubated at room temperature for 1 h.
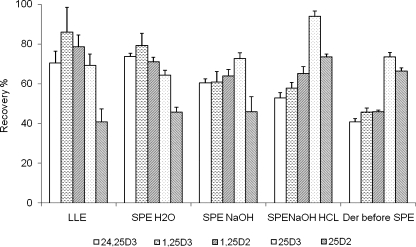
Different methods and conditions for sample pretreatment, extraction, and derivatization were tested to optimize recovery and signal-to-noise ratio as illustrated in Fig. 1 and further described in the “Results and discussion” section. Optimum results were obtained using the sample pretreatment extraction methods described below and was used for all subsequent analyses.
Fig. 1.
Recovery of spiked components from plasma suing different sample pretreatment methods (sequence: protein precipitation → extraction → derivatization). LLE, 200 μL of plasma, dried and extracted with 200 μL ethyl acetate and 100 μLH2O after protein precipitation. SPE H2O, after protein precipitation, acetonitrile was evaporated and water was added. SPE NaOH, SPE with 20 μL 1 M NaOH added before protein precipitation. SPE NaOH HCl, SPE with 20 μL 1 M NaOH added before protein precipitation followed by addition of HCl to pH 5 and SPE. Derivatization before SPE, plasma sample were dried and derivatized with 50 μL of PTAD, addition of 800 μL of H2O before SPE
Sample pretreatment
To precipitate protein and dissociate vitamin D metabolites from vitamin D binding proteins, acetonitrile (500 μL for SPE and LLE, 150 μL for μelution SPE) was added and vortexed for 1 min, and proteins were spun down by centrifugation for 15 min at 10,000×g. The supernatant was transferred to an Eppendorf vial, and acetonitrile was removed by using a gentle flow of nitrogen. The remaining solution was subjected to further sample preparation and SPE, LLE, or μelution SPE.
Solid-phase extraction and μelution SPE
For the SPE experiments, 800 μL of deionized water was added to the samples after protein precipitation and vortexed. For μelution SPE, 200 μL was used. The SPE cartridges were first activated with ethyl acetate, followed by methanol and equilibration with water (for SPE, 1 mL and for μelution SPE, 200 μL of each were used). The samples were then loaded onto the SPE cartridges or μelution plates and extracted using gravity or negative pressure, respectively. Cartridges were subsequently washed with 1 mL of H2O and 1 mL of aqueous 30% methanol, followed by drying using negative pressure. Samples were eluted first with 1 mL or 200 μL of acetonitrile, followed by 0.5 mL or 50 μL of ethyl acetate into Eppendorfs vials for SPE or μelution SPE, respectively.
Liquid–liquid extraction
For LLE, 200 μL ethyl acetate and 100 μL water were added to the samples after protein precipitation, vigorously vortexed for 30 s, and centrifuged for 5 min at 3,000×g, and the upper ethyl acetate layer was transferred into Eppendorf vials. The extraction process was repeated for the remaining water layer by adding 200 μL of ethyl acetate, and the two resulting ethyl acetate fractions were combined. The SPE/LLE eluents were dried under a gentle flow of N2.
Derivatization reaction
The derivatization reagent PTAD was dissolved in acetonitrile [39] or ethyl acetate at different concentrations, and samples were incubated at room temperature at various incubation times [44]. Best results were obtained using 0.5 mg/mL PTAD in acetonitrile solution, and the reaction was fully completed after 1 h at room temperature. In subsequent experiments, the experimental conditions were as follows: 50 μL of 0.5 mg/mL PTAD solution in acetonitrile was added to the SPE/LLE eluents, vortexed at room temperature for 1 h, and then transferred into sample vials. Ten microliters of the mixture was injected into the UHPLC-MS/MS system for analysis.
Chromatography and mass spectrometry
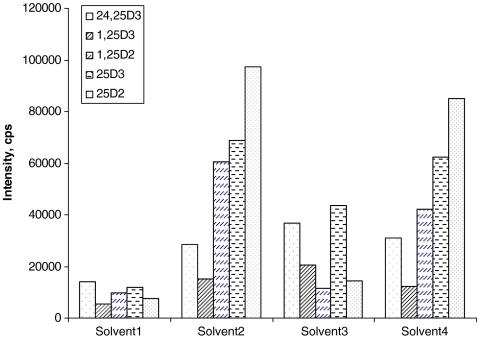
Separations were performed using a Waters UPLC system with Waters Acquity BEH C18 (1.7 μm), 2.1 × 50 mm columns. Different mobile phase compositions were tested (Fig. 3), and optimum results were obtained using a mobile phase gradient consisting of 0.1% formic acid in water (+5 mM methylamine) (A) and 0.1% formic acid in methanol (B). The flow rate was set at 300 μL min−1. The gradient ran from 65% B to 98% B in 3.5 min and remained at 98% B for 1 min before it was returned to 65% B for equilibration. For MS/MS analysis, a QTRAP 4000 triple quadrupole-linear ion trap mass spectrometer with a Turbolon-Spray interface (AB Sciex, Concord, Ontario, Canada) was used. The instrument was operated in ESI-positive ion multiple reaction monitoring (MRM) mode. For all MRM experiments of non-derivatized and derivatized vitamin D compounds, the (MH-H2O)+ ions were used as precursor ions, whereas (M + CH3NH3)+ adduct ions were used after CH3NH2 addition. MRM parameters were optimized using direct infusion experiments of standard compounds. The source parameters were optimized for each analyte and internal standard using methanol/water/formic acid (50:50:0.1, v/v/v). The ion spray voltage was set to 5,500 V, source temperature to 550 °C, curtain gas to 10 psi, ion source gas 1 to 70 psi, and ion source gas 2 to 65 psi. The MRM sequence consisted of three individual segments executed sequentially to monitor different transition pairs. The parameters for the MRM transitions are summarized in Table 1.
Fig. 3.
MRM signal intensities obtained for different mobile phase compositions: solvent 1 and 3, ion currents for transition derivatized precursor ion/fragment ion; solvent 2 and 4, ion currents for transition methylamine adduct of derivatized precursor ion/fragment ion. (Solvent 1: A, 0.1% formic acid in H2O and B, 0.1% formic acid in methanol. Solvent 2: A, 0.1% formic acid, 5 mM methylamine in H2O, and B, 0.1% formic acid in methanol. Solvent 3: A, 10 mM ammonium formate in H2O and B, 0.1% formic acid in methanol. Solvent 4: A, 10 mM ammonium formate, 5 mM methylamine in H2O, and B, 0.1% formic acid in methanol)
Table 1.
MRM time segments, precursor/product ion transitions, and collision energies for the investigated vitamin D compounds
| Segment | PTAD derivative | Precursor ion without additive | Precursor ion with additive | Collision energy | Product ion |
|---|---|---|---|---|---|
| m/z a | m/z | m/z | |||
| 1 | 24,25(OH)2 D3 | 574 | 623 | 21 | 298 |
| 2 | 1,25-(OH)2 D3 | 574 | 623 | 22 | 314 |
| 2 | 1,25-(OH)2 D2 | 586 | 635 | 22 | 314 |
| 2 | D6-1,25-(OH)2 D3 | 580 | 629 | 22 | 314 |
| 2 | D6-1,25-(OH)2 D2 | 592 | 641 | 22 | 314 |
| 3 | 25-OH D3 | 558 | 607 | 25 | 298 |
| 3 | 25-OH D2 | 570 | 619 | 20 | 298 |
| 3 | D6-25-OH D3 | 564 | 613 | 25 | 298 |
| 3 | D6-25-OH D2 | 576 | 625 | 20 | 298 |
a(M + H–H2O)+
Data analysis and assay performance
Analyst software version 1.4 (AB Sciex) was used for data acquisition, statistical calculations, and quantitation. Linear regression analysis using the least-squares method was used to evaluate the calibration curve of each analyte as a function of its concentration in plasma.
Assay precision and recovery rates
The intra- and inter-day coefficients of variation (CV), reflecting assay precision, were calculated from measurement of 10 samples extracted and analyzed in duplicate at five time points per day. This was repeated on three consecutive days. The recovery of the method was examined by analyzing stable isotope-labeled standards from plasma. A mixture of D6-25-OH D3, D6-25-OH D2, D6-1,25-(OH)2 D3, and D6-1,25-(OH)2 D2 was prepared; four different amounts were spiked into plasma and incubated at room temperature for 10 to 120 min. Optimal equilibration of the standard was found with 1 h incubation, and this was used for the remaining data presented in this paper. After incubation, the samples were pretreated and extracted with SPE and LLE and derivatized as described above. The recoveries were determined by comparing the peak areas of these standards after protein precipitation and SPE/LLE with peak areas from derivatized standards solutions.
Cross-calibration of 25-OH D3 with other LC-MS/MS methods and Diasorin immunoassays
The performance of the developed UHPLC-MS/MS method was compared with other LC-MS/MS methods registered with the vitamin D External Quality Assessment Scheme (DEQAS, http://www.deqas.org) by blind measurement of 12 samples in duplicate and comparison of the results using regression and Bland and Altman analysis. In addition, cross-calibration was performed with Diasorin Liaison immunoassay (28 samples) and Diasorin radio-immunoassay (RIA) (Diasorin, Still water, MN, USA) (14 samples) using plasma samples from subjects included in earlier studies [42, 43]. The Diasorin Liaison and RIA analysis were carried out as described earlier [42, 43], and statistical analyses was performed as described above.
Results and discussion
Optimization of sample pretreatment and derivatization procedures
Both SPE and LLE were evaluated for sample pretreatment in this study. In these optimization experiments, deuterated standards were spiked into plasma samples, and samples were extracted using LLE or SPE. Particular attention in these experiments was paid to the recovery of 1,25-(OH)2 D compounds because they are present in biological samples at much lower concentration levels than the other investigated vitamin D metabolites. The recoveries obtained for the 1,25-(OH)2 D compounds using LLE and SPE were similar, ranging from 71% to 86%. Ninety-six-well μelution SPE plates were also tested in this study, but the obtained well-to-well reproducibilities were not satisfactory (>10% relative standard deviations (RSD)), possibly due to uneven elution rates across the plate and drying out of individual sorbent wells. SPE was preferred over LLE in subsequent experiments as it can be readily automated for throughput enhancement. Further optimization steps were performed for the SPE process as summarized in Fig. 1. Addition of NaOH before protein precipitation was reported to release analytes from vitamin D binding proteins [45]. In our experiments, adding NaOH only slightly increased the recovery of 25-OH D and 25-OH D2, but had no effect on the recovery of low abundant 1,25-(OH)2 D. Therefore, to simplify the protocol, SPE without NaOH addition was used in subsequent experiments.
In the following experiments, different conditions for the post-extraction derivatization reaction of vitamin D compounds were evaluated. Because of the non-polar nature of vitamin D derivatives [46], a derivatization reaction was required in this study to enhance the ionization efficiencies, thus allowing detection of the very low abundant vitamin D metabolites. Specifically, PTAD [41] was used here. This reagent has been previously described, dissolved in either acetonitrile [39] or ethyl acetate [44]. Both solvents were also investigated here, at different PTAD concentrations. It was found that a reagent concentration of 0.5 mg/mL PTAD in acetonitrile exhibited the highest signal-to-noise ratios in the mass spectra. Different incubation times were also investigated, showing completion of the reaction after 1 h at room temperature. In addition, the derivatization reaction was also investigated prior to SPE, but solid-phase extraction of the derivatized vitamin D compounds resulted in very low analyte recovery rates as compared with post-extraction derivatization (Fig. 1), most likely due to the increased polarity of the derivatized analytes. For example, for 1,25-(OH)2 D, a recovery rate of only 45% was obtained for the derivatized compound versus 71% for the native compound.
UHPLC-MS/MS conditions
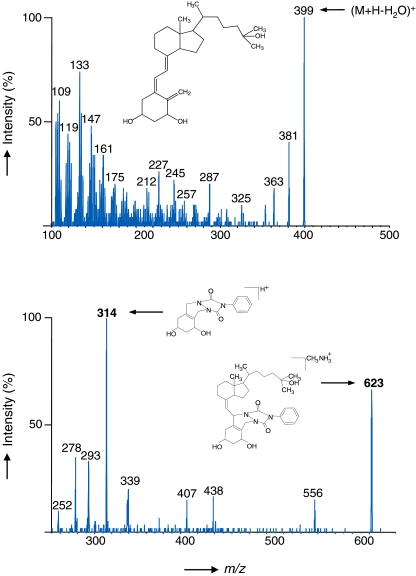
In addition to the enhanced ionization efficiency, derivatization with PTAD also shifted the m/z ratios of the precursor ions by ~200 Da to the region between m/z 600 and 650 Da, thus reducing interfering low m/z background ions. Figure 2 shows the collision-induced dissociation (CID) spectrum of PTAD-1,25-(OH)2 D3 and its proposed fragmentation behavior in comparison with the underivatized CID spectrum. Characteristically, the native vitamin D compounds show very rich product ion spectra, due to the availability of a large number of low-energy fragmentation pathways. On the contrary, the product ion spectrum of PTAD-derivatized 1,25-(OH)2 D3 exhibits only one major fragment ion at m/z 314, which is beneficial for sensitive MRM analysis. For MRM experiments of the non-derivatized as well as the derivatized vitamin D compounds, the (M + H–H2O)+ ions were used as precursor ions. However, as described in the “Experimental” section, methylamine was subsequently added to the mobile phase to further increase sensitivity, thus forming abundant (M + CH3NH3)+ adduct ions, with virtually identical MS/MS behavior [41].
Fig. 2.
Collision-induced dissociation spectra of 1,25-(OH)2 D3 ((M + H-H2O)+ at m/z 399, top spectrum) and PTAD-derivatized 1,25-(OH)2 D3 (M + CH3NH+3 at m/z 623, bottom spectrum). The transition m/z 623 → 314 was utilized for MRM
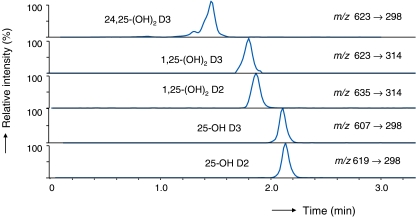
Different aqueous compositions of the mobile phase were also tested in this study, and the results of these experiments are summarized in Fig. 3. Aqueous mixtures containing 0.1% formic acid and 5 mM methylamine provided the highest signal intensities for vitamin D compounds. Using the optimized UHPLC conditions, the five vitamin D metabolites eluted within 4 min, as shown in Fig. 4. Baseline separation was not achieved for all compounds, but different MRM transition pairs could readily be used to differentiate all targeted compounds. Importantly, 24,25-(OH)2 D3, 1,25-(OH)2 D, and 25-OH D were fully separated and monitored in different time windows of the MRM sequence, thus avoiding ion suppression effects for low level compound such as 1,25-(OH)2 D3 induced by compounds circulating at high concentration levels, e.g., 25-OH D.
Fig. 4.
UHPLC-MRM chromatograms for 5 vitamin D metabolites
Two epimers, 6S and 6R, are produced by derivatization with PTAD because the reagent reacts with the s-cis-diene moiety from both the α- and β-sides; the ratio of 6S/6R is approximately 4:1 [47]. As a result, two peaks may be expected for each compound in the MRM ion chromatograms provided that the two epimers are fully separated during chromatography. In this case, the major peak for the 6S-isomer can be used for integration and quantification. In our study, the optimized flow rate of 300 μL min−1 gave separated epimers only for 24,25-(OH)2 D3 (Fig. 4); the other compounds’ epimers eluted as one peak, which further increased detection sensitivity.
Method validation
The recovery rates of the vitamin D compounds were examined by utilizing the stable isotope derivatives as outlined in the “Experimental” section. The recoveries were determined by comparing the peak areas of the MRM traces of pure standard solutions with the areas of the recovered stable isotope-labeled standards after incubation in plasma and sample pretreatment as outlined above, in the concentration range from 20 pg/μL to 2 ng/μL (Table 2). This method showed satisfactory recovery ranging from 55% to 85%. Co-extracted and co-eluted matrix constituents could potentially influence the ionization efficiencies of the analyte and adversely affect reproducibility and accuracy of the method, especially when external calibration curves are used for quantitation. Therefore, deuterated internal standards were utilized and were spiked to plasma samples prior to the sample pretreatment, to counteract any target ion suppression caused by the sample matrix. Furthermore, blank plasma samples were processed and spiked with deuterated standards at three concentration levels, 20, 200, and 1,000 pg/μL. The peak area response was compared with signals from injecting standard mixtures. The signal differences for all the standards were <15%, suggesting insignificant matrix effects.
Table 2.
Measured recoveries and associated precision (% recovery ± SD) for deuterated compounds at different fortification levels in plasma
| Recovery | 2 ng/μL | 1 ng/μL | 200 pg/μL | 20 pg/μL |
|---|---|---|---|---|
| D6-1,25(OH)2 D3 | 70.6 ± 1.4 | 59.9 ± 2.3 | 63.6 ± 12.3 | 55.6 ± 5.5 |
| D6-1,25(OH)2 D2 | 66.3 ± 4.1 | 55.9 ± 0.8 | 56.6 ± 4.4 | 62.7 ± 8.5 |
| D6-25-OH D3 | 66.4 ± 0.7 | 61.7 ± 2.1 | 60.3 ± 5.9 | 84.9 ± 2.4 |
| D6-25-OH D2 | 68.2 ± 1.6 | 58.0 ± 2.4 | 64.4 ± 6.1 | 79.3 ± 14.4 |
n = 5
Calibration curves were obtained from a series of vitamin D metabolite reference standards over a wide concentration range, using the corresponding stable isotope compounds as internal standards. For 24,25-(OH)2 D3, no deuterated standard was commercially available; therefore, D6-1,25-(OH)2 D3 was used instead because of its similar structure and physicochemical properties. Calibration curves were constructed by plotting peak area ratios of the MRM signals of the reference standard and the internal standard against the concentration. An example for a calibration curve is shown in Fig. 6. The linear range and correlation coefficients obtained for the regression analysis based on a minimum of six data points are summarized in Table 3. The linear regression analysis showed excellent linearity over the calibration range (r 2 ≥ 0.999). The limit of quantitation (LOQ) was studied in order to investigate the detection sensitivity of the developed assay. In this study, the LOQ was defined as the lowest concentration for which RSD values of 10% or less were observed [48]. LOQ data (except for 24,25-(OH)2 D3) are shown in Table 3. The LOQs for the reference standards were ~20 pg/mL for 1,25-(OH)2 D3 and ~10 pg/mL for 1,25-(OH)2 D2, 25-OH D3, and 25-OH D2. The reproducibility of the proposed method was evaluated by carrying out five replicate quantitative determinations for each of the studied compounds spiked in plasma, on the same day, and five replicates on three consecutive days. Intra- and inter-day RSD values for the quantitation of four vitamin D metabolites in human plasma are summarized in Table 3. These numbers show that excellent reproducibility can be obtained by this method. The %RSD values of intra- and inter-day precision ranged from 1.6% to 3.9% and 3.7% to 6.1%, respectively, indicating little variation in the sample preparation and UHPLC-MS/MS performance.
Fig. 6.
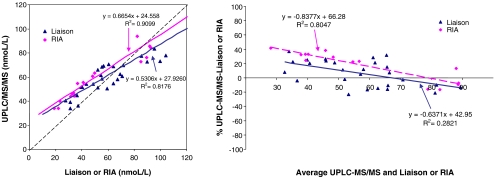
Regression analysis of 25-OH D plasma concentrations in 42 subjects measured by in-house UHPLC-MS/MS and Diasorin Liaison and RIA methods (left). Bland–Altman plot (right)
Table 3.
Limits of quantitation (LOQ), linear dynamic range, and intra- and inter-day precision in the determination of vitamin D metabolites from plasma
| Component | LOQ pg/mL (plasma) | Linearity (pg/μL) | r 2 | Intra-day (%CV) | Inter-day (%CV) |
|---|---|---|---|---|---|
| 24,25-(OH)2 D3 | n/aa | 0.1–300 | 0.9995 | 4.1 | 6.8 |
| 1,25-(OH)2 D3 | 20 | 0.2–50 | 0.9990 | 3.9 | 6.1 |
| 1,25-(OH)2 D2 | 10 | 0.1–50 | 0.9992 | 2.2 | 6.2 |
| 25-OH D3 | 10 | 2.5–300 | 0.9999 | 3.8 | 5.8 |
| 25-OH D2 | 10 | 2.5–300 | 0.9996 | 1.6 | 3.7 |
No LOD was given because of the lack of a commercial deuterated standard. 24,25(OH) D3 and 1,25(OH) D3 were similar, and the LOQ is estimated to be similar to that of 1,25(OH) D3
a24,25-(OH)2 D3 was quantified using D6-25-OH D2 as internal standard
Method comparability and application
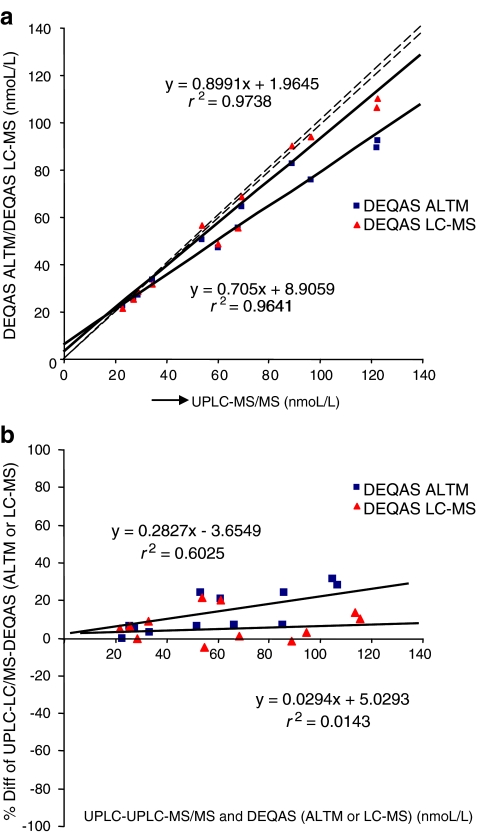
Significant inter-laboratory and inter-method variability of the 25-OH D results exists [49–58], and there is currently no method that is considered the gold standard method for analyzing 25-OH D [22, 27]. The international vitamin D Quality Assessment Scheme (DEQAS) monitors the performance of laboratories measuring 25-OH D using different analytical methods [50] and allows the comparison between methods and between laboratories using the same or similar methods. To assess the comparability of the developed method with existing methods, we performed regression and Bland–Altman analysis on the 25-OH D concentration of 12 DEQAS samples as measured by laboratories registered with DEQAS using LC-MS (Fig. 5a). A highly significant linear association (r 2 = 0.9738; P < 0.0001) was found, and Bland–Altman analysis showed no concentration-dependent and systematic differences between our and other LC-MS methods (Fig. 5b). Also, a highly significant linear association (r 2 = 0.9641; P < 0.0001) was found when comparing with DEQAS All Laboratory Trimmed Mean (ALTM) values (Fig. 5a). Further, in-house cross-calibration with two Diasorin methods was performed using 42 plasma samples, 28 of which were analyzed with a Liaison automated immunoassay platform and 14 with the Diasorin RIA method (Fig. 6). Prior in-house cross-correlation between these Diasorin methods showed a high linear association and no systematic bias (unpublished). UHPLC-MS/MS showed good correlation with both Daisorin Liaison (r 2 = 0.8176) and RIA (r 2 = 0.9099; Fig. 6). Bland–Altman analysis (Fig. 6) showed no concentration-dependent and systematic differences between the Diasorin Liaison and our UHPLC-MS/MS method, whereas for the Diasorin RIA, there was a significant negative linear association between the method bias and concentration, indicating that the method difference is higher at lower concentrations. In the future, we will conduct further analyses to investigate the method comparability for the present assay by using appropriate certified reference materials (CRMs) compatible with the diverse analytical methods for 25-OH D. The development of CRMs, containing different levels of endogenous vitamin D metabolites in human plasma, is currently undertaken by the National Institute of Standards and Technology (NIST), after the initial release of CRMs for 25-OH D (NIST SRM 972) containing horse serum and exogenously spiked vitamin D metabolites [59]. Recent research, however, has shown that the recovery of exogenous vitamin D metabolites differs between immune and chromatographic assays and that the use of non-human serum may cause matrix effects [58, 60] and is therefore inappropriate when comparing results derived from different methods.
Fig. 5.
Cross-calibration diagrams for 25-OH D: a in-house UHPLC-MS/MS versus DEQAS LC-MS and DEQAS ALTM values for 12 DEQAS samples; b Bland–Altman plots (bottom)
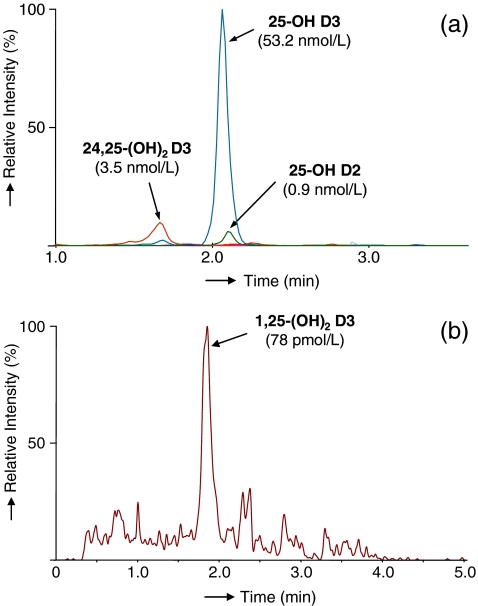
Finally, the circulating concentration of 1,25-(OH)2 D3 is usually in the range 50–200 pmol/L (20–100 pg/mL) for normal adults and usually at least 10× less for 1,25-(OH)2 D2; values for 25-OH D in the population are typically between 0.5 and 200 nmol/L (0.2–80 ng/mL), and levels of 0.5–20 nmol/L (0.2–83 ng/mL) are seen for 24,25-OH D3 [7]. The limits of quantitation reported in this study (Table 3) obtained from 200 μL of plasma are sufficiently low to allow precise quantitative determination of the most important metabolites without analyte enrichment during sample preparation. 1,25-(OH)2 D may be circulating at levels as low as 0.2 pg/mL [7]. Thus, analyte enrichment would be required, which is easily incorporated into the developed sample preparation protocol. Figure 7 shows typical MRM chromatograms for some of the investigated vitamin D metabolites, illustrating in particular the very low plasma concentrations seen for 1,25-(OH)2 D2.
Fig. 7.
MRM chromatograms of vitamin D metabolites in plasma after SPE and PTAD derivatization using sequential MRM time windows (the concentration levels are given in parentheses). a Vitamin D metabolites 24,25-(OH)2 D3, 25-OH D3 and 25-OH D2; b low abundant vitamin D metabolite 1,25-(OH)2 D3
Conclusions
In this report, we describe the development of a UHPLC-MS/MS assay for simultaneous quantification of five important vitamin D metabolites, namely, 25-OH D3, 25-OH D2, 24,25-(OH)2 D3, 1,25-(OH)2 D3, and 1,25-(OH)2 D2 in human plasma. This method utilizes SPE of plasma samples, followed by PTAD derivatization and methylamine addition to enhance detection sensitivity. MRM analysis was carried out on a triple quadrupole mass spectrometer. The limits of quantitation for all investigated compounds were between 10 and 20 pg/mL, with linear dynamic ranges of up to three orders of magnitude. Precision values in human plasma demonstrated excellent performance, ranging from 1.6% to 3.9% and 3.7% t 6.1% for intra- and inter-day measurements, respectively. Finally, the method showed high correlation with established techniques for the measurement of 25-OH D.
Acknowledgments
Open Access
This article is distributed under the terms of the Creative Commons Attribution Noncommercial License which permits any noncommercial use, distribution, and reproduction in any medium, provided the original author(s) and source are credited.
References
- 1.Prentice A, Goldberg GR, Schoenmakers I. Am J Clin Nutr. 2008;88:500S–506S. doi: 10.1093/ajcn/88.2.500S. [DOI] [PubMed] [Google Scholar]
- 2.Norman AW. Am J Clin Nutr. 2008;88:491S–499S. doi: 10.3945/ajcn.2008.27049. [DOI] [PubMed] [Google Scholar]
- 3.Dusso AS, Brown AJ, Slatopolsky E. Am J Physiol Renal Physiol. 2005;289:F8–F28. doi: 10.1152/ajprenal.00336.2004. [DOI] [PubMed] [Google Scholar]
- 4.Horst RL, Reinhardt TA, Reddy GS. Vitamin D metabolism. In: Feldman D, Pike JW, Glorieux FH, editors. Vitamin D. 2. Burlington: Elsevier Academic; 2005. pp. 15–36. [Google Scholar]
- 5.Omdahl JL, May B. The 25-hydroxyvitaminD24-hydroxylase. In: Feldman D, Pike JW, Glorieux FH, editors. Vitamin D. 2. Burlington: Elsevier Academic; 2005. pp. 85–104. [Google Scholar]
- 6.van Leeuwen JP, van den Bemd GJ, van Driel M, Buurman CJ, Pols HA. Steroids. 2001;66:375–380. doi: 10.1016/S0039-128X(00)00155-0. [DOI] [PubMed] [Google Scholar]
- 7.Shimada K, Mitamura K, Higashi T. J Chromatogr A. 2001;935:141–172. doi: 10.1016/S0021-9673(01)00943-8. [DOI] [PubMed] [Google Scholar]
- 8.Carter GD, Jones JC, Berry JL. J Steroid Biochem Molecul Biol. 2007;103:480–482. doi: 10.1016/j.jsbmb.2006.11.007. [DOI] [PubMed] [Google Scholar]
- 9.Luque de Castro MD, Fernandez-Romero JM, Oritz-Boyer F, Quesada JM. J Pharmaceut Biomed Anal. 1999;20:1–17. doi: 10.1016/S0731-7085(99)00027-8. [DOI] [PubMed] [Google Scholar]
- 10.Lind C, Chen J, Byrjalsen I. Clin Chem. 1997;43:943–949. [PubMed] [Google Scholar]
- 11.Jones G. Clin Chem. 1978;24:287–298. [PubMed] [Google Scholar]
- 12.Shimada S, Mitamura K, Kitama N. Biomed Chromatogr. 1995;9:229–232. doi: 10.1002/bmc.1130090508. [DOI] [PubMed] [Google Scholar]
- 13.Lensmeyer GL, Wiebe DA, Binkley N, Drezner MK. Clin Chem. 2006;52:1120–1126. doi: 10.1373/clinchem.2005.064956. [DOI] [PubMed] [Google Scholar]
- 14.Coldwell RD, Trafford DJL, Makin HLJ. J Mass Spec. 1995;30:348–356. doi: 10.1002/jms.1190300218. [DOI] [Google Scholar]
- 15.Ishigai M, Ishitani Y, Kumaki K. J Chromatogr B. 1997;704:11–17. doi: 10.1016/S0378-4347(97)00423-4. [DOI] [PubMed] [Google Scholar]
- 16.Yeung P, Vouros P, Reddy GS. J Chromatogr. 1993;645:115–123. doi: 10.1016/0021-9673(93)80625-I. [DOI] [PubMed] [Google Scholar]
- 17.Watson D, Setchell KD, Ross R. Biomed Chromatogr. 1991;5:153–160. doi: 10.1002/bmc.1130050404. [DOI] [PubMed] [Google Scholar]
- 18.Kushnir MM, Ray JA, Rockwood AL, Roberts WL, La’ulu SL, Whittington JE, Meike AW. Am J Clin Pathol. 2010;134:148–156. doi: 10.1309/AJCPPIA7DFBT4GKS. [DOI] [PubMed] [Google Scholar]
- 19.Van den Ouweland JM, Beijers AM, Demacker PN, Van Daal H. J Chromatogr B. 2010;878:1163–1168. doi: 10.1016/j.jchromb.2010.03.035. [DOI] [PubMed] [Google Scholar]
- 20.Vogeser M (2010) J Steroid Biochem Mol Biol (in press)
- 21.Duan X, Weinstock-Guttman B, Wang H, Bang E, Li R, Ramanathan M, Qu J. Anal Chem. 2010;82:2488–2497. doi: 10.1021/ac902869y. [DOI] [PubMed] [Google Scholar]
- 22.Tai SS, Bedner M, Phinney KW. Anal Chem. 2010;82:1942–1948. doi: 10.1021/ac9026862. [DOI] [PMC free article] [PubMed] [Google Scholar]
- 23.Singh RJ. Methods Mol Biol. 2010;603:509–517. doi: 10.1007/978-1-60761-459-3_50. [DOI] [PubMed] [Google Scholar]
- 24.Hojskov CS, Heickendorf L, Moller HJ. Clin Chim Acta. 2010;411:114–116. doi: 10.1016/j.cca.2009.10.010. [DOI] [PubMed] [Google Scholar]
- 25.Bunch DR, Miller AY, Wang S. Clin Chem Lab Med. 2009;47:1565–1572. doi: 10.1515/CCLM.2009.342. [DOI] [PubMed] [Google Scholar]
- 26.Knox S, Harris J, Carlton L, Wallace AM. Ann Clin Biochem. 2009;46:226–230. doi: 10.1258/acb.2009.008206. [DOI] [PubMed] [Google Scholar]
- 27.Roth HJ, Schmidt-Gayk H, Weber H, Niedrau C. Ann Clin Biochem. 2008;45:153–159. doi: 10.1258/acb.2007.007091. [DOI] [PubMed] [Google Scholar]
- 28.Chen H, McCoy LF, Schleicher RL, Pfeiffer CM. Clin Chim Acta. 2008;391:6–12. doi: 10.1016/j.cca.2008.01.017. [DOI] [PubMed] [Google Scholar]
- 29.Saenger AK, Laha TJ, Bremner DE, Sadrzadeh SM. Am J Clin Pathol. 2006;125:914–920. doi: 10.1309/J32UF7GTQPWN25AP. [DOI] [PubMed] [Google Scholar]
- 30.Priego Capote F, Ruiz Jimenez J, Mata Granados JM, Luque de Castro MD. Rapid Commun Mass Spectrom. 2007;21:1745–1754. doi: 10.1002/rcm.3014. [DOI] [PubMed] [Google Scholar]
- 31.Maunsell Z, Wright DJ, Rainbow SJ. Clin Chem. 2005;51:1683–1690. doi: 10.1373/clinchem.2005.052936. [DOI] [PubMed] [Google Scholar]
- 32.Tsugawa N, Suhara Y, Kamao M, Okano T. Anal Chem. 2005;77:3001–3007. doi: 10.1021/ac048249c. [DOI] [PubMed] [Google Scholar]
- 33.Weiskopf AS, Vouros P, Cunniff J, Binderup E, Bjorkling F, Binderup L, White MC, Posner GH. J Mass Spectrom. 2001;36:71–78. doi: 10.1002/jms.105. [DOI] [PubMed] [Google Scholar]
- 34.Higashi T, Shimada K, Toyo’oka T. J Chromatogr B. 2009;878:1554–1561. doi: 10.1016/j.jchromb.2009.11.026. [DOI] [PubMed] [Google Scholar]
- 35.Higashi T, Awada D, Shimada K. Biol Pharm Bull. 2001;24:738–743. doi: 10.1248/bpb.24.738. [DOI] [PubMed] [Google Scholar]
- 36.Higashi T, Awada D, Shimada K. Biomed Chromatogr. 2001;15:133–140. doi: 10.1002/bmc.43. [DOI] [PubMed] [Google Scholar]
- 37.Higashi T, Homma S, Iwata H, Shimada K. J Pharm Biomed Anal. 2002;31:947–955. doi: 10.1016/S0731-7085(02)00135-8. [DOI] [PubMed] [Google Scholar]
- 38.Higashi T, Yamauchi A, Shimada K. Anal Sci. 2003;19:941–943. doi: 10.2116/analsci.19.941. [DOI] [PubMed] [Google Scholar]
- 39.Aronov PA, Hall LM, Dettmer K, Stephensen CB, Hammock BD. Anal Bioanal Chem. 2008;391:1917–1930. doi: 10.1007/s00216-008-2095-8. [DOI] [PMC free article] [PubMed] [Google Scholar]
- 40.Murao N, Ishigai M, Sekiguchi N, Takahashi T, Aso Y. Anal Biochem. 2005;346:158–166. doi: 10.1016/j.ab.2005.08.002. [DOI] [PubMed] [Google Scholar]
- 41.Higashi T, Shibayama Y, Fuji M, Shimada K. Anal Bioanal Chem. 2008;391:229–238. doi: 10.1007/s00216-007-1780-3. [DOI] [PubMed] [Google Scholar]
- 42.Dibba B, Prentice A, Ceesay M, Mendy M, Darboe S, Stirling DM, Cole TJ, Poskit ME. Am J Clin Nutr. 2002;76:681–686. doi: 10.1093/ajcn/76.3.681. [DOI] [PubMed] [Google Scholar]
- 43.Ginty F, Rennie KL, Mills L, Stear S, Jones S, Prentice A. Bone. 2005;36:101–110. doi: 10.1016/j.bone.2004.10.001. [DOI] [PubMed] [Google Scholar]
- 44.Eyles D, Anderson C, Ko P, Jones A, Tomas A, Burne T, Mortensen PB, Norggard-Pederser B, Hougaard DM, McGrath J. Clin Chim Acta. 2009;403:145–151. doi: 10.1016/j.cca.2009.02.005. [DOI] [PubMed] [Google Scholar]
- 45.Vogeser M, Kyriatsoulis A, Huber E, Kobold U. Clin Chem. 2004;50:1145–1147. doi: 10.1373/clinchem.2004.031831. [DOI] [PubMed] [Google Scholar]
- 46.Gao S, Zhang ZP, Karnes HT. J Chromatogr B. 2005;82(5):98–110. doi: 10.1016/j.jchromb.2005.04.021. [DOI] [PubMed] [Google Scholar]
- 47.Shimizu M, Yamada S. Vitamins (Japan) 1994;68:15–30. [Google Scholar]
- 48.Bliesner DM. Validating chromatographic methods: a practical guide. New York: Wiley; 2006. [Google Scholar]
- 49.Binkley N, Krueger D, Cowgill L, Plum L, Lake E, Hansen KE, Deluca HF, Drezner MK. J Clin Endocrinol Metab. 2004;89:3152–3157. doi: 10.1210/jc.2003-031979. [DOI] [PubMed] [Google Scholar]
- 50.Carter GD, Jones JC. Annals Clin Biochem. 2009;46:79–81. doi: 10.1258/acb.2008.008135. [DOI] [PubMed] [Google Scholar]
- 51.Carter GD, Carter R, Jones J, Berry J. Clin Chem. 2004;50:2195–2197. doi: 10.1373/clinchem.2004.040683. [DOI] [PubMed] [Google Scholar]
- 52.Terry AH, Sandrock T, Wayne Meikle A. Clin Chem. 2005;8:1565–1566. doi: 10.1373/clinchem.2005.054239. [DOI] [PubMed] [Google Scholar]
- 53.Blinkley N, Krueger D, Gemar D, Drezner MK. J Clin Endocrinol Metab. 2008;93:1804–1808. doi: 10.1210/jc.2007-2340. [DOI] [PubMed] [Google Scholar]
- 54.Yates AM, Bowron A, Carlton L, Heyes J, Field H, Rainbow S, Keevil B. Clin Chem. 2008;54:2082–2084. doi: 10.1373/clinchem.2008.110452. [DOI] [PubMed] [Google Scholar]
- 55.Fraser WD. Ann Clin Biochem. 2009;46:3–4. doi: 10.1258/acb.2008.008225. [DOI] [PubMed] [Google Scholar]
- 56.Massert C, Souberbielle JC. Clin Chem. 2009;55:1247–1248. doi: 10.1373/clinchem.2008.122952. [DOI] [PubMed] [Google Scholar]
- 57.Phinney KW. Am J Clin Nutr. 2008;88:511S–512S. doi: 10.1093/ajcn/88.2.511S. [DOI] [PubMed] [Google Scholar]
- 58.Horst RL (2010) J Steroid Biochem Mol Biol (in press)
- 59.National Institute of Standards and Technology, SRM 972—Vitamin D in Human Serum. http://www.nist.gov/ts/msd/srm/
- 60.Carter GD, Jones JC, Berry JL. J Steroid Biochem Mol Biol. 2007;103:480–482. doi: 10.1016/j.jsbmb.2006.11.007. [DOI] [PubMed] [Google Scholar]


