

Abstract
Allosteric binding sites on adenosine -A1 and -A3 receptors represent attractive therapeutic targets for amplifying, in a spatially and temporally selective manner, the tissue protective actions of endogenous adenosine. This study has directly quantified the kinetics of agonist/G protein-coupled receptor interactions at the single-cell level, reflecting the physiological situation in which intracellular signaling proteins can exert major allosteric effects on agonist-receptor interactions. The association and dissociation rate constants at both A1 and A3 receptors, and therefore the affinity of the fluorescent adenosine derivative ABA-X-BY630 (structure appears in J Med Chem 50:782–793, 2007), were concentration-independent. The equilibrium dissociation constants of ABA-X-BY630 at A1 and A3 receptors were approximately 50 and 10 nM, respectively, suggesting that, even in live cells, low agonist concentrations predominantly detect high-affinity receptor states. At A1 receptors, the dissociation of ABA-X-BY630 (30 nM) was significantly faster in the absence (koff = 1.95 ± 0.09 min−1) compared with the presence of the allosteric enhancer (2-amino-4,5-dimethyl-3-thienyl)(3-(trifluoromethyl)phenyl)-methanone (PD81,723; 10 μM; koff = 0.80 ± 0.03 min−1) and allosteric inhibitor 4-methoxy-N-(7-methyl-3-(2-pyridinyl)-1-isoquinolinyl)benzamide (VUF5455; 1 μM; koff = 1.48 ± 0.16 min−1). In contrast, ABA-X-BY630 dissociation from A3 receptors was significantly slower in the absence (koff = 0.78 ± 0.18 min−1) than in the presence of the allosteric inhibitors VUF5455 (1 μM; koff = 3.15 ± 0.12 min−1) and PD81,723 (10 μM; koff = 2.46 ± 0.18 min−1). An allosteric mechanism of action has previously not been identified for PD81,723 at the A3 receptor or VUF5455 at the A1 receptor. Furthermore, the marked enhancement in fluorescent agonist dissociation by VUF5455 in living cells contrasts previous observations from broken cell preparations and emphasizes the need to study the allosteric regulation of agonist binding in living cells.
Introduction
G protein-coupled receptors (GPCRs) represent the largest superfamily of cell surface receptors. Heterotrimeric ligand/GPCR/G protein complexes engender enormous diversity within cell signaling; hence, a large proportion of current pharmaceuticals target GPCRs (Overington et al., 2006). The majority of these drugs mediate their action through the primary, endogenous ligand binding site, which, for GPCRs, is known as the orthosteric binding site. However, GPCRs also contain allosteric binding sites (that is, any receptor binding site that is topographically distinct from the orthosteric site) (May et al., 2007b). GPCR signaling, even at the simplest level, is governed by allosteric interactions with intracellular signaling proteins. Agonist binding within the extracellular domain promotes stabilization of GPCR conformations that preferentially interact with intracellular signaling proteins (Kenakin, 2002). GPCRs can also interact with transmembrane proteins and allosteric small molecules. These interactions stabilize an alternative subset of receptor conformations that in turn can cause a change in the rate of orthosteric ligand association and/or dissociation (May et al., 2007b). As a result, a wealth of information with respect to the conformational changes occurring within the receptor binding site can be obtained through assessing ligand binding kinetics under different conditions. However, the rapid nature of agonist kinetics at nonpeptide GPCRs in the presence of the active G protein cycle has largely prevented any direct investigation of the binding kinetics of these agonists in living cells.
Over recent years, drug design targeted toward allosteric binding sites on GPCRs has gained momentum within drug discovery. This approach has a number of potential advantages, including the selective manipulation of GPCRs that contain high sequence homology within the orthosteric domain across receptor subtypes and the ability to maintain the spatial and temporal signaling profile of the endogenous ligand, only enhancing or inhibiting receptor activity where and when the endogenous agonist is present (Birdsall et al., 1996). A fundamental method to detect GPCR allosterism has been to observe a change in the dissociation kinetics of an orthosteric ligand in the presence of a putative allosteric modulator (Christopoulos and Kenakin, 2002). The mechanism of action for the first identified GPCR allosteric enhancers, a series of adenosine A1 receptor (A1AR) selective 2-amino-3-benzoylthiophene derivatives, including PD81,723, was confirmed through detecting a decrease in the rate of agonist dissociation (Bruns and Fergus, 1990). This method was used more recently to identify adenosine A3 receptor (A3AR) allosteric modulators, including VUF5455 (Gao et al., 2001).
To date, the majority of dissociation kinetic assays involve membrane-based radioligand binding, which has a number of limitations. For example, radioligand dissociation is generally measured in the presence of a saturating concentration of competitive orthosteric ligand (Bruns and Fergus, 1990; Ellis et al., 1991; Lee and el-Fakahany, 1991; Lazareno and Birdsall, 1995; Christopoulos et al., 1997; Gao et al., 2001; Avlani et al., 2004; Dowling and Charlton, 2006; Springael et al., 2006; May et al., 2007a). This requires the assumption that the second ligand does not alter radioligand dissociation. Although consistent within a theoretical framework describing competitive interactions between compounds at a monomeric receptor, more complex interactions resulting from multistep ligand binding (Swaminath et al., 2004; Ilien et al., 2009) or receptor dimerization (Christopoulos and Kenakin, 2002; Springael et al., 2006; Han et al., 2009) could lead to a change in the radioligand dissociation rate. In addition, the absence of the G protein cycle in membrane-based assays generates a large bias for an agonist radioligand to detect the active, G protein-coupled, receptor conformation. Finally, membrane-based radioligand binding assays lack the temporal resolution required to detect rapid changes in ligand binding. Taken together, these methodological limitations have restricted both qualitative and quantitative investigations of agonist kinetics either alone or in the presence of allosteric modulators at nonpeptide GPCRs in living cells.
This study focused on visualizing and quantifying, at the single cell level, the binding kinetics of an adenosine receptor agonist in the absence and presence of allosteric modulators and has used a closed perfusion system maintained under constant pressure and environmentally controlled. An advantage of this technique is that rapid removal of free ligand upon reservoir exchange allows agonist dissociation to be performed in the absence of a saturating concentration of competitive orthosteric ligand. Specifically, this study has directly quantified, at the single-cell level, the kinetics of the fluorescent adenosine derivative ABA-X-BY630 (Middleton et al., 2007) at the human A1AR and A3AR. Furthermore, the influence of the allosteric modulators PD81,723 and VUF5455 on the kinetics of ABA-X-BY630 binding and function has been investigated at the human A1AR and A3AR in live cells.
Materials and Methods
Materials.
Fluo-4AM and Pluronic acid were from Invitrogen (Carlsbad, CA), fetal calf serum was from PAA Laboratories (Pasching, Austria), ABA-X-BY630 was from CellAura Technologies Ltd (Nottingham, UK), l-glutamine and trypsin from Lonza Verviers SPRL (Verviers, Belgium), the ERK Surefire kits were from PerkinElmer Life and Analytical Sciences. VUF5455 was synthesized by B. Kellam (Centre for Biomolecular Sciences, School of Pharmacy, University of Nottingham, UK). All other chemicals were from Sigma-Aldrich Inc (St. Louis, MO).
Cell Culture.
Chinese hamster ovary (CHO-K1) cell lines stably expressing either the human adenosine A1 receptor (CHO-A1; BMAX = 3350 ± 315 fmol/mg protein; Cordeaux et al., 2000) or the human adenosine A3 receptor (CHO-A3; BMAX = 765 ± 22 fmol/mg protein; Cordeaux et al., 2008), respectively, were maintained in Dulbecco's modified Eagle's medium (DMEM)/nutrient mix Ham's F12 containing 10% fetal calf serum (FCS) and 2 mM l-glutamine at 37°C in a humidified incubator containing 5% CO2. When confluent, cells were harvested (0.25% trypsin) and centrifuged (1000g for 5 min), and the resulting pellet resuspended in DMEM-F12 containing 10% FCS and 2 mM glutamine. Before assaying, cells were seeded in DMEM-F12 containing 10% FCS and 2 mM glutamine for at least 18 h and grown to 80 to 100% confluence.
Calcium Mobilization Assay.
CHO-A1 and CHO-A3 cells seeded into black-sided 96-well view plates were incubated in 100 μl of HEPES-buffered saline solution (HBSS; 25 mM HEPES, 10 mM glucose, 146 mM NaCl, 5 mM KCl, 1 mM MgSO4, 2 mM sodium pyruvate, and 1.3 mM CaCl2) containing 0.1% BSA, 2.5 mM probenecid, 0.5 mM Brilliant Black BN, 2.3 μM Fluo-4AM, and 0.023% Pluronic acid at 37°C for 1 h. Plates were then loaded onto a fluidics plate reader (FlexStation; Molecular Devices, Sunnyvale, CA) and fluorescence measured (excitation = 485 nm; emission = 520 nm) every 1.52 s for up to 200 s with the addition of HBSS in the absence or presence of ABA-X-BY630 at 15 s.
ERK1/2 Phosphorylation Assay.
ERK1/2 phosphorylation was measured using the ERK Surefire kit (PerkinElmer Life and Analytical Sciences). CHO-A1 and CHO-A3 cells seeded into 96-well clear plates were washed twice with PBS and maintained in 100 μl of DMEM-Ham's F12 containing 2 mM glutamine for at least 4 h before assaying. Cells were then exposed to ABA-X-BY630 for 5 min, after which stimulation was terminated by the removal of media and the addition of 40 μl of SureFire lysis buffer to each well. A 1:80:20:120 (v/v) dilution of AlphaScreen beads/lysate/activation buffer/reaction buffer in an 5.5 μl of total volume was then transferred to a white opaque 384-well ProxiPlate (PerkinElmer Life and Analytical Sciences) in the dark. This plate was then incubated in the dark at 37°C for 2 h after which time the fluorescence signal was measured by an Envision plate reader (PerkinElmer Life and Analytical Sciences) using standard AlphaScreen settings.
Confocal Microscopy.
Live cell imaging of nontransfected CHO-K1 (CHO-NT), CHO-A1, and CHO-A3 cells seeded onto 32-mm circular coverslips was performed using a laser-scanning confocal microscope (Zeiss LSM 510; Carl Zeiss GmbH, Jena, Germany) and a Zeiss Plan-Neofluar 40× 1.3 numerical aperture oil-immersion objective. A 633 nm HeNe laser was used for the excitation of ABA-X-BY630 (a BODIPY630/650 conjugate), with emission being detected using a 650-nm long-pass filter. A custom-made, temperature-controlled perfusion system was used for drug delivery and removal. The perfusion system consisted of an imaging cell (a closed chamber with a total volume of 400 μl) coupled to six fluid reservoirs. A manually operated three-way valve system was employed to select the reservoir for use and a constant rate of flow maintained by means of an air pressure manifold. For the duration of each experiment, phase and fluorescence images were captured every 2 s. Within each field of view, a region of interest was drawn around the plasma membrane of 10 cells, and the changes in fluorescence intensity were determined over time (Zeiss AIM 4.2 Software).
Characterizing the Association and Dissociation Kinetics of ABA-X-BY630 at the A1AR and A3AR.
Initial live-cell kinetic experiments, characterizing the association and dissociation kinetics of ABA-X-BY630 (3–100 nM), involved 30 s of HBSS perfusion to obtain the basal fluorescence followed by 4-min exposure of cells to ABA-X-BY630 after which ABA-X-BY630 perfusion was terminated and replaced by HBSS-only perfusion. In each case, the temperature was maintained at 37°C, the flow rate was equal to or greater than 5 ml/min and the pinhole diameter (1 Airy Unit; 1.1-μm optical slice), laser power and gain were kept constant within experiments using the same receptor subtype.
Characterizing the Influence of the Allosteric Modulators PD81,723 and VUF5455 on ABA-X-BY630 Dissociation from the A1AR and A3AR, Respectively.
CHO-A1 and CHO-A3 cells were exposed to 30 nM ABA-X-BY630 alone for 2 min, after which CHO-A1 cells only were exposed to 30 nM ABA-X-BY630 in the absence and presence of 10 μM PD81,723 for an additional minute. Subsequent to association, ABA-X-BY630 dissociation from A1ARs and A3ARs was assessed by the perfusion of HBSS in the absence or presence of 10 μM PD81,723 (CHO-A1) or 1 μM VUF5455 (CHO-A3). The configuration of the Zeiss 510 laser-scanning confocal microscope was kept constant between experiments. Experiments investigating the influence of the competitive ligand 8-cyclopentyl-1,3-dipropylxanthine (DPCPX) on ABA-X-BY630 dissociation from the A1AR involved 2-min exposure of CHO-A1 cells to 100 nM ABA-X-BY630 alone, followed by perfusion of HBSS containing 100 nM DPCPX. The configuration of the Zeiss 510 laser-scanning confocal microscope was kept constant between experiments.
Simultaneous Investigation of the Influence of PD81,723 and VUF5455 on the kinetics of ABA-X-BY630 Binding and Function.
CHO-A1 and CHO-A3 cells seeded onto 32-mm circular coverslips were incubated in 1.5 ml of DMEM/Ham's F12 medium containing 10% FCS, 2 mM l-glutamine, 2.5 mM probenecid, 2.3 μM Fluo-4AM, and 0.023% Pluronic acid for 45 to 90 min at 37°C in a humidified incubator containing 5% CO2. Cells were then loaded onto the perfusion system and washed with HBSS perfusion. During the experiment, cells were pretreated for 1 min with HBSS in the presence or absence of allosteric modulator PD81,723 (1 and 10 μM, or VUF5455 (0.1 and 1 μM), after which they were exposed to 30 nM ABA-X-BY630 in the presence of the pretreatment condition for an additional minute. ABA-X-BY630 dissociation was then initiated by perfusion of the pretreatment condition alone. A 488 nm argon laser was used for the excitation of Fluo-4 with emission being detected using a 505 to 550 nm band-pass filter. The configuration of the Zeiss 510 laser-scanning confocal microscope was kept constant between experiments. As above, ABA-X-BY630 binding was assessed by drawing a region of interest around the plasma membrane of 10 cells within each field of view. In contrast, given the oscillatory and nonsynchronous calcium response, the complete field of view was used to estimate the calcium mobilization mediated in the presence of ABA-X-BY630 (Zeiss AIM 4.2 Software).
Data Analysis.
All data were fitted using Prism 5 (GraphPad Software, San Diego, CA). Concentration-response curves for ABA-X-BY630 were fitted to the following equation:
where EMAX is the maximal response, and the EC50 is the molar concentration of ABA-X-BY630 required to generate 50% of EMAX. Association kinetic data were fit to the following monoexponential association function:
where Y0 represents the level of ABA-X-BY630 binding at time (t) equal to zero, Plateau is the level of binding at infinite time, and konobs is the rate of observed association. Binding of 3 and 10 nM ABA-X-BY630 showed a low level of nonspecific binding (less than 10%); therefore, association and dissociation kinetic data could be simultaneously fitted to eq. 2 and the following monoexponential decay function:
where Y0, t, and the Plateau are as previously defined, and koff is the rate of [ABA-X-BY630] dissociation. Binding of 30 and 100 nM ABA-X-BY630 had a greater contribution of nonspecific binding and was fitted individually to eq. 2 and the following two-phase exponential decay:
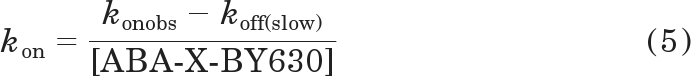
where Plateau and t are as previously defined and spanfast and spanslow represent the proportion of Y0 − Plateau accounted for by the faster [koff(fast)] and slower [koff(slow)] rate of dissociation, respectively. Within this analysis, kfast was constrained to equal 3.81 min−1, the average rate of dissociation of ABA-X-BY630 from nontransfected CHO-K1 cells. The association rate (kon) and negative logarithm of the equilibrium dissociation constant (pKD) were estimated according to the following equations.
 |
and
 |
where konobs, koff(slow), and kon are as previously defined. Experiments investigating the influence of PD81,723 and VUF5455 on ABA-X-BY630 association and dissociation were expressed as specific binding and globally analyzed using the following equations:
Association.
Dissociation.
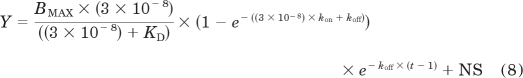 |
where BMAX represents the fluorescence intensity upon complete receptor occupation. BMAX was shared across all experiments using the same receptor subtype. NS represents nonspecific binding. KD, kon, koff, and t are as previously defined. Equilibrium dissociation constants and potency values were estimated as logarithms and all values are expressed as the mean ± S.E.M.
Statistical Analysis.
Statistical analysis involved one-way ANOVA or unpaired t tests, where appropriate, with statistical significance reflecting p < 0.05 (Prism 5; GraphPad Software, San Diego, CA). At p < 0.05, the one-way ANOVA was followed by either Tukey's multiple comparison test or Dunnett's multiple comparison test, as appropriate.
Results
The Nature of the Fluid Exchange within the Perfusion System.
This study has used a closed perfusion system, consisting of an imaging cell coupled to six reservoirs (Fig. 1a), in conjunction with a Zeiss LSM 510 laser-scanning confocal microscope to directly visualize and quantify fluorescent ligand association and dissociation kinetics at the single-cell level. The perfusion system was environmentally controlled, maintained at the physiological temperature of 37°C, and kept at constant pressure, promoting laminar flow and preventing loss of focus. Another important aspect of this system is the use of “infinite dilution” to assess agonist dissociation kinetics (Lee and el-Fakahany, 1991; Christopoulos et al., 1997). The method of infinite dilution requires dissociated fluorescent ligand to be rapidly removed such that the level of ligand re-association is negligible. To investigate the nature of the fluid transfer within the perfusion system, CHO-K1 cells were exposed to the dye Brilliant Black BN. The introduction of 50 μM Brilliant Black BN within the imaging cell at a flow rate of 5 ml/min caused a rapid decrease in the intensity of the phase image, which quickly recovered upon the removal of the dye (Fig. 1b). Fitting an exponential function to the onset and removal of Brilliant Black BN gave estimated half-times of 1.6 and 1.4 s, respectively, suggesting that it was possible to obtain rapid fluid transfer within the imaging cell.
Fig. 1.

The nature of fluid transfer upon reservoir exchange within the perfusion system. a, a schematic of the perfusion system setup. b, the addition of 50 μM Brilliant Black BN within the viewing cell caused a rapid decrease in the phase image intensity, which was readily reversed upon perfusion of HBSS only. c, the influence of different flow rates [3–5 (●), 6–10 (○), 11–15 (closed gray circle), and 16–20 ml/min (open gray circle)] on the association (0–2 min) and dissociation (2–5 min) kinetics of 100 nM ABA-X-BY630 at CHO-A3 cells. Data represent the mean ± the S.E.M. from three to five separate experiments in which each replicate reflects the fluorescence intensity from the plasma membrane of 10 cells.
To further confirm the lack of ligand reassociation during the dissociation phase, the binding kinetics of the fluorescent adenosine derivative, ABA-X-BY630, at CHO-A3 cells were investigated at differing flow rates. The association and dissociation rates of 100 nM ABA-X-BY630 at the A3AR were similar at flow rates of 3 to 5, 6 to 10, 11 to 15, or 16 to 20 ml/min, which reflect 7.5 to 12.5, 15 to 25, 27.5 to 37.5, or 40 to 50 complete fluid exchanges per minute within the imaging cell (Fig. 1c). As such, association seems to be initiated by the exposure of cells to the desired concentration of free ligand, which in turn can be rapidly removed upon the initiation of dissociation. Taken together, these results suggest that the fluid exchange within the perfusion system involves a sharp change in the concentration gradient of free ligand upon reservoir changeover; therefore, the method of infinite dilution can be used to assess fluorescent ligand dissociation. All subsequent experiments use a flow rate equal to or greater than 5 ml/min.
Investigating the Functional Activity of ABA-X-BY630 at the A1AR and A3AR.
The agonist activity of the adenosine derivative ABA-X-BY630 at the A1AR and/or A3AR was confirmed in both calcium mobilization and extracellular signal-regulated kinase 1 and 2 (ERK1/2) phosphorylation assays. Both A1ARs and A3ARs preferentially couple to Gi/o-type G-proteins (Fredholm et al., 2001). Upon stimulation, these receptors mediate inhibition of adenylyl cyclase through the α subunit of the G-protein. In addition, the βγ subunits of the G-protein can stimulate intracellular calcium mobilization and ERK1/2 phosphorylation through direct interactions with phospholipase C (Rhee, 2001). ABA-X-BY630 mediated a concentration-dependent increase in intracellular calcium mobilization and ERK1/2 phosphorylation at both the A1AR and A3AR (Figs. 2a and 3a). Compared with the response to a nonselective full agonist, 5′-(N-ethyl carboxamido)adenosine (NECA), ABA-X-BY630 mediated a partial stimulation of calcium mobilization (EMAX of 59 ± 3 and 52 ± 7%, respectively) but a level of ERK1/2 phosphorylation that was not significantly different from that of NECA at both the A1AR and A3AR. The potency (pEC50) of ABA-X-BY630 at mediating intracellular calcium mobilization and ERK1/2 phosphorylation was 6.1 ± 0.1 and 7.7 ± 0.2, respectively, at the A1AR and 5.9 ± 0.2 and 7.3 ± 0.2, respectively, at the A3AR.
Fig. 2.

Characterization of the binding and functional properties of ABA-X-BY630 at the human adenosine A1 receptor. a, ABA-X-BY630 mediated a robust, concentration-dependent increase in intracellular calcium mobilization (○) and ERK1/2 phosphorylation (●) in CHO-A1 cells. Data are expressed as a percentage of the response mediated by 1 μM NECA and represent the mean ± S.E.M. from four experiments. b, a confocal image showing discrete membrane binding of 30 nM ABA-X-BY630 at CHO-A1 cells. Association and dissociation kinetics of 10 (closed gray circle), 30 (○), and 100 (●) nM ABA-X-BY630 at CHO-A1 (c) and CHO-NT (d) cells. Normalized association (e) and dissociation (f) kinetics of 10 (closed gray circle), 30 (○), and 100 (●) nM ABA-X-BY630 at CHO-A1 cells. For the purposes of direct comparison, confocal configurations remained constant for both total and nonspecific binding. Confocal fluorescence and phase images were obtained at 2-s intervals for the duration of the experiment. Data represent the mean ± S.E.M. from three to six separate experiments in which each replicate reflects the fluorescence intensity from the plasma membrane of 10 cells.
Fig. 3.

Characterization of the binding and functional properties of ABA-X-BY630 at the human adenosine A3 receptor. a, ABA-X-BY630 mediated a robust, concentration-dependent increase in intracellular calcium mobilization (○) and ERK1/2 phosphorylation (●) in CHO-A3 cells. Data are expressed as a percentage of the response mediated by 1 μM NECA and represent the mean ± S.E.M. from four experiments. b, a confocal image showing discrete membrane binding of 30 nM ABA-X-BY630 at CHO-A3 cells. Association and dissociation kinetics of 3 (open gray circle), 10 (closed gray circle), 30 (○), and 100 (●) nM ABA-X-BY630 at CHO-A3 (c) and CHO-NT (d) cells. Normalized association (e) and dissociation (f) kinetics of 3 (open gray circle), 10 (closed gray circle), 30 (○), and 100 (●) nM ABA-X-BY630 at CHO-A3 cells. For the purpose of direct comparison, confocal configurations remained constant for both total and nonspecific binding. Confocal fluorescence and phase images were obtained at 2-s intervals for the duration of the experiment. Data represent the mean ± S.E.M. from four to eight separate experiments in which each replicate reflects the fluorescence intensity from the plasma membrane of 10 cells.
Characterization of Agonist Kinetics at the A1AR and A3AR.
Association and dissociation kinetics of ABA-X-BY630 were assessed at both the A1AR and A3AR. For the purpose of direct comparison, the configuration of the Zeiss 510 laser-scanning confocal microscope and agonist exposure time (4 min) were kept constant between the different concentrations of ABA-X-BY630. Confocal fluorescence and phase images were obtained at two second intervals for the duration of the experiment. Discrete binding of 3 nM ABA-X-BY630 to the cell membrane could only be detected for CHO-A3 cells, whereas 10, 30, and 100 nM ABA-X-BY630 was observed at both CHO-A1 and CHO-A3 cells. As would be expected, the fluorescence intensity of ABA-X-BY630 detected at the cell membrane increased with ligand concentration (Fig. 2c and 3c).
Repeating association and dissociation experiments using nontransfected CHO (CHO-NT) cells allowed quantification of the nonspecific binding of ABA-X-BY630. For the purpose of comparison, nonspecific association and dissociation kinetics were defined according to the confocal settings used for both CHO-A1 and CHO-A3 cells. It is noteworthy that the fluorescence intensity of nonspecific binding was considerably lower than that observed for the corresponding concentration of ABA-X-BY630 in CHO-A1 and CHO-A3 cells. Furthermore, for both sets of confocal configurations, membrane-localized nonspecific binding could be accurately quantified only at 30 and 100 nM ABA-X-BY630 (Fig. 2d and 3d). The observed association and dissociation of nonspecific binding was rapid, suggesting that ABA-X-BY630 has very low affinity for, and therefore was unlikely to become sequestered within, the plasma membrane. The observed association rate (konobs) and dissociation kinetics (koff) for corresponding ABA-X-BY630 concentrations using the CHO-A1 and CHO-A3 configurations did not cause a significant difference (unpaired t test) in the nonspecific binding kinetics and are represented as a combined value (Table 1). In addition, no significant difference (unpaired t test) was observed between the dissociation rate of 30 and 100 nM from CHO-NT cells.
TABLE 1.
Kinetic and equilibrium parameters for ABA-X-BY630 at nontransfected CHO-K1 (CHO-NT) cells or CHO cells stably transfected with the A1AR or the A3AR (CHO-A1 and CHO-A3 cells, respectively)
Data were expressed as the mean ± S.E.M. of the stated number of replicates (n), where each n represents the average of 10 cells within a single experiment.
| ABA-X-BY630 | konobs | koff(fast) | koff(slow) | kon | pKD | n |
|---|---|---|---|---|---|---|
| min−1 | min−1 | min−1 | × 107 M−1min−1 | M−1 | ||
| CHO-NT | ||||||
| 3 nM | N.A. | N.A. | ||||
| 10 nM | N.A. | N.A. | ||||
| 30 nM | 3.84 ± 0.18 | 3.68 ± 0.26 | 6 | |||
| 100 nM | 4.65 ± 0.38 | 3.95 ± 0.18 | 6 | |||
| CHO-A1 | ||||||
| 3 nM | N.A. | N.A. | ||||
| 10 nM | 1.18 ± 0.12 | N.A. | 1.09 ± 0.12 | 0.93 ± 0.17 | 6.92 ± 0.09 | 3 |
| 30 nM | 1.84 ± 0.23 | 3.81 | 0.90 ± 0.15 | 3.12 ± 0.88 | 7.51 ± 0.18 | 6 |
| 100 nM | 2.60 ± 0.23**a | 3.81 | 0.71 ± 0.11 | 1.89 ± 0.18 | 7.42 ± 0.06 | 6 |
| CHO-A3 | ||||||
| 3 nM | 0.70 ± 0.11 | N.A. | 0.43 ± 0.06 | 8.92 ± 2.99 | 8.14 ± 0.17 | 8 |
| 10 nM | 0.89 ± 0.16 | N.A. | 0.51 ± 0.09 | 3.79 ± 1.02 | 7.83 ± 0.10 | 8 |
| 30 nM | 1.82 ± 0.55 | 3.81 | 0.40 ± 0.05 | 4.74 ± 1.69 | 7.94 ± 0.11 | 7 |
| 100 nM | 2.53 ± 0.26**a,b | 3.81 | 0.43 ± 0.11 | 2.10 ± 0.26 | 7.73 ± 0.14 | 6 |
N.A., not applicable.
Statistically different (P < 0.01) from the corresponding a10 nM ABA-X-BY630 value or b3 nM ABA-X-BY630 value, as determined by one-way ANOVA followed by a Tukey's multiple comparisons test.
Normalizing the binding of 3 (CHO-A3 only), 10, 30, and 100 nM ABA-X-BY630 at CHO-A1 (Fig. 2, e and f) and CHO-A3 (Fig. 3, e and f) cells clearly demonstrates the concentration-dependent nature of the observed association rate and the concentration-independent nature of the dissociation kinetics. At both A1ARs and A3ARs, the observed association for each concentration of ABA-X-BY630 preferentially fit to a mono-exponential curve. The dissociation of 3 and 10 nM ABA-X-BY630 preferentially fit to a single phase exponential decay. In contrast, two components could be detected for the dissociation of 30 and 100 nM ABA-X-BY630. In each case, the proportion and rate of the rapidly dissociating component was similar to that expected for, and was therefore assumed to represent, nonspecific binding. Therefore, the fast component of the biphasic decay was constrained to equal the average dissociation rate estimated for nonspecific binding [koff(fast) = 3.81 min−1]. At both A1ARs and A3ARs, one-way ANOVA analysis suggested that there was a significant difference between the konobs, but not the koff estimates for the different concentrations of ABA-X-BY630 (Table 1). The observed association rate (konobs) and the slow component of the biphasic decay [koff(slow)] were used to estimate the association rate (kon) of ABA-X-BY630 at the A1AR and A3AR (eq. 5). Subsequently, the association (kon) and dissociation (koff) rates were used to estimate the affinity of ABA-X-BY630 at both receptors (eq. 6). Analysis of these data according to one-way ANOVA suggested that there was no significant difference between the association rate constants (kon) or equilibrium dissociation constants (pKD) calculated for the different concentrations of ABA-X-BY630 (Table 1).
Single-Cell Analysis of Agonist Binding Parameters.
Single-cell analysis of agonist binding kinetics was performed for 3, 10, 30, and 100 nM ABA-X-BY630 at A3ARs (Fig. 4). As for the grouped analysis, ABA-X-BY630 kinetics were analyzed according to a monoexponential association followed by a monophasic decay for 3 and 10 nM and a biphasic decay with koff(fast) constrained to equal 3.81 min−1 for 30 and 100 nM. Similar to the grouped analysis, results of the single cell analysis suggested that the dominant influence of fluorescent ligand concentration was on the konobs with a coefficient of determination (r2) for a linear trend of 0.488. Compared with konobs, there was less correlation between ligand concentration and the estimated koff(slow), kon and pKD from the single-cell analysis, which had r2 values of 0.13, 0.12, and 0.01, respectively.
Fig. 4.

Single-cell analysis of the kinetic and equilibrium binding parameters of ABA-X-BY630 at the human adenosine A3 receptor. The dominant influence of ABA-X-BY630 concentration was on the observed association rate (a) as opposed to the dissociation rate constant (b), association rate constant (c), or equilibrium dissociation constant (d). The mean ± S.E.M. is shown for 60 to 80 replicates, which are plotted as individual data points and represent the parameter estimates from single cells from six to eight experiments.
Investigating the Influence of Allosteric Modulators on Agonist Dissociation Kinetics in Whole Cells.
Ligands competing for the same site on a monomeric receptor should not influence the dissociation kinetics of one another (Fig. 5a). This is clearly shown in Fig. 5b, where the addition of the competitive ligand DPCPX (100 nM) during the dissociation phase does not influence the dissociation of ABA-X-BY630 (100 nM). In contrast, if ligands bind simultaneously to two interacting sites, such as in the case of allosterism, cooperative interactions can alter ligand dissociation kinetics (Christopoulos and Kenakin, 2002; May et al., 2007b). To date, the majority of studies investigating the influence of allosteric modulators on GPCRs use a saturating concentration of unlabeled orthosteric ligand in the absence or presence of allosteric modulator to bind any unoccupied orthosteric binding sites and thereby inhibit the reassociation of dissociated labeled orthosteric ligand (Lee and el-Fakahany, 1991; Christopoulos et al., 1997). In contrast, this system has used the method of infinite dilution to assess the dissociation rate of the fluorescent agonist in the absence and presence of allosteric modulator. This method eliminates a number of the issues that can arise when using additional orthosteric ligands and also allows agonist kinetics to be assessed within whole cells. The dissociation of 30 nM ABA-X-BY630 from CHO-A1 cells was significantly slower in the presence (koff = 0.51 ± 0.03 min−1; n = 6) compared with the absence (koff = 1.10 ± 0.06 min−1; n = 14) of 10 μM PD81,723 (Fig. 5c). Supporting the population data, single-cell analysis shows a clear decrease in the dissociation rate of 30 nM ABA-X-BY630 at the A1AR in presence of 10 μM PD81,723 (Fig. 5d). In contrast, the dissociation of 30 nM ABA-X-BY630 from CHO-A3 cells was significantly enhanced in the presence (koff = 3.15 ± 0.12 min−1; n = 4) compared with the absence (koff = 0.68 ± 0.18 min−1; n = 4) of 1 μM VUF5455 (Fig. 5e). This enhanced dissociation rate of 30 nM ABA-X-BY630 from the A3AR in the presence of 1 μM VUF5455 can also be observed at the single cell level (Fig. 5f).
Fig. 5.

Allosteric modulation of agonist dissociation in live cells. a, a schematic illustrating the topographically distinct nature of allosteric and orthosteric receptor sites. b, the dissociation of 100 nM ABA-X-BY630 in the absence (●; n = 15) and presence of 100 nM DPCPX (closed gray circle; n = 2; data represent the mean only) from CHO-A1 cells. c, the dissociation of 30 nM ABA-X-BY630 in the absence (●; n = 14) and presence of 10 μM PD81,723 (closed gray circle; n = 6) from CHO-A1 cells. d, single-cell analysis of the influence of 10 μM PD81,723 on the dissociation rate of 30 nM ABA-X-BY630 from CHO-A1 cells. The mean ± S.E.M. is shown for 120 replicates in the absence of 10 μM PD81,723 and 60 replicates in the presence of 10 μM PD81,723 that are plotted as individual data points and represent the rate of ABA-X-BY630 dissociation from single cells. e, the dissociation of 30 nM ABA-X-BY630 in the absence (●; n = 4) and presence of 1 μM VUF5455 (closed gray circle; n = 4) from CHO-A3 cells. Unless otherwise stated, data represent the mean ± S.E.M. and each replicate reflects the fluorescence intensity from the plasma membrane of 10 cells. f, single-cell analysis of the influence of 1 μM VUF5455 on the dissociation rate of 30 nM ABA-X-BY630 from CHO-A3 cells. The mean ± S.E.M. is shown for 30 replicates in the absence of 1 μM VUF5455 and 40 replicates in the presence of 1 μM VUF5455 that are plotted as individual data points and represent the rate of ABA-X-BY630 dissociation from single cells.
Investigating the Influence of Allosteric Modulators on the Kinetics of ABA-X-BY630 Binding and Function.
The influence of PD81,723 (1 and 10 μM) and VUF5455 (0.1 μM and 1 μM) on the kinetics of ABA-X-BY630 (30 nM) association and dissociation was investigated simultaneously with their effect on receptor-mediated calcium mobilization. At the A1AR, the presence of 1 μM PD81,723 had no significant effect on the binding of 30 nM ABA-X-BY630, whereas 10 μM PD81,723 caused an approximate 2-fold increase in the level of 30 nM ABA-X-BY630 specific binding (Fig. 6a). Global analysis of association and dissociation curves suggested that the increase in 30 nM ABA-X-BY630 binding in the presence of 10 μM PD81,723 was due a significant increase in the association (kon) and decrease in the dissociation (koff) rate constants for ABA-X-BY630 at the A1AR, respectively. This in turn resulted in a significant increase in the apparent affinity of ABA-X-BY630 for the A1AR in the presence of 10 μM PD81,723 (Table 2). The significant decrease in the rate of 30 nM ABA-X-BY630 dissociation (koff) in the presence of 10 μM PD81,723 can be clearly observed when the data were normalized (Fig. 6d). In contrast, there is no significant difference between the observed rate of association (konobs) for ABA-X-BY630 at the A1AR in the absence and presence of 1 μM or 10 μM PD81,723 (Fig. 6c). This could result from the opposing effects an increased association rate (kon) and a decreased dissociation rate (koff) has on the observed rate of association (konobs). At the A1AR, 1 μM VUF5455 mediated a significant decrease in the dissociation rate (koff) of 30 nM ABA-X-BY630, suggesting that VUF5455 has an allosteric mechanism of action at the A1AR (Fig. 6h; Table 2). However, despite decreasing the dissociation rate, a concurrent decrease in the association rate constant (kon) in the presence of 1 μM VUF5455 caused a decrease in the level of 30 nM ABA-X-BY630 specific binding at the A1AR (Table 2; Fig. 6e). There was no significant difference between the observed association rate (konobs) of 30 nM ABA-X-BY630 at the A1AR in the absence or presence of 0.1 or 1 μM VUF5455 (Fig. 6g).
Fig. 6.

The influence of PD81,723 and VUF5455 on the binding and function of 30 nM ABA-X-BY630 at the human adenosine A1 receptor. a, the association and dissociation kinetics of 30 nM ABA-X-BY630 in the absence (●; n = 12) and presence of 1 (○; n = 10) and 10 μM (closed gray circle; n = 6) PD81,723 at CHO-A1 cells. b, the intracellular calcium mobilization mediated by 30 nM ABA-X-BY630 in the absence (●; n = 12) and presence of 1 (○; n = 10) and 10 μM (closed gray circle; n = 6) PD81,723 at CHO-A1 cells. c, normalized association kinetics of 30 nM ABA-X-BY630 in the absence (●; n = 12) and presence of 1 (○; n = 10) and 10 μM (closed gray circle; n = 6) PD81,723 at CHO-A1 cells. d, normalized dissociation kinetics of 30 nM ABA-X-BY630 in the absence (●; n = 12) and presence of 1 (○; n = 10) and 10 μM (closed gray circle; n = 6) PD81,723 at CHO-A1 cells. e, the association and dissociation kinetics of 30 nM ABA-X-BY630 in the absence (●; n = 12) and presence of 0.1 (○; n = 3) and 1 μM (closed gray circle; n = 5) VUF5455 at CHO-A1 cells. f, the intracellular calcium mobilization mediated by 30 nM ABA-X-BY630 in the absence (●; n = 12) and presence of 0.1 (○; n = 3) and 1 μM (closed gray circle; n = 5) VUF5455 at CHO-A1 cells. g, normalized association kinetics of 30 nM ABA-X-BY630 in the absence (●; n = 12) and presence of 0.1 (○; n = 3) and 1 μM (closed gray circle; n = 5) VUF5455 at CHO-A1 cells. h, normalized dissociation kinetics of 30 nM ABA-X-BY630 in the absence (●; n = 12) and presence of 0.1 (○; n = 3) and 1 μM (closed gray circle; n = 5) VUF5455 at CHO-A1 cells.
TABLE 2.
Global analysis of ABA-X-BY630 (30 nM) kinetic and equilibrium binding parameters in the absence and presence of PD81,723 and VUF5455 at the A1AR and A3AR
Data are expressed as the mean ± S.E.M. of the stated number of replicates (n) where each n represents the average of 10 cells within a single experiment.
| ABA-X-BY630 (30 nM) | kon | koff | pKD(APPARENT) | BMAX (Fluorescence Intensity) | n |
|---|---|---|---|---|---|
| × 107 M−1min−1 | min−1 | M−1 | |||
| CHO-A1 | |||||
| Control | 2.62 ± 0.34 | 1.95 ± 0.09 | 7.13 ± 0.06 | 150 ± 16 | 12 |
| + 1 μM PD81,723 | 2.88 ± 0.39 | 1.72 ± 0.07 | 7.23 ± 0.06 | 10 | |
| + 10 μM PD81,723 | 4.17 ± 0.65* | 0.80 ± 0.03* | 7.72 ± 0.07* | 6 | |
| + 0.1 μM VUF5455 | 2.82 ± 0.40 | 1.60 ± 0.10 | 7.25 ± 0.06 | 3 | |
| + 1 μM VUF5455 | 1.04 ± 0.16 | 1.48 ± 0.16* | 6.85 ± 0.07* | 5 | |
| CHO-A3 | |||||
| Control | 8.60 ± 0.62 | 0.78 ± 0.02 | 8.05 ± 0.04 | 133 ± 4 | 14 |
| + 1 μM PD81,723 | 6.78 ± 0.45* | 1.13 ± 0.04* | 7.78 ± 0.03* | 9 | |
| + 10 μM PD81,723 | 4.79 ± 0.38* | 2.46 ± 0.18* | 7.23 ± 0.03* | 6 | |
| + 0.1 μM VUF5455 | 4.23 ± 0.35* | 2.73 ± 0.22* | 7.12 ± 0.03* | 7 |
Statistically different (P < 0.05) compared with control value, as determined by one-way ANOVA followed by a Dunnett's multiple comparisons test.
At the A3AR, PD81,723 mediated a concentration-dependent decrease in the binding of 30 nM ABA-X-BY630, an increase in the dissociation rate (koff) and a decrease in the association rate (kon) of 30 nM ABA-X-BY630 (Fig. 7a; Table 2). The combined changes in ABA-X-BY630 kinetics resulted in a concentration-dependent decrease in the apparent affinity of ABA-X-BY630 for the A3AR in the presence of PD81,723 (Table 2). Normalized data clearly illustrate the significant increase in the dissociation rate (koff) of 30 nM ABA-X-BY630 at the A3AR in the presence of 1 and 10 μM PD81,723 (Fig. 7d). There was no significant difference between the observed association rate (konobs) of 30 nM ABA-X-BY630 in the absence and presence of 1 or 10 μM PD81,723 (Fig. 7c). As above, this could be due to the opposing influence of PD81,723 on the rate constants for association and dissociation manifesting as opposing effects on the observed rate of association of 30 nM ABA-X-BY630 at the A3AR (Fig. 7g). At the A3AR, the presence VUF5455 mediated a concentration-dependent decrease in binding of 30 nM ABA-X-BY630 such that in the presence of 1 μM VUF5455, the level of 30 nM ABA-X-BY630 binding was indistinguishable from nonspecific binding (Fig. 7e). The decrease in 30 nM ABA-X-BY630 binding at the A3AR in the presence of 0.1 μM VUF5455 was due to a decrease in the rate of association (kon) and an increase in the rate of dissociation (koff) (Table 2). Rate constants in the presence of 1 μM VUF5455 could not be determined because of the negligible level of 30 nM ABA-X-BY630 specific binding under these conditions. Normalized data clearly illustrate the increased dissociation rate (koff) of ABA-X-BY630 at the A3AR in the presence of 0.1 μM VUF5455 (Fig. 7h); in contrast, there was no significant difference between the observed association rate (konobs) of 30 nM ABA-X-BY630 in the absence and presence of 0.1 μM VUF5455 at the A3AR (Fig. 7g).
Fig. 7.

The influence of PD81,723 and VUF5455 on the binding and function of 30 nM ABA-X-BY630 at the human adenosine A3 receptor. a, the association and dissociation kinetics of 30 nM ABA-X-BY630 in the absence (●; n = 14) and presence of 1 (○; n = 9) and 10 μM (closed gray circle; n = 6) PD81,723 at CHO-A3 cells. b, the intracellular calcium mobilization mediated by 30 nM ABA-X-BY630 in the absence (●; n = 14) and presence of 1 (○; n = 9) and 10 μM (closed gray circle; n = 6) PD81,723 at CHO-A3 cells. c, normalized association kinetics of 30 nM ABA-X-BY630 in the absence (●; n = 14) and presence of 1 (○; n = 9) and 10 μM (closed gray circle; n = 6) PD81,723 at CHO-A3 cells. d, normalized dissociation kinetics of 30 nM ABA-X-BY630 in the absence (●; n = 14) and presence of 1 (○; n = 9) and 10 μM (closed gray circle; n = 6) PD81,723 at CHO-A3 cells. e, the association and dissociation kinetics of 30 nM ABA-X-BY630 in the absence (●; n = 14) and presence of 0.1 (○; n = 7) and 1 μM (closed gray circle; n = 6) VUF5455 at CHO-A3 cells. f, the intracellular calcium mobilization mediated by 30 nM ABA-X-BY630 in the absence (●; n = 14) and presence of 0.1 (○; n = 7) and 1 μM (closed gray circle; n = 6) VUF5455 at CHO-A3 cells. g, normalized association kinetics of 30 nM ABA-X-BY630 in the absence (●; n = 14) and presence of 0.1 (○; n = 7) and 1 μM (closed gray circle; n = 6) VUF5455 at CHO-A3 cells. h, normalized dissociation kinetics of 30 nM ABA-X-BY630 in the absence (●; n = 14) and presence of 0.1 (○; n = 7) and 1 μM (closed gray circle; n = 6) VUF5455 at CHO-A3 cells.
Calcium mobilization mediated through both the A1AR and the A3AR in the presence of 30 nM ABA-X-BY630 was investigated simultaneously with binding. In CHO-A1 and CHO-A3 cells, 30 nM ABA-X-BY630 mediated a nonsynchronous, oscillatory calcium response. On average in CHO-A1 cells, in the presence of 30 nM ABA-X-BY630 calcium mobilization was initiated at approximately 10% receptor occupancy, whereas the peak response occurred at 25% receptor occupancy (Fig. 6b). On average in CHO-A3 cells, calcium mobilization was initiated at approximately 15% receptor occupancy whereas the peak response to 30 nM ABA-X-BY630 occurred at 65% receptor occupancy (Fig. 7b). The presence of 1 or 10 μM PD81,723 had no significant effect on the calcium response mediated by 30 nM ABA-X-BY630 at the A1AR (Fig. 6b). In contrast, at the A3AR, although 1 μM PD81,723 had no significant effect, the presence of 10 μM PD81,723 reduced by more than 90% the peak calcium response mediated by 30 nM ABA-X-BY630 (Fig. 7b). At the A3AR, calcium mobilization in response to 30 nM ABA-X-BY630 was decreased by approximately 90% in the presence of 0.1 μM VUF5455 and could not be detected in the presence of 1 μM VUF5455 (Fig. 7f). In contrast, at the A1AR, peak calcium mobilization in response to 30 nM ABA-X-BY630 was not significantly influenced by 0.1 or 1 μM VUF5455 (Fig. 6f).
Discussion
Association and dissociation kinetics of ligand binding represents a sensitive method to detect changes in receptor conformation. This study has provided the first direct assessment of the kinetics of a GPCR small-molecule agonist in the absence and presence of allosteric modulators in single living cells. As would be predicted from simple mass action, at both A1ARs and A3ARs, the observed association rate (konobs) of ABA-X-BY630 binding was concentration-dependent. In contrast, the rate constants for association (kon) and dissociation [koff(slow)], as well as the equilibrium dissociation constant (pKD), were concentration-independent. Analysis of intact cell association and dissociation kinetics of ABA-X-BY630 suggest that both PD81,723 and VUF5455 have an allosteric mechanism of action at the A1AR and the A3AR. At the A1AR, PD81,723 and VUF5455 significantly decrease the dissociation rate of ABA-X-BY630. In contrast, at the A3AR, VUF5455 and PD81,723 significantly enhance the dissociation rate of ABA-X-BY630.
Numerous advantages have been gained through assessing agonist kinetics using a pressurized, closed perfusion system in conjunction with confocal microscopy. For example, the maintenance of a constant pressure combined with the closed nature of the viewing cell promotes laminar flow with a constant flow rate and prevents loss of focus. These features also generate a sharp concentration gradient between fluid exchanges, allowing fluorescent ligand dissociation to be quantified in the absence of saturating concentrations of additional ligands. Imaging ligand kinetics using confocal microscopy can generate virtually continuous association and dissociation profiles on a single population of cells; removing previous requirements to quantify ligand kinetics using endpoint assays and allowing the dynamics of ligand kinetics to be quantified at physiologically relevant temperatures. Imaging also allows discrimination between plasma membrane and intracellular ligand binding. An additional advantage of this method is that it is readily amenable to the study of endogenously expressed receptors in intact primary cells.
The average pKD of ABA-X-BY630, at the A1AR and A3AR, was 7.3 and 7.9, respectively. The pKD of adenosine for the high- and low-affinity states at the A1AR has previously been estimated as 7.9 and 5.1, respectively (Cohen et al., 1996a). The low concentrations of ABA-X-BY630 used within this study seem to predominantly detect high-affinity receptor states. This finding is consistent with those from a previous study using an alternative single-cell technique, fluorescence correlation spectroscopy, that assessed the ability of NECA to inhibit the binding of a low concentration (2.5 nM) of the fluorescent agonist ABEA-X-BY630 (Cordeaux et al., 2008). The affinity (pKD) of NECA for the human A3AR in intact CHO-A3 cells was approximately 8.5. For nonpeptide GPCRs, low nanomolar equilibrium dissociation constant estimates are likely to represent agonist binding to active receptor conformations. According to the cubic ternary complex model, the active receptor conformation can be either G protein-coupled or -uncoupled (Kenakin, 2002). In living cells, the presence of GTP causes rapid dissociation of the active ligand/receptor/G protein ternary complex. We speculate that these studies predominantly detect active G protein-uncoupled receptor conformations. This conjecture is supported by the difference between agonist kinetics estimated from live cells in the current study and those from previous studies in membrane homogenates. At both the A1AR and A3AR, agonist kinetics in intact cells were at least 10 times faster than previous estimates of agonist kinetics from membrane homogenates (Cohen et al., 1996b; Gao et al., 2001).
In addition to orthosteric agonists and antagonists, GPCRs can also interact with intracellular proteins, transmembrane receptors and allosteric small molecules. Cooperative interactions between two interacting binding sites are generally manifested as a change in ligand binding kinetics (May et al., 2007b). However, because of the methodological limitations mentioned, allosteric modulation of agonist binding kinetics at nonpeptide GPCRs have not been investigated in whole cells. Allosteric binding sites on A1ARs and A3ARs represent an attractive therapeutic target for amplifying the tissue protective actions of endogenous adenosine in conditions such as ischemia, chronic neuropathic pain and inflammation (Jacobson and Gao, 2006; Cohen and Downey, 2008). A number of compounds, such as PD81,723 and VUF5455, have been identified that can retard the dissociation of radiolabeled agonists in the presence of a high concentration of unlabeled orthosteric antagonist from cell membrane homogenates expressing the A1AR and A3AR (Bruns and Fergus, 1990; Gao et al., 2001). The prerequisite for the presence of a saturating concentration of unlabeled orthosteric antagonist in these membrane radioligand binding assays (to prevent rebinding of the radioligand) means that any observed effect of the allosteric ligand can be influenced by the presence of the nonradioactive orthosteric ligand, and assumptions have to be made about the orthosteric nature of the competing ligand. In contrast, the method described within this manuscript assesses the dissociation of the labeled ligand under conditions of infinite dilution and therefore does not require such underlying assumptions. Both PD81,723 and VUF5455 were able to modulate ABA-X-BY630 dissociation kinetics in single living cells. Similar to previous findings, PD81,723 (10 μM) significantly retarded the dissociation of fluorescent agonist from the A1AR. In contrast to decreasing the rate of agonist dissociation, this study has found that VUF5455 significantly enhanced the dissociation of ABA-X-BY630 from the A3AR. A number of possibilities could account for the observed discrepancy. For example, allosteric modulators can be highly probe-dependent; therefore, the difference may result from the inconsistency in the agonist probe used (May et al., 2007b). Alternatively, the difference could reflect a more complex receptor arrangement than a noninteracting monomer or a multisite action of the nonradioactive “orthosteric” ligand employed in the radioligand membrane binding assay (that is, both an orthosteric and an allosteric mechanism of action).
To further investigate the mechanism of allosteric modulation, the influence of PD81,723 and VUF5455 on the association rate constant (kon), affinity, and function of ABA-X-BY630 was investigated at both the A1AR and the A3AR. An advantage of the perfusion system in conjunction with a confocal microscope is that fluorescent ligand binding can be performed simultaneously to function when using a fluorescence readout such the calcium-sensitive fluorescent indicator Fluo-4. At the A1AR, PD81,723 mediated a decrease in the dissociation rate constant and an increase in the association rate constant of ABA-X-BY630. The combined effect of these two changes this caused an approximate 4-fold increase in the apparent affinity of 30 nM ABA-X-BY630 in the presence of 10 μM PD81,723. However, despite causing an approximately 2-fold increase in the specific binding of 30 nM ABA-X-BY630, 10 μM PD81,723 had no significant effect on calcium mobilization mediated by 30 nM ABA-X-BY630 at the A1AR. This may be because the nonsynchronous and oscillatory calcium response causes small changes in the functional response to remain undetected; alternatively, although PD81,723 enhances ABA-X-BY630 affinity at the A1AR, it may inhibit efficacy. PD81,723 was also found to have a previously unreported allosteric mechanism of action at the A3AR. At the A3AR, PD81,723 decreased the affinity of ABA-X-BY630 though a decrease in the association and an increase in the dissociation rate constant. As would be expected, the approximately 2-fold decrease in ABA-X-BY630 binding in the presence of 10 μM PD81,723 resulted in a significant decrease in the calcium mobilization mediated by 30 nM ABA-X-BY630 through the A3AR. At the A3AR, VUF5455 also acted as an allosteric inhibitor of ABA-X-BY630, increasing and decreasing the dissociation and association rate constants for ABA-X-BY630, respectively. The decrease in 30 nM ABA-X-BY630 binding at the A3AR in the presence of 0.1 μM and 1 μM VUF5455 was coupled with a significant decrease in the calcium response mediated by 30 nM ABA-X-BY630 at the A3AR. The current kinetic studies also suggest that VUF5455 may have an allosteric mechanism of action at the A1AR. Although VUF5455 had no significant effect on the calcium mobilization mediated by 30 nM ABA-X-BY630 through the A1AR, 1 μM VUF5455 significantly decreased 30 nM ABA-X-BY630 dissociation and caused an approximately 2-fold decrease in binding.
This study has directly quantified the binding kinetics of the fluorescent adenosine derivative, ABA-X-BY630, in the absence and presence of allosteric modulators in live single cells. The allosteric modulators PD81,723 and VUF5455 slowed agonist dissociation at the A1AR, whereas at the A3AR, both PD81,712 and VUF5455 significantly enhanced ABA-X-BY630 dissociation. The potential therapeutic application for this class of allosteric modulators involves enhancing the binding of endogenous adenosine under conditions of metabolic stress. Therefore, the ability to observe the influence of allosteric modulators on the kinetics binding and function of a fluorescent derivative of the endogenous agonist in live cells in the absence of additional competitive ligands represents a significant advantage of this system over traditional methods and as such should significantly advance the understanding of orthosteric and allosteric ligand pharmacology at GPCRs.
Acknowledgments
We thank Barrie Kellam (Centre for Biomolecular Sciences, School of Pharmacy, The University of Nottingham, UK) for VUF5455.
This work was supported by the UK Medical Research Council [Grant G0800006]; The University of Nottingham; and a National Health and Medical Research Council of Australia Postdoctoral Fellowship (to L.T.M.).
Article, publication date, and citation information can be found at http://molpharm.aspetjournals.org.
doi:10.1124/mol.110.064493.
- GPCR
- G protein-coupled receptor
- A1AR
- adenosine A1 receptor
- A3AR
- adenosine A3 receptor
- DMEM
- Dulbecco's modified Eagle's medium
- FCS
- fetal calf serum
- ERK
- extracellular signal-regulated kinase
- AM
- acetoxymethyl ester
- ANOVA
- analysis of variance
- CHO
- Chinese hamster ovary
- NECA
- 5′-(N-ethyl carboxamido)adenosine
- CHO-NT
- nontransfected Chinese hamster ovary cells
- DPCPX
- 8-cyclopentyl-1,3-dipropylxanthine
- HBSS
- HEPES-buffered saline solution.
References
- Avlani V, May LT, Sexton PM, Christopoulos A. (2004) Application of a kinetic model to the apparently complex behavior of negative and positive allosteric modulators of muscarinic acetylcholine receptors. J Pharmacol Exp Ther 308:1062–1072 [DOI] [PubMed] [Google Scholar]
- Birdsall NJ, Lazareno S, Matsui H. (1996) Allosteric regulation of muscarinic receptors. Prog Brain Res 109:147–151 [DOI] [PubMed] [Google Scholar]
- Bruns RF, Fergus JH. (1990) Allosteric enhancement of adenosine A1 receptor binding and function by 2-amino-3-benzoylthiophenes. Mol Pharmacol 38:939–949 [PubMed] [Google Scholar]
- Christopoulos A, Kenakin T. (2002) G protein-coupled receptor allosterism and complexing. Pharmacol Rev 54:323–374 [DOI] [PubMed] [Google Scholar]
- Christopoulos A, Lanzafame A, Ziegler A, Mitchelson F. (1997) Kinetic studies of co-operativity at atrial muscarinic M2 receptors with an “infinite dilution” procedure. Biochem Pharmacol 53:795–800 [DOI] [PubMed] [Google Scholar]
- Cohen FR, Lazareno S, Birdsall NJ. (1996a) The affinity of adenosine for the high- and low-affinity states of the human adenosine A1 receptor. Eur J Pharmacol 309:111–114 [DOI] [PubMed] [Google Scholar]
- Cohen FR, Lazareno S, Birdsall NJ. (1996b) The effects of saponin on the binding and functional properties of the human adenosine A1 receptor. Br J Pharmacol 117:1521–1529 [DOI] [PMC free article] [PubMed] [Google Scholar]
- Cohen MV, Downey JM. (2008) Adenosine: trigger and mediator of cardioprotection. Basic Res Cardiol 103:203–215 [DOI] [PubMed] [Google Scholar]
- Cordeaux Y, Briddon SJ, Alexander SP, Kellam B, Hill SJ. (2008) Agonist-occupied A3 adenosine receptors exist within heterogeneous complexes in membrane microdomains of individual living cells. FASEB J 22:850–860 [DOI] [PubMed] [Google Scholar]
- Cordeaux Y, Briddon SJ, Megson AE, McDonnell J, Dickenson JM, Hill SJ. (2000) Influence of receptor number on functional responses elicited by agonists acting at the human adenosine A(1) receptor: evidence for signaling pathway-dependent changes in agonist potency and relative intrinsic activity. Mol Pharmacol 58:1075–1084 [DOI] [PubMed] [Google Scholar]
- Dowling MR, Charlton SJ. (2006) Quantifying the association and dissociation rates of unlabelled antagonists at the muscarinic M3 receptor. Br J Pharmacol 148:927–937 [DOI] [PMC free article] [PubMed] [Google Scholar]
- Ellis J, Huyler J, Brann MR. (1991) Allosteric regulation of cloned m1–m5 muscarinic receptor subtypes. Biochem Pharmacol 42:1927–1932 [DOI] [PubMed] [Google Scholar]
- Fredholm BB, IJzerman AP, Jacobson KA, Klotz KN, Linden J. (2001) International Union of Pharmacology. XXV. Nomenclature and classification of adenosine receptors. Pharmacol Rev 53:527–552 [PMC free article] [PubMed] [Google Scholar]
- Gao ZG, Van Muijlwijk-Koezen JE, Chen A, Müller CE, IJzerman AP, Jacobson KA. (2001) Allosteric modulation of A(3) adenosine receptors by a series of 3-(2-pyridinyl)isoquinoline derivatives. Mol Pharmacol 60:1057–1063 [PMC free article] [PubMed] [Google Scholar]
- Han Y, Moreira IS, Urizar E, Weinstein H, Javitch JA. (2009) Allosteric communication between protomers of dopamine class A GPCR dimers modulates activation. Nat Chem Biol 5:688–695 [DOI] [PMC free article] [PubMed] [Google Scholar]
- Ilien B, Glasser N, Clamme JP, Didier P, Piemont E, Chinnappan R, Daval SB, Galzi JL, Mely Y. (2009) Pirenzepine promotes the dimerization of muscarinic M1 receptors through a three-step binding process. J Biol Chem 284:19533–19543 [DOI] [PMC free article] [PubMed] [Google Scholar]
- Jacobson KA, Gao ZG. (2006) Adenosine receptors as therapeutic targets. Nat Rev Drug Discov 5:247–264 [DOI] [PMC free article] [PubMed] [Google Scholar]
- Kenakin T. (2002) Drug efficacy at G protein-coupled receptors. Annu Rev Pharmacol Toxicol 42:349–379 [DOI] [PubMed] [Google Scholar]
- Lazareno S, Birdsall NJ. (1995) Detection, quantitation, and verification of allosteric interactions of agents with labeled and unlabeled ligands at G protein-coupled receptors: interactions of strychnine and acetylcholine at muscarinic receptors. Mol Pharmacol 48:362–378 [PubMed] [Google Scholar]
- Lee NH, el-Fakahany EE. (1991) Allosteric antagonists of the muscarinic acetylcholine receptor. Biochem Pharmacol 42:199–205 [DOI] [PubMed] [Google Scholar]
- May LT, Avlani VA, Langmead CJ, Herdon HJ, Wood MD, Sexton PM, Christopoulos A. (2007a) Structure-function studies of allosteric agonism at M2 muscarinic acetylcholine receptors. Mol Pharmacol 72:463–476 [DOI] [PubMed] [Google Scholar]
- May LT, Leach K, Sexton PM, Christopoulos A. (2007b) Allosteric modulation of G protein-coupled receptors. Annu Rev Pharmacol Toxicol 47:1–51 [DOI] [PubMed] [Google Scholar]
- Middleton RJ, Briddon SJ, Cordeaux Y, Yates AS, Dale CL, George MW, Baker JG, Hill SJ, Kellam B. (2007) New fluorescent adenosine A1-receptor agonists that allow quantification of ligand-receptor interactions in microdomains of single living cells. J Med Chem 50:782–793 [DOI] [PubMed] [Google Scholar]
- Overington JP, Al-Lazikani B, Hopkins AL. (2006) How many drug targets are there? Nat Rev Drug Discov 5:993–996 [DOI] [PubMed] [Google Scholar]
- Rhee SG. (2001) Regulation of phosphoinositide-specific phospholipase C. Annu Rev Biochem 70:281–312 [DOI] [PMC free article] [PubMed] [Google Scholar]
- Springael JY, Le Minh PN, Urizar E, Costagliola S, Vassart G, Parmentier M. (2006) Allosteric modulation of binding properties between units of chemokine receptor homo- and hetero-oligomers. Mol Pharmacol 69:1652–1661 [DOI] [PubMed] [Google Scholar]
- Swaminath G, Xiang Y, Lee TW, Steenhuis J, Parnot C, Kobilka BK. (2004) Sequential binding of agonists to the beta2 adrenoceptor. Kinetic evidence for intermediate conformational states. J Biol Chem 279:686–691 [DOI] [PubMed] [Google Scholar]