Abstract
A pharmacokinetics (PK)/pharmacodynamics (PD) model was developed to describe the tolerance and rebound for reticulocyte (RET) and red blood cell (RBC) counts and the hemoglobin (Hb) concentrations in blood after repeated intravenous administrations of 1350 IU/kg of recombinant human erythropoietin (rHuEPO) in rats thrice weekly for 6 weeks. Drug concentrations were described by using a quasi-equilibrium model. The PD model consisted of a lifespan-based indirect response model (LIDR) with progenitor cells [burst colony-forming unit erythroblasts and colony-forming unit erythroblasts (CFUs)], normoblasts (NOR), RETs, and RBCs. Drug–receptor complex stimulatory effects on progenitor cells differentiation and RBC lifespan were expressed by using the Emax model (Smax-epo and SC50-epo, Emax and EC50). The Hb profile was indirectly modeled through a LIDR model for mean corpuscular hemoglobin (with a lifespan Tmch) including a linear (Smax-mch) drug stimulatory effect. The negative feedback from RBCs accounted for the time-dependent rHuEPO clearance decline. A simultaneous PK/PD fitting was performed by using MATLAB-based software. PK parameters such as equilibrium dissociation, erythropoietin receptor degradation, production, and internalization rate constants were 0.18 nM (fixed), 0.08 h−1, 0.03 nM/h, and 2.51 h−1, respectively. The elimination rate constant and central volume of distribution were 0.57 h−1 and 40.63 ml/kg, respectively. CFU and NOR, RET, and RBC lifespans were 37.26 h, 17.25 h, and 30.15 days, respectively. Smax-epo and SC50-epo were 7.3 and 0.47 10−2 nM, respectively. Emax was fixed to 1. EC50 and SC50-epo were equal. Smax-mch and Tmch were 168.1 nM−1 and 35.15 days, respectively. The proposed PK/PD model effectively described rHuEPO nonstationary PK and allowed physiological estimates of cell lifespans.
Introduction
Erythropoiesis is the physiological process by which red blood cells (RBCs) are produced in the body. Erythropoietin (EPO) is a 30.4-kDa glycoprotein hormone produced mainly by the kidneys. EPO is responsible for maintaining the steady-state production of erythrocytes and oxygen homeostasis. It exerts its erythropoietic effects by binding to specific activating EPO receptors (EPORs) on the membranes of erythroid progenitor cells such as the burst colony-forming unit erythroblasts (BFUs) and the colony-forming unit erythroblasts (CFUs) in the bone marrow. The consequent effects include survival, cellular proliferation, terminal differentiation to the stage normoblasts (NORs), and the release of the reticulocytes (RETs) into the peripheral circulation, later resulting in an increase in mature RBC counts and hemoglobin (Hb) levels in the blood (Flaharty, 1990).
Recombinant human erythropoietin (rHuEPO) is structurally very similar to endogenous EPO (Egrie, 1990). Receptor-mediated endocytosis and lysosomal degradation in the bone marrow have been recognized as the primary mechanisms for its nonlinear pharmacokinetics (PK) and a major clearance pathway (Kato et al., 1997; Chapel et al., 2001; Veng-Pedersen et al., 2004). The intracellular signaling that follows the binding of rHuEPO to EPORs leads to the down-regulation of EPOR expression and may contribute to the nonstationary PK of rHuEPO (Verdier et al., 2000). However, EPOR activation is very transient because of the rapid internalization and degradation of the EPO–EPOR complex (Walrafen, 2005). A recent study has also shown that mechanisms independent of the EPOR pathway may play an important role in the clearance of erythropoietin-stimulating agents through nonsaturable glomerular filtration and hepatic uptake involving the asialoglycoprotein receptor (Agoram et al., 2009).
rHuEPO has been shown to be effective in the treatment of anemia in patients with chronic renal failure, human immunodeficiency virus, and cancer patients undergoing chemotherapy. rHuEPO facilitates autologous blood predonation and reduces the need for allogenic blood transfusion in perisurgical settings (Hodges et al., 2007). Conversely, inappropriate activation of erythropoiesis may predispose patients to aplastic anemia because of the transient suppression of the erythropoietic activity in bone marrow (Casadevall et al., 2002). This suppression may result from negative feedback on the production of progenitor cells or depletion of medullary precursor cells after excessive stimulation by rHuEPO. Previous comprehensive PK/pharmacodynamics (PD) modeling analyses suggested that RETs (Ramakrishnan et al., 2004) or Hb (Woo et al., 2006, 2007) are responsible for the counter-regulatory mechanisms. More recently, an alternative model featuring the depletion of a precursor pool, a concept introduced by Sharma et al. (1998) and Hazra et al. (2006), has been proposed to describe the tolerance and rebound phenomena observed for RETs after a single subcutaneous dose of rHuEPO in healthy volunteers (Krzyzanski et al., 2008). In this paradigm, the erythropoietic processes might not be fast enough to compensate for the excessive stimulatory effect of rHuEPO on the differentiation of cells at one or more stages of maturation, leading to the exhaustion of a particular cell population and consequently to the reduced production of all downstream cell types.
The purpose of our study was to develop a mechanism-based PK/PD model that describes simultaneously rHuEPO nonstationary PK and the process of erythropoiesis in rats after repeated stimulations with high dose of rHuEPO over a long treatment period. Our objectives were to: 1) characterize the decline in rHuEPO clearance over time; 2) characterize changes in RBC survival and Hb levels over time under stress erythropoiesis; and 3) propose a mechanism for the tolerance effect and rebound phenomena described previously for RETs in the bloodstream after a single intravenous or subcutaneous administration of rHuEPO in rats (Woo et al., 2006). We present a comprehensive PK/PD model that proposes a mechanistic relationship between rHuEPO concentrations and the hematological responses to rHuEPO over time, which, in turn, drive a time-dependent change in rHuEPO elimination.
Materials and Methods
Animals.
Male Wistar rats were obtained from Charles River Laboratories, Inc. (Wilmington, MA). The study was initiated when the animals were 12 weeks old and had a mean weight of 450 ± 25 g. The animals treated with rHuEPO were fed standard food (Harlan Teklad, Madison, WI) supplemented with 1% (w/w) carbonyl iron (Sigma-Aldrich, St. Louis, MO). Control rats were fed a standard diet without iron supplementation. All animals had free access to food and water and were maintained on a 12/12-h light/dark cycle. The animals were acclimatized for 1 week before initiation of the study. All study protocols were approved by the Institutional Animal Care and Use Committee of the State University of New York (Buffalo, NY).
Erythropoietin.
Recombinant human erythropoietin (10,000 IU/ml; Amgen, Thousands Oaks, CA) is a recombinant 165-amino acid glycoprotein produced by mammalian cells transfected with the human gene for EPO. Endogenous EPO and rHuEPO have the same molecular mass (30,400 Da).
Experimental Design.
We randomized 15 rats to five groups of three rats each. One group was injected with saline (B Braun Medical Inc., Irvine, CA) supplemented with 0.25% bovine serum albumin (Sigma-Aldrich); the others were injected intravenously with rHuEPO (1350 IU/kg). The rats were anesthetized with 5% isofluorane (Hospira, Inc., Lake Forest, IL) before any injection or blood sampling was carried out. This procedure was applied to each animal up to three times per 48 h. Either placebo or epoetin α was injected through the tail vein three times per week over 6 weeks. Blood samples were collected from the tail vein of treated and control animals after a staggered sampling strategy to minimize the volume of blood drawn from each animal each day. Control animals were sampled by using the same sampling scheme as one of the treated groups. The typical volume of blood sampled reached 100 ± 20 μl for rHuEPO assay but only 50 ± 10 μl for PD measurements. In the latter case, blood was anticoagulated with 2% EDTA (Sigma-Aldrich). This experimental design resulted in the withdrawal of <0.5% of the total blood volume per day for both types of animal groups and was in agreement with the Institutional Animal Care and Use Committee guidelines on chronic blood sampling, which allow a maximum collection volume of 1% of total blood volume per day.
PK analysis was based on serum rHuEPO concentrations in samples drawn at 0, 5, 15, and 30 min then 1, 2, 4, 8, 12, 16, 24, 32, and 48 h after the intravenous injection. Three full PK profiles were performed on days 0, 16, and 28, and an additional washout profile was started after the last rHuEPO injection on day 36. The erythropoietic effects of rHuEPO were evaluated by measuring RET and RBC counts and Hb concentrations daily through day 14 and every 2 days thereafter through day 60. Iron status was monitored by measuring plasma transferrin and ferritin concentrations on weeks 1, 3, 5, and 7, and rHuEPO immunogenicity was carefully monitored by detecting anti-rHuEPO antibodies on weeks 2, 4, 6, and 8.
rHuEPO Serum Concentrations.
Blood samples were drawn from the tail vein without anticoagulant then centrifuged within 30 min of collection to avoid hemolysis. The initial centrifugation was carried out at 400g for 15 min at room temperature (20–25°C). The serum was then separated, centrifuged at 5000g for 20 min, and stored at −20°C in a nonself-defrosting freezer. All samples for rHuEPO concentration determination were analyzed the same day to reduce variability. The rHuEPO concentrations were measured by using the Quantikine IVD erythropoietin enzyme-linked immunosorbent assay (ELISA) kit (R&D Systems, Minneapolis, MN) according to the manufacturer's instructions. This assay is specific for rHuEPO and, thus, did not detect endogenous EPO. The standard curve ranged from 0 to 200 mIU/ml; serum samples containing >200 mIU/ml were diluted with diluents provided by the manufacturer. The lower limit of detection was <1 mIU/ml, the lower limit of quantification was 2 mIU/ml, and the coefficient of variation (CV) over the range of measured concentrations was <10%.
Hematological Parameters.
RBC count (106 cell/μl), Hb concentration (g/dl), mean corpuscular hemoglobin (MCH; pg/cell), mean corpuscular volume (MCV; fL), mean corpuscular hemoglobin concentration (MCHC; g/dL), hematocrit (Hct; %), platelet count (105 cell/μl), white blood cell count (103 cell/μl), and white blood cell differential were determined with a Cell-Dyn 1700 counter (Abbott Laboratories, Abbott Park, IL) in an anticoagulated blood samples within 4 h of collection. The RET count was determined by flow cytometry (FACSCalibur; BD Biosciences, San Jose, CA). All procedures were carried out according to the manufacturer's instructions.
Iron Monitoring.
Plasma transferrin and ferritin concentrations were determined with immunoperoxidase assay kits from ICL, Inc. (Newberg, OR) according to the manufacturer's instructions. The standard curves ranged from 6.25 to 400 ng/ml for transferrin and from 12.5 to 400 ng/ml for ferritin. The lower limits of detection were 6.25 and 12.5 ng/ml for transferrin and ferritin, respectively, and the CV over the range of measured concentrations was <20% for each assay.
Anti-EPO Antibodies Detection.
rHuEPO was biotinylated following a procedure described by Wojchowski and Caslake (1989). The biotinylated rHuEPO was coated on commercially available multiwell polystyrol plates coated with streptavidine (Sigma-Aldrich). Anti-rHuEPO antibodies were then detected by ELISA, as described by Kientsch-Engel et al. (1990) and Tillmann et al. (2006). The anti-rHuEPO antibodies contained in the animal sera and bound to the biotinylated rHuEPO were detected by using rabbit anti-rat Fab fragments conjugated with horseradish peroxidase (Sigma-Aldrich) and the specific substrate 2,2′-acino-di(3-ethylbenz-thiazoline-sulfonic) acid (Sigma-Aldrich). An antierythropoietin antibody produced in rabbit (Sigma-Aldrich) served as a positive control and was used at three concentrations (5, 10, and 15 μg/ml). One negative control (blank: 0 μg/ml) was used to test the reliability of the reaction. The specificity of the assay was evaluated in parallel by using bovine serum albumin. The cutoff for the positive samples was a 50% decrease in absorbance. The lower limit of detection in the ELISA was 5 μg/ml. This assay was specific to antibodies binding to the rHuEPO not to the rat EPO. Antibodies against rat EPO may cross-react with rHuEPO but are not specific enough to strongly bind to it and, thus, are cleared from the media after washing.
The PK/PD Model.
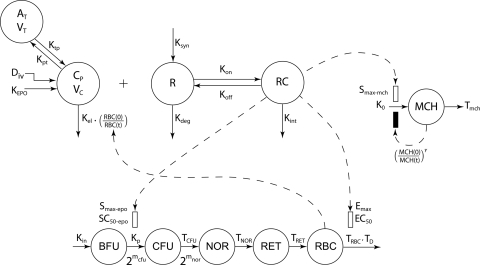
Several comprehensive PK/PD models for rHuEPO have been developed in different animal species including monkeys (Ramakrishnan et al., 2003), rats (Woo et al., 2006, 2007), and humans (Ramakrishnan et al., 2004). The catenary lifespan approach based on the rHuEPO–EPOR-driven depletion of the BFU compartment in the bone marrow was modified to capture the observed tolerance effect and rebound phenomenon (Sharma et al., 1998; Krzyzanski et al., 2005, 2008). The PK/PD model illustrated in Fig. 1 was fitted to the hematological responses and is described below (further details are provided in Appendix).
Fig. 1.
Schematic diagram of the simultaneous PK/PD model for rHuEPO on blood reticulocytes, red blood cells, and mean corpuscular hemoglobin. Symbols are defined under Appendix.
The PK model for unbound rHuEPO serum concentrations (Cp) consists of a target-mediated drug disposition (TMDD) model assuming quasi-equilibrium (QE) (Mager and Krzyzanski, 2005) characterized by the following system of equations:
 |
where Ctot represents the total drug concentration, AT is the amount of drug in the peripheral compartment, Rtot is the total receptor capacity, KEPO is the production rate of endogenous EPO (fixed to 0), Kint is the rate constant of drug–receptor complex internalization, Kel is the drug elimination rate from the central compartment, RBC(t) is the RBC count at time t, Kpt is the central-to-peripheral compartment transfer rate, Ktp is the peripheral-to-central compartment transfer rate, Vc is the volume of the central compartment, Kdeg is the free receptor degradation rate, and KD is the drug–receptor complex equilibrium dissociation constant.
The initial conditions for the differential equations (eqs. 1–3) were:
where Div is the rHuEPO dose and Rtot0 is the estimated amount of free receptor at time 0. The time course for RC was calculated:
Erythropoiesis was described by using a catenary lifespan-based indirect response model with five compartments representing three types of medullary cells (BFU, CFU, and NOR) and two types of circulating cells (RET and mature RBC, symbolized by RBCM):
 |
 |
 |
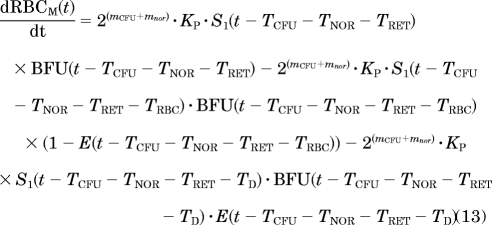 |
where Kin is the production rate of BFU, Kp is the rate constant at which BFU differentiates into CFU, mcfu and mnor are the average proliferations of BFU and CFU, respectively, through mitosis both fixed to 4 (Wintrobe, 2003), and TCFU, TNOR, TRET, and TRBC are the mean lifespans of CFUs, NORs, RETs, and mature RBCs, respectively. Kin was estimated as a secondary parameter according to:
where BFU0 is the count of BFU at time 0 (see eq. 17). To avoid identifiably issues, the lifespans TCFU and TNOR were pooled into a single parameter TPRO (TCFU + TNOR) representing the mean lifespan of the all progenitor cells in the bone marrow.
In the proposed paradigm, rHuEPO affects the process of erythropoiesis through two mechanisms:
- The RC-driven stimulation S1 of the BFU differentiation into CFU, represented by:
where Smax-epo is the maximum stimulation effect, and SC50-epo is the drug–receptor concentration producing 50% of Smax-epo.
- The reduction of the mean lifespan of mature RBC from TRBC to TD, where the proportion of mature RBC with a reduced lifespan depends on RC:
where Emax is fixed to 1. The parameter TD was computed as TD = (1 − α)·TRBC, where TRBC is estimated as a secondary parameter with

To well capture the RBC linear decline after rHuEPO injections stopped, the parameter α was fixed to 1 and therefore TD = 0.
By assuming steady state, one can solve for the initial conditions of eqs. 9 to 13:
where RET0 and RBC0 are the average count of RETs and total RBCs measured at time 0: 17.46 104 and 7.5 106 cell/μl, respectively.
The observed RET and RBC counts were fitted to RETtotal and RBCtotal according to:
where RETb(t) and RBCb(t) are the RET and RBC baselines fitted by using eqs. 29 and 30. ΔRET and ΔRBC indicate the differences from the baseline value of RET [ΔRET(t) = RET(t) − RET0)] and RBCM [ΔRBCM = RBCM − RBCM(0)].
Measured data for MCH were fitted to a lifespan-based indirect response model using a single compartment that represents the residence time of MCH in the body (Tmch). The dynamics of MCH over time is governed by:
where K0 is the production rate of MCH, dependent on Tmch and the estimated MCH at time 0 (MCH0) according to:
The effect of rHuEPO on MCH was captured by a linear stimulatory function S2 driven by RC and defined as:
where Smax-mch is the slope of the RC effect. In addition, the tolerance and rebound phenomena observed on MCH were captured by a negative feedback I(t) driven by the MCH increase relative to its baseline MCH0 using the following ratio:
Ultimately, the Hb concentrations were calculated as:
In summary, the PK parameters Vc, Kel, Kpt, Ktp, Kint, Kdeg, and Rtot0 and the PD parameters Smax-epo, SC50-epo, Kp, TPRO, TRET, Smax-mch, Tmch, γ, and MCH0 were estimated.
Hematological Baseline Fittings.
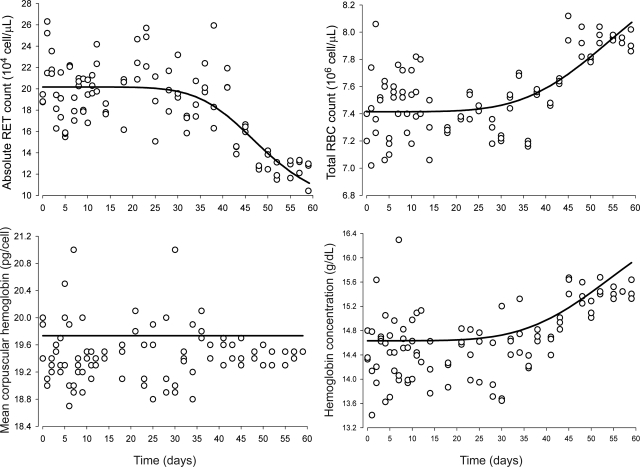
The baselines of PD biomarkers for RET and RBC showed time-dependent changes in the control group. The magnitudes of change were high enough to consider aging effects in the model. Therefore, all collected sampling data from untreated animals were pooled and modeled by using empirical Hill functions to account for the decline in RET and rise in RBC:
 |
 |
with zeta = 0.3·T1/2−RET and lamba = 0.5· T1/2−RBC, where T1/2−RET and T1/2−RBC represent, respectively, the time where the baselines in RETs or RBCs decreased or increased by 50% of the magnitude of change (RETmax − RETmin or RBCmax − RBCmin).
The MCH baseline was modeled as a constant (using both control and treated animals). The baseline of RBC in association to the constant baseline in MCH drives the changes in the baseline of Hb via eq. 28.
Data Analysis.
All data were pooled for the analysis. Serum rHuEPO concentration versus time profiles were first analyzed by a noncompartmental approach using WinNonlin (Pharsight, Mountain View, CA). Because the ELISA did not detect endogenous EPO, the PK parameters were calculated by using serum EPO concentrations that were not corrected to the endogenous baseline. For the first PK profile, area under rHuEPO concentrations curve (AUC) and area under moment curve (AUMC) were calculated by the linear trapezoidal rule with extrapolation to infinity. The analysis of the following PK profiles assumed that the steady state was reached; AUCss and AUMCss were thus calculated from 0 to 48 h. Total body clearance (CLTotal) was estimated as Div/AUC. The mean residence time (MRT) and the steady-state volume of distribution (Vss) were calculated as described for multiple-dosing regimen (Cheng and Jusko, 1991) using:
The optimization of the PK/PD models for baseline and 1350 IU/kg dose data were performed sequentially by using the MATLAB-based software Scarabee version 1.0 (http://code.google.com/p/pmlab/downloads/list). Parameter estimates were obtained after minimization of a likelihood-derived function by the Nelder-Mead Simplex algorithm, which is implemented in MATLAB version 7.6.4 through the fminsearch function (The Mathworks Inc., Natick, MA) (Lagarias et al., 1998). Delayed differential equations were solved by using the dde23 solver, which is based on an explicit Runge-Kutta formula (Dormand and Prince, 1980). The covariance matrix and the CV on parameter estimates were calculated as described in the users manual of ADAPT software (D'Argenio and Schumitzky, 1997). The residual variability in PK- and PD-dependant variables were modeled with proportional (eq. 33) and additive (eq. 34) models:
where Vi and Vi,j are the variance of the residual for the ith observation data point and the variance of the residual for the ith data point of jth PD response, respectively; Yi is the prediction for the ith observation data point; and σi and σj are the variance parameters.
Model Simulations.
We carried out a series of simulations to examine our PK/PD model. In the first set of simulations, the hematological responses of RETs, RBCs, MCH, and Hb after a single injection were generated by using different values for Emax. A second set of simulations was conducted to show the dynamics of free and bound EPORs after the same dosing scheme used in our study. The dynamics of the free EPOR was given by:
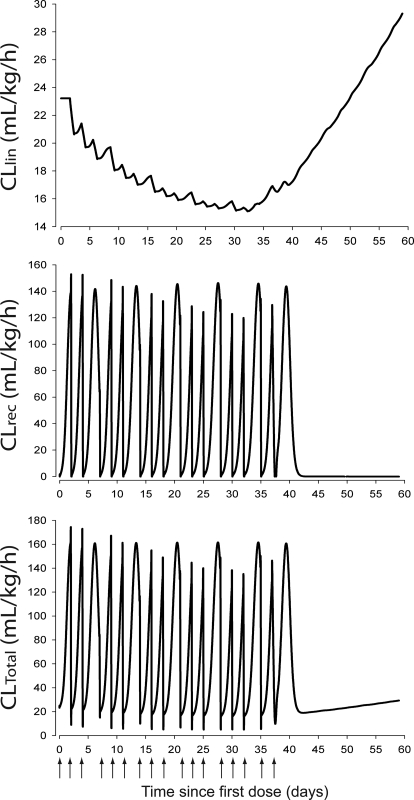
A third set of simulations aimed to illustrate the time-dependent changes in the different clearance pathways of rHuEPO, i.e., the linear elimination (CLlin), the receptor-mediated clearance (CLrec), and the total body clearance (CLTotal). The changes in the three clearances after the multiple rHuEPO administrations regimen used in our study were obtained by using the following equations (Wiczling et al., 2009):
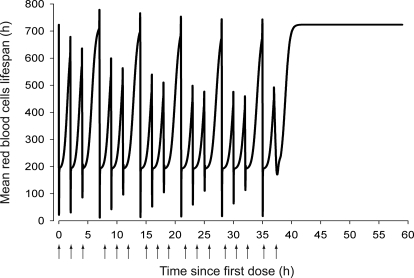
Finally, the variations in the mean RBC lifespan MLRBC(t) after the repeated rHuEPO injection schedule used in our study was simulated according to Krzyzanski et al. (2008):
Results
Pharmacokinetics.
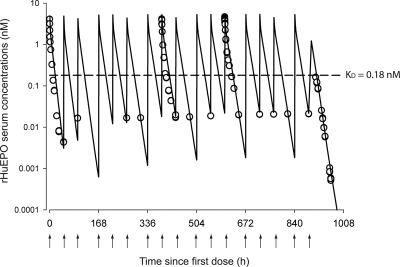
Figure 2 shows the observed and predicted rHuEPO serum concentrations versus time profiles after a thrice-weekly intravenous dosing with 1350 IU/kg over 6 weeks. The PK parameters calculated by a noncompartmental approach for each PK profile are listed in Table 1. The nonstationary PK of rHuEPO was revealed by the decline in CLTotal over time that was estimated at approximately 55% between the first and 12th intravenous injections. Because repeated exposures to human proteins could lead to the development of an immune reaction and a decrease of the rHuEPO clearance by antibody-driven capture of the drug, we monitored rHuEPO immunogenicity over the course of the entire study plus 2 weeks beyond its completion. All animals were negative for anti-rHuEPO antibodies, except one rat that was found positive on day 57. This animal was euthanized and excluded from the analysis.
Fig. 2.
Time course profiles of rHuEPO serum concentrations after multiple intravenous injections of 1350 IU/kg thrice weekly for 6 weeks. The observed data are represented by ○, and the lines represent the model predictions using eq. 4. The arrows represent intravenous dosing events.
TABLE 1.
Estimated values of pharmacokinetic parameters with their corresponding CV% obtained by noncompartmental analysis of mean rHuEPO serum concentrations after intravenous administration of 1350 IU/kg three times a week over 6 weeks
| Parameter (unit) | Definition | 1350 IU/kg Three Times a Week for 6 Weeks |
||
|---|---|---|---|---|
| PK1 (IV1) | PK2 (IV8) | PK3 (IV12) | ||
| AUC (IU/ml·h) | Area under the concentration curve | 49.4 (2.3) | 77.6 (12) | 104.2 (2.7) |
| CLTotal (ml/h/kg) | Total clearance | 27.3 (2.4) | 17.4 (16.5) | 12.9 (2.7) |
| MRT (h) | Mean residence time | 5.58 (4.4) | 7.19 (7.9) | 8.40 (10.3) |
| Vss (ml/kg) | Steady-state volume of distribution | 152 (2.3) | 125 (52.3) | 108 (6.3) |
For the three analyzed PK profiles, the steady-state volume of distribution Vss was larger than the initial volumes of distribution calculated as the ratio of the dose over the estimated rHuEPO at time 0 (Div/Cp0), indicating rHuEPO was distributed outside of the blood compartment and therefore the need for a peripheral compartment in the developed PK model. In parallel, Vss exhibited a time-dependent decrease (29%) between the first and 12th injections.
The general characteristics of TMDD PK (Mager and Jusko, 2001) were previously revealed for rHuEPO, and the TMDD model successfully captured its concentration time course profiles for five escalating single doses (Woo et al., 2007). However, to reduce the number of model parameters the QE assumption was used to fit our data (Mager and Krzyzanski, 2005). The PK parameters obtained by the simultaneous fitting of the PK and PD are listed in Table 2. All PK parameters were precisely estimated, and the coefficients of variation were <20%. Only Kint showed a CV of 51.1%.
TABLE 2.
Estimated pharmacokinetic and pharmacodynamic parameters for rHuEPO
| Parameter (unit) | Definition | Estimate | CV% |
|---|---|---|---|
| Vc (ml/kg) | Central volume of distribution | 40.63 | 13.8 |
| Kel (h−1) | First-order elimination rate constant | 0.571 | 2.67 |
| Kpt (h−1) | First-order intercompartmental rate constant | 0.318 | 5.9 |
| Ktp (h−1) | First-order intercompartmental rate constant | 0.294 | 4.91 |
| Kint (h−1) | First-order internalization rate constant | 2.512 | 51.1 |
| Kdeg (10−1 h−1) | First-order EPOR degradation rate constant | 0.807 | 13.2 |
| KD (10−1 nM)b | Equilibrium dissociation constant | 0.18 | NA |
| Rtot0 (nM) | EPOR maximum binding capacity | 0.408 | 8.21 |
| Ksyn (10−1 nM/h)a | Zero-order EPOR production rate constant | 0.329 | 8.81 |
| KEPO (nM/h)b | Zero-order endogenous EPO production rate constant | 0 | NA |
| Kin (10−2 cell/μl/h)a | Zero-order production rate of BFU | 0.395 | 0.14 |
| mcfu (−)b | Average proliferation of BFU to CFU in bone marrow | 4 | NA |
| mnor (−)b | Average proliferation of CFU to NOR in bone marrow | 4 | NA |
| Smax-epo (−) | Maximum stimulation on BFU differentiation to CFU | 7.308 | 2.41 |
| SC50-epo (10−2 nM) | Concentration for 50% stimulation on BFU differentiation | 0.467 | 48.1 |
| Emax (−)b | Maximum stimulation on RBC loss after third injection | 1 | NA |
| Kp (10−3 h−1) | First-order rate constant for BFU differentiation to CFU | 0.186 | 5.15 |
| TPRO (h) | Progenitors mean lifespan | 37.26 | 0.03 |
| TRET (h) | RET mean lifespan | 17.25 | 0.14 |
| TRBC (days)a | RBC mean lifespan | 30.15 | 0.14 |
| TD (h)a | RBC mean lifespan change calculated as (1− α)·TRBC | 0 | NA |
| Ko (10−1 pg/cell/h)a | Zero-order production rate for MCH | 0.229 | 0.31 |
| Smax-mch (nM−1) | Maximal stimulation of Ko | 168.1 | 51.2 |
| Tmch (days) | Mean residence time for MCH in blood | 35.15 | 0.23 |
| g (−) | Power coefficient on feedback function on MCH production | 7.415 | 13.6 |
| MCH0 (pg/cell) | Baseline for MCH | 19.37 | 0.27 |
| α (−)b | Fraction TRBC reduction under rHuEPO treatment | 1 | NA |
CV is expressed as SD/mean. NA, not applicable.
Secondary parameter.
Fixed parameter.
Pharmacodynamics.
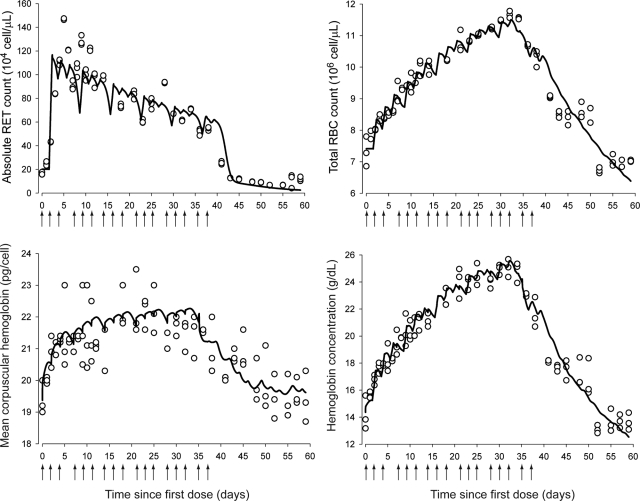
After cessation of rHuEPO treatment, the blood sampling was carried out for PD measurements for an additional 23 days. The stimulatory effects of rHuEPO on erythropoiesis are shown in Fig. 3, which depicts both observed and predicted RETs, RBCs, MCH, and Hb. Observed absolute RET counts peaked 24 h after the third injection, i.e., approximately 5 to 6 days. However, the animals rapidly developed tolerance to rHuEPO as shown by the steady decline in RET counts after the peak, even though rHuEPO was still being administered to the animals, and thus, high EPO concentrations were maintained in blood. This decline continued in an oscillatory manner until RET counts fell below their baselines soon after treatment withdrawal, characteristic of a rebound phenomena. Ultimately, observed RET counts returned to normal control values by day 57.
Fig. 3.
Time course profiles of absolute blood reticulocyte counts (top left), red blood cells (top right), mean corpuscular hemoglobin (bottom left), and hemoglobin (bottom right). The observed data are represented by ○. The solid lines represent the model predictions using eqs. 22 (top left), 23 (top right), 24 (bottom left), and 28 (bottom right). The arrows represent intravenous dosing events.
Measured total RBC counts and measured Hb responses showed a parallel trend (Fig. 3). Both observed total RBCs and observed Hb increased constantly until they peaked on day 32 for RBCs and day 34 for Hb. However, the tolerance of rHuEPO also affected RBCs and Hb, which both decreased to anemic values with RBC nadirs at 12.5% and Hb nadirs at 16% of control animal values. RBCs recovered to their normal baseline values by day 59, but Hb did not, possibly because of the short time frame of our study (60 days), which may have prevented the stabilization of the hematological endpoints in control animals. MCH amounts reflect the average amount of hemoglobin contained in each RBC. MCH is an important erythropoietic biomarker because it informs about the rate and dynamics of synthesis of Hb. After an increase of approximately 18 days, MCH reached a plateau (Fig. 3), staying relatively constant for 18 days, then decreased below its normal values but did not return to normal values by the end of the study. Our model was able to capture all the features of the observed time course of RETs, total RBCs, and mean corpuscular Hb.
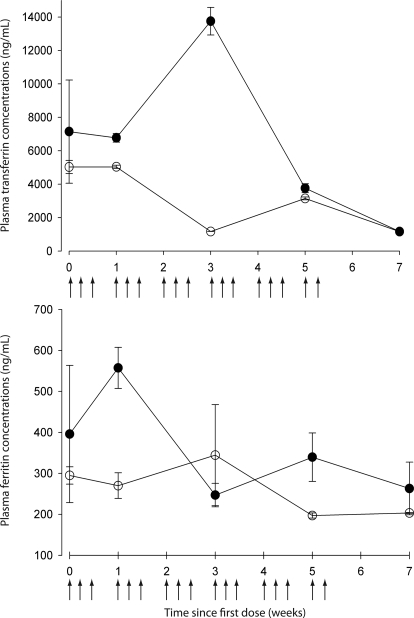
Finally, our experiments showed no iron depletion during and after stress erythropoiesis, because both plasma transferrin and ferritin concentrations in treated rats remained in the range of values obtained in the control animals (Fig. 4).
Fig. 4.
Top, mean serum transferrin concentration-time profile. Bottom, mean serum ferritin concentration-time profile. Means (n = 12) ± S.D. of treated animals (●) and means (n = 3) ± S.D. for the control animals (○) are shown.
Previously published PK/PD models using lifespan concepts with feedback regulatory loops driven either by RET (Ramakrishnan et al., 2004) or Hb change from baseline (Woo et al., 2006) have been used to characterize the erythropoietic effect of rHuEPO. The Hb-driven counter-regulation loop model (Woo et al., 2006) was simulated by using our dosing regimen. The RET response showed rapid tolerance and the predicted RBC count did not decrease after the treatment withdrawal because longer dosing creates more homeostatic changes. In this study, a precursor pool depletion mechanism implemented via the stimulatory effect of rHuEPO–EPOR complexes on the differentiation of BFU into CFU was considered to be responsible for both tolerance and rebound phenomena observed in RETs and RBCs. Additional effects of the rHuEPO–EPOR complexes on RBC lifespan distribution were incorporated into the model to account for the drug effect on RBC lifespan. The tolerance and rebound in MCH and indirectly in Hb were accounted for by a negative feedback loop on Hb synthesis driven by the ratio
 |
The PD parameters obtained by simultaneous fitting of the drug concentrations and erythropoietic responses are listed in Table 2.
The Smax-epo and SC50-epo of rHuEPO–EPOR complex in rats after multiple intravenous dosing were estimated to be 7.3 and 0.47 × 10⁻² nM. The parameter kp was estimated to be very small, 0.186 × 10⁻³ h−1, resulting in a derived maturation half-life of BFU cells of 160.4 days. The duration of erythropoiesis processes in the bone marrow was determined by the parameter TPRO and was estimated to be 1.56 days. The time needed for RETs to mature in blood to the stage RBCs is accounted for by their mean lifespan TRET of 17.25 h. The estimated TRET represents only the average RET lifespan in blood and discounts the maturation time of RET in the bone marrow. The estimated mean lifespan for RBC was 30.15 days.
The estimated mean residence time of MCH in blood circulation was 35.15 days, which was consistent with the value of TRBC. The slope Smax-mch of drug effect on MCH was estimated at 168.1 nM−1. An alternative Emax model for drug effect was initially tested but the half-stimulatory concentration was consistently found to be much higher than the range of the predicted rHuEPO–EPOR complex concentrations and could not be precisely estimated. Accordingly, we simplified the model to the current linear function, with slope representing the ratio of Smax/SC50 of the initial Emax function. All PD parameters were estimated with reasonable precision with CV < 20%, except for Smax-mch and SC50-epo, which had CVs of 51.2 and 48.1%, respectively. This result was expected, because a better resolution for those parameters usually requires two dose levels or one that is very large (Krzyzanski et al., 2006).
Hematological Baseline Changes.
Over the course of the study, control animals showed changes of low magnitude in their hematological responses that warranted modeling of time-variant baselines RETb, RBCb, and Hbb. The related parameter estimates are summarized in Table 3. The observed and predicted baseline versus time profiles are depicted in Fig. 5. The average baseline values for RET were stable at RETmax 20.13 × 10⁴ cells/μl until 30 to 35 days after the beginning of the study, then slowly decreased toward a new steady-state level at RETmin ∼9.08 × 10⁴ cells/μl. Conversely, the average RBC baseline values were stable at RBCmin ∼7.42 × 10⁶ cells/μl until 30 to 35 days after the first placebo administration, then raised to a slightly higher steady state at RBCmax ∼8.14 × 10⁶ cells/μl at the last day of the experiment. The MCH was found to be fairly stable over the course of the study and fitted at MCH0 ∼19.73 pg/cell. The baseline of Hb was calculated by using eq. 28 and was parallel to the RBCb versus time profile.
TABLE 3.
Estimated pharmacokinetic and pharmacodynamic parameters for RET and RBC baselines
| Parameter (unit) | Definition | Estimate | CV% |
|---|---|---|---|
| RETMin (104 cell/μl) | Minimum value for RET baseline | 9.07 | 37.3 |
| RETMax (104 cell/μl) | Maximum value for RET baseline | 20.13 | 1.69 |
| T1/2-RET (days) | Age1/2 of animals past since the beginning of the study for RET baseline change | 48.04 | 10.4 |
| hRET | Hill coefficient for RET | 4.95 | 46.5 |
| RBCMin (106 cell/μl) | Minimum value for RBC baseline | 7.42 | 0.32 |
| RBCMax (106 cell/μl) | Maximum value for RBC baseline | 8.14 | 3.79 |
| T1/2-RBC (days) | Age1/2 of animals past since the beginning of the study for RBC baseline change | 46.6 | 13.9 |
| hRBC | Hill coefficient for RBC | 3.85 | 72.8 |
Fig. 5.
Changes in baselines values of absolute blood reticulocyte counts (top left), red blood cells (top right), mean corpuscular hemoglobin (bottom left), and hemoglobin (bottom right). The observed data are represented by ○, and the lines represent the model predictions using eq. 29 (top left), eq. 30 (top right), MCH baseline (bottom left), and eq. 28 (bottom right), respectively.
Model Simulations.
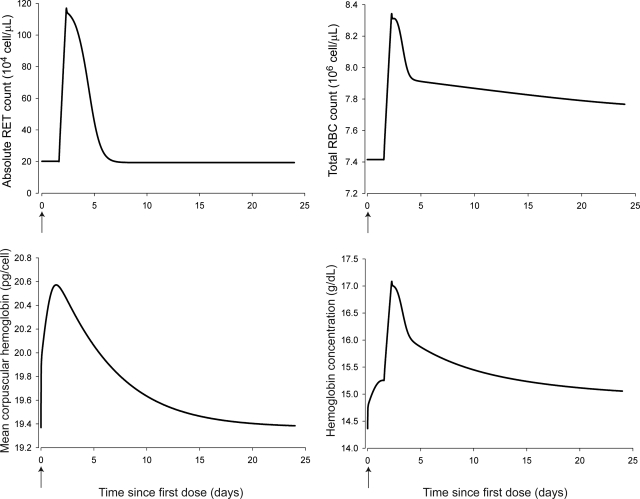
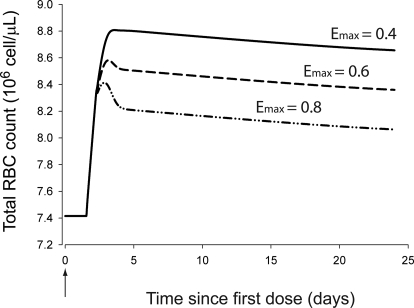
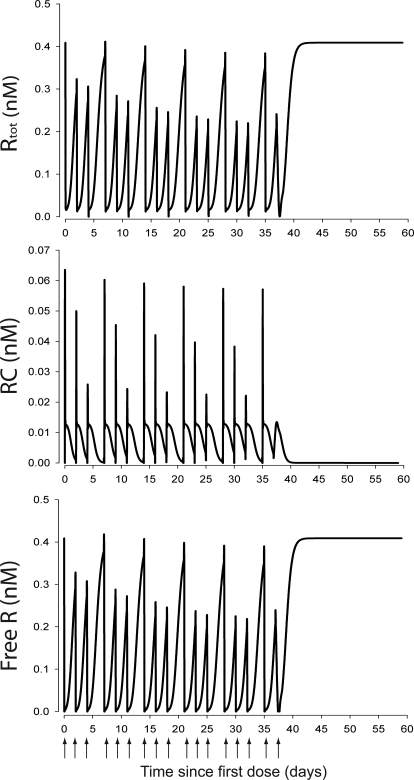
The simulated hematological responses after single dose are depicted in Fig. 6. The effect of Emax on the profile of RBC(t) after single dose is illustrated in Fig. 7. The simulated profiles for Rtot(t), RC(t), and R(t) after multiple doses are illustrated in Fig. 8. Figure 9 shows the simulated profiles for the linear elimination CLlin(t), the receptor-mediated clearance CLrec(t), and the total body clearance CLTotal(t) after multiple doses. The simulated mean RBC lifespan MLRBC(t) is represented in Fig. 10.
Fig. 6.
Time course profiles of model-predicted hematological responses after single intravenous doses of 1350 IU/kg using the final parameter estimates and Emax fixed to 1. Top left, simulated RETs. Top right, simulated RBCs. Bottom left, simulated MCH. Bottom right, simulated Hb.
Fig. 7.
Time course profiles of model-predicted RBC(t) after a single intravenous dose of 1350 IU/kg using the final parameter estimates and different Emax values.
Fig. 8.
Time course profiles of model-predicted Rtot(t), RC(t), and R(t) concentrations. Top, total EPOR pool concentrations time course profile, Rtot(t). Middle, rHuEPO–EPOR complexes concentration time course profile, RC(t). Bottom, free EPOR concentration time course profile, R(t).
Fig. 9.
Time course profiles of model-predicted rHuEPO clearance pathways. Top, model-predicted linear clearance time course profile, CLlin(t). Middle, model-predicted EPOR mediated clearance time course, CLrec(t). Bottom, model-predicted total rHuEPO clearance time course, CLTotal(t).
Fig. 10.
Time course profile of model-predicted mean RBC lifespan, MLRBC(t).
Discussion
We report a mechanism-based model developed to describe rHuEPO time-dependent PK and its erythropoietic responses in rats. The nonstationary PK of rHuEPO was successfully captured by using our proposed CLlin attenuation model. Recent studies demonstrated that for large single intravenous doses in mice and rats (Agoram et al., 2009) or multiple subcutaneous injections in humans (Krzyzanski et al., 2005) rHuEPO PK is linear. We, therefore, used the RBC-driven negative retroregulation loop on Kel to capture the observed CLlin decline. An alternative model describing EPOR down-regulation with
was tested. The fittings were comparable in both models. The Akaike information criterion was lower for our proposed model (4156.5 versus 4191.3). We selected the CLlin attenuation model based on the availability of RBC measurements, because our study was not designed to measure progenitor cells in the bone marrow. Our selection is further supported by the simulations showing CLlin becoming the main clearance pathway (Fig. 9) as CLrec becomes saturated (Fig. 8).
Comparison of the EPOR dynamics to the single intravenous dose data from Woo et al. (2007) shows higher binding capacity and rate of synthesis with our dosing scheme (ksyn and Rtot ∼77 and 89% bigger). This faster EPOR turnover may arise from an increase in the count of progenitors bearing EPOR or an up-regulation of EPOR. Because an increase in Rtot caused by an amplified progenitor population size was not implemented in our model to avoid overparameterization, the former hypothesis cannot be supported. The second hypothesis is, however, more likely based on the number of PK observations below KD (0.18 nM), indicating partial saturation of EPOR. Furthermore, EPOR endocytosis (1/Kint ∼24 min) and lysosomal degradation (1/Kdeg ∼12.5 h) are comparable with in vivo estimates (Woo et al., 2007) and in vitro estimates (Gross and Lodish, 2006). This suggests that EPOR turnover is controlled by biomolecular rather than cellular trafficking mechanisms.
The observed tolerance and rebound for RETs and RBCs were well captured by the depletion of BFU cells. The bone marrow capacity to produce erythrocytes (Kin) was 98.8% lower than estimated after a single rHuEPO stimulation (Woo et al., 2007). However, the single-dose model did not account for mitosis of progenitor, contrary to our model, which included an amplification factor 2(mcfu+mnor) between BFU and NOR. The estimate of maximum stimulatory effect on erythrocytes production (Smax-epo) was consistent with the six to eight times higher production of progenitors in normal mice bone marrow receiving rHuEPO (Mide et al., 2001). Conversely, the efficacy of rHuEPO–EPOR complexes was low (SC50-epo ∼4.67 × 10⁻³ nM) but in the range of the measured concentrations and comparable magnitude with the average endogenous rat EPO concentration (6.45 × 10⁻³ nM) (Woo et al., 2008).
The duration of erythropoiesis in our study was 2.27 days (TPRO + TRET) and was consistent with the total duration of RET maturation (1.98 days) measured by flow cytometry (Wiczling and Krzyzanski, 2007). However, the small estimate of Kp suggests a very large lifespan of BFUs. The latter does not reflect a BFU rate loss but rather a baseline rate of depletion of factors necessary for erythropoiesis such as nutrients.
Very little is known regarding the effect of rHuEPO on the RBC lifespan. Our present assumption is that the newly born erythrocytes live shorter under conditions of repeated simulation with large rHuEPO doses to counterbalance the RBC mass (Bogdanova et al., 2007). Our proposed model is the first attempt to introduce the rHuEPO effect on TRBC. The estimated TRBC was shorter than normal (30.15 versus 59.8 ± 2.2 days; Derelanko, 1987), and the MLRBC(t) decreased with repeating administrations (Fig. 10). Two phenomena could explain this reduction. It has been hypothesized that the young erythrocytes might die soon after being released into the blood under stress conditions (Trial and Rice, 2004), their shortened TRBC reducing the overall population TRBC. Alternatively, extemporaneous internal hemorrhage caused by the increased RBC mass might cause additional loss of RBC. Although the assessment of the first phenomenon needs further investigation of the RBC survival, the second was unlikely, given the stability of platelet counts over the course of our study [242 (minimum) and 531.7 (maximum) 105 cells/μl] (data not shown). Any little contribution would already be implemented in the model through the overall effect of rHuEPO on RBC loss.
The changes in hematological baselines were previously observed in rats (Kojima et al., 1999) and were moderate during the time period of our study (8 weeks). The transition of RETb and RBCb from one steady state to another occurred at approximately 17 weeks of age and was consistent with a previous report (Archer et al., 1982). Two mechanisms might explain the decrease of RETb over time: either an increase in RET death rate or their sequestration and later release as mature RBCs from a peripheral organ such as the spleen (Dornfest et al., 1971). Given the increase in RBCb, the latter hypothesis is more likely.
It remains unknown whether exogenous EPO competes with the endogenous EPO or shuts down its production. We assumed the latter in our model, based on the lack of analytical method for endogenous rat EPO measurement and the large magnitude of difference (2–3 log) between reported endogenous and rHuEPO concentrations. For times beyond the duration of our study (>60 days), RBC and Hb predictions continue to decline. This may be a consequence of the profound depletion of the BFU compartment and the prolonged time delay needed to reestablish an efficient erythropoiesis as suggested by the low kp estimate. However, the lack of endogenous EPO production in our model also contributes to underpredicting the hematological responses at times when rHuEPO is completely cleared from the animals.
Our model predicted oscillations in RET and to a lesser extent in RBCs and Hb. Those oscillations reflect the frequency of rHuEPO administrations, the rapid dynamics of RET, and the blunted propagation of this oscillatory signal in the downstream hematological responses. Consistent trends, with low to no fluctuations in RBCs and Hb, were observed in the data, but could not be confirmed at the individual level because of the staggered sampling design. However, oscillations in RETs, RBCs, and Hb were reported in humans receiving multiple doses of rHuEPO (Krzyzanski et al., 2005), indicating that the staggered sampling design and interanimal variability were unlikely responsible for the fluctuations in hematological responses.
On a methodological note, using nonlinear mixed effects modeling would have been beneficial for the quantification of parameters, interanimal and residual variabilities, and the identification of pertinent covariates. The main obstacle against this approach is the lack of robust population PK/PD software able to solve the delay differential equations used in our model and accommodate stiff numerical integrations.
The simulations represented in Fig. 7 illustrate the difficulties of our model to capture the single-dose RBC response without alteration of Emax. This could result from the sparse sampling during the first dose interval (<48 h). However, our model seems more relevant to the clinical use of rHuEPO that is commonly administered in multiple-dosing schedules.
The mechanism-based nature of our model makes it suitable for allometric scaling and the predictions of drug exposures and hematological responses in humans. The extrapolation from rats to humans using allometric principles (Dedrick, 1973) for volume, clearance, and lifespan parameters has been successfully applied for rHuEPO (Mager et al., 2009). Likewise, our model can extend the allometric predictions to human EPOR binding properties. The translation of TRBC from our preclinical data to humans may help in better understanding the effect of rHuEPO on RBC loss. This information is important to clinicians in scheduling rHuEPO therapy in anemic patients, because rHuEPO is commonly used in a thrice/once-weekly dosing scheme for a few weeks. In contrast, the physiological turnover rates and the RBC potencies and sensitivities are expected to be similar (Woo and Jusko, 2007).
Although our findings described one dose level, we expect our model to be useful for reproducing human stress erythropoiesis and simulate different rHuEPO dosing regimens in anemic patients and neocytolysis conditions. Conceivably, simulations of CLlin(t) and CLrec(t) would predict rHuEPO elimination in patients suffering from anemia caused by kidney insufficiency (reduced CLlin) or bone marrow failure (reduced CLrec). In addition, the parameter TD supports the hypothesis of shorter RBC survival in neocytolysis (Trial and Rice, 2004). The rapid linear RBC and Hb decline beginning before rHuEPO therapy withdrawal also suggests that repeated administrations of high rHuEPO doses can exhaust bone marrow capacity and result in opposite long-term responses to the desired therapeutic effects. The standard clinical practice is to increase rHuEPO doses upon lack of response. Applied to humans, our model might help the identification of a safe dose able to increase erythropoiesis without depleting bone marrow capacity. These applications illustrate how modeling can help the optimization of rHuEPO therapies and predict the erythropoietic responses in a more rationale manner than traditional approaches.
In conclusion, we describe a mechanism-based PK/PD model for rHuEPO after repeated doses. It represents the first attempt to capture rHuEPO effects on RBC loss and lifespan and the retroregulation from hematologic responses on rHuEPO PK. This model yielded physiological estimates that could be projected to humans and used to improve the clinical use of the drug.
Acknowledgments
We thank Dr. Sébastien Bihorel, Dr. Pawel Wiczling, and Dr. John Harrold for sharing the source code of the Scarabee software; Dr. Donald E. Mager and Dr. Murali Ramanathan for tremendous help in the development of this model, bright insights, guidance, and dedication; and Dr. William J. Jusko for helpful review of this manuscript.
Appendix
We describe here in further details the PK/PD model (Fig. 1) used to capture rHuEPO serum concentrations, RET and RBC blood counts, and MCH and Hb concentrations measured after repeated administration of rHuEPO in rats.
The PK model proposed for rHuEPO serum concentrations consisted of a TMDD model with an assumption of quasi-equilibrium (Mager and Krzyzanski, 2005), defined by eqs. 1 to 7. Free rHuEPO distributes from the central compartment to the peripheral compartment with first-order rates (Kpt and Ktp) and is eliminated from the central compartment by a linear degradation (described by the first-order elimination rate constant kel). The unbound drug (Cp) in the central compartment binds to the free EPO receptors (R) with a second-order rate constant (Kon) to form a drug–receptor complex (RC). Once formed, RC complexes may dissociate with a first-order rate constant (koff) or undergo internalization and degradation with a first-order rate constant (Kint). EPOR are synthesized at a constant rate (represented by the zero-order rate constant ksyn) and degradated at a first-order rate constant (Kdeg). The total drug concentration (Ctot) represents the sum of Cp and RC, whereas the total receptor capacity (Rtot) represents the sum of R and RC.
QE models assume that drug receptors form and dissociate almost instantaneously and therefore that Cp, R, and RC are constantly at equilibrium, governed by eq. 8 and the constant of dissociation KD. In TMDD models assuming QE, KD is estimated rather than the constants kon and koff. In our model, KD value was fixed to literature value of 0.18 nM (Akahane et al., 1989). We also assumed that the linear elimination of rHuEPO from central compartment was proportional to the ratio RBC(0)/RBC(t). Molar units were used for concentrations of Ctot, Rtot, RC, and Cp. The measured rHuEPO concentrations were fitted to Cp after conversion to nanomolar unit by using a specific activity of 160,000 IU/mg of protein and rHuEPO molecular mass of 30.4 kDa (Fisher and Nakashima, 1992).
The endogenous EPO was not accounted for in the model because the ELISA kit used to measure rHuEPO concentrations is specific to human erythropoietin and cannot detect rat EPO. Therefore KEPO was fixed to zero.
Erythropoiesis involves a great variety and number of cells at different stages of maturation, starting with BFUs, then CFUs, NORs, RETs, and ultimately RBCs. The glycoprotein EPO has been established as the major humoral regulator of RBC production. In the presence of EPO, bone marrow erythroid precursor cells survive, proliferate, mature, and differentiate into RBCs. In the absence of EPO those cells undergo apoptosis.
A previously published PD model (Woo et al., 2006) has been modified and applied to describe the time course of RETs and RBCs and Hb via the MCH after multiple intravenous stimulations with rHuEPO. The PD model assumes three medullary precursor cell compartments such as BFUs, CFUs, and NORs and blood RETs and RBCs.
This work was supported by a Fellowship in Pharmacokinetics and Pharmacodynamics from Amgen Inc.; and the National Institutes of Health National Institutes of General Medical Sciences [Grant GM57980].
Article, publication date, and citation information can be found at http://jpet.aspetjournals.org.
doi:10.1124/jpet.110.167304.
- PK
- pharmacokinetics
- PD
- pharmacodynamics
- BFU
- burst colony-forming unit erythroblast
- CFU
- colony-forming unit erythroblast
- NOR
- normoblast
- CLlin
- linear clearance
- CLrec
- receptor-mediated clearance
- CLTotal
- total body clearance
- MCH
- mean corpuscular hemoglobin
- RBC
- red blood cell
- MLRBC
- mean lifespan of RBCs
- RET
- reticulocyte
- EPO
- erythropoietin
- rHuEPO
- recombinant human EPO
- EPOR
- EPO receptor
- ELISA
- enzyme-linked immunosorbent assay
- TMDD
- target-mediated drug disposition
- QE
- quasi-equilibrium
- CV
- coefficient of variation
- AUC
- area under rHuEPO concentrations curve
- AUMC
- area under moment curve.
References
- Agoram B, Aoki K, Doshi S, Gegg C, Jang G, Molineux G, Narhi L, Elliott S. (2009) Investigation of the effects of altered receptor binding activity on the clearance of erythropoiesis-stimulating proteins: nonerythropoietin receptor-mediated pathways may play a major role. J Pharm Sci 98:2198–2211 [DOI] [PubMed] [Google Scholar]
- Akahane K, Tojo A, Fukamachi H, Kitamura T, Saito T, Urabe A, Takaku F. (1989) Binding of iodinated erythropoietin to rat bone marrow cells under normal and anemic conditions. Exp Hematol 17:177–182 [PubMed] [Google Scholar]
- Archer RK, Festing MF, Riley J. (1982) Haematology of conventionally-maintained Lac:P outbred Wistar rats during the 1st year of life. Lab Anim 16:198–200 [DOI] [PubMed] [Google Scholar]
- Bogdanova A, Mihov D, Lutz H, Saam B, Gassmann M, Vogel J. (2007) Enhanced erythro-phagocytosis in polycythemic mice overexpressing erythropoietin. Blood 110:762–769 [DOI] [PubMed] [Google Scholar]
- Casadevall N, Nataf J, Viron B, Kolta A, Kiladjian JJ, Martin-Dupont P, Michaud P, Papo T, Ugo V, Teyssandier I, et al. (2002) Pure red-cell aplasia and antierythropoietin antibodies in patients treated with recombinant erythropoietin. N Engl J Med 346:469–475 [DOI] [PubMed] [Google Scholar]
- Chapel SH, Veng-Pedersen P, Schmidt RL, Widness JA. (2001) Receptor-based model accounts for phlebotomy-induced changes in erythropoietin pharmacokinetics. Exp Hematol 29:425–431 [DOI] [PubMed] [Google Scholar]
- Cheng H, Jusko WJ. (1991) Noncompartmental determination of the mean residence time and steady-state volume of distribution during multiple dosing. J Pharm Sci 80:202–204 [DOI] [PubMed] [Google Scholar]
- D'Argenio DA, Schumitzky A. (1997) ADAPT II User's Guide: Pharmacokinetic/Pharmacodynamic System Analysis Software, Biomedical Simulation Resources, Los Angeles, CA [Google Scholar]
- Dedrick RL. (1973) Animal scale-up. J Pharmacokinet Biopharm 1:435–461 [DOI] [PubMed] [Google Scholar]
- Derelanko MJ. (1987) Determination of erythrocyte life span in F-344, Wistar, and Sprague-Dawley rats using a modification of the [3H]diisopropylfluorophosphate ([3H]DFP) method. Fundam Appl Toxicol 9:271–276 [PubMed] [Google Scholar]
- Dormand JR, Prince PJ. (1980) A family of embedded Runge-Kutta formulae. J Comp Appl Math 6:19–26 [Google Scholar]
- Dornfest BS, Handler ES, Handler EE. (1971) Reticulocyte sequestration in spleens of normal, anaemic and leukaemic rats. Br J Haematol 21:83–94 [DOI] [PubMed] [Google Scholar]
- Egrie J. (1990) The cloning and production of recombinant human erythropoietin. Pharmacotherapy 10:3S–8S [PubMed] [Google Scholar]
- Fisher JW, Nakashima J. (1992) The role of hypoxia in renal production of erythropoietin. Cancer 70:928–939 [PubMed] [Google Scholar]
- Flaharty KK. (1990) Clinical pharmacology of recombinant human erythropoietin (r-HuEPO). Pharmacotherapy 10:9S–14S [PubMed] [Google Scholar]
- Gross AW, Lodish HF. (2006) Cellular trafficking and degradation of erythropoietin and novel erythropoiesis stimulating protein (NESP). J Biol Chem 281:2024–2032 [DOI] [PubMed] [Google Scholar]
- Hazra A, Krzyzanski W, Jusko WJ. (2006) Mathematical assessment of properties of precursor-dependent indirect pharmacodynamic response models. J Pharmacokinet Pharmacodyn 33:683–717 [DOI] [PubMed] [Google Scholar]
- Hodges VM, Rainey S, Lappin TR, Maxwell AP. (2007) Pathophysiology of anemia and erythrocytosis. Crit Rev Oncol Hematol 64:139–158 [DOI] [PubMed] [Google Scholar]
- Kato M, Kamiyama H, Okazaki A, Kumaki K, Kato Y, Sugiyama Y. (1997) Mechanism for the nonlinear pharmacokinetics of erythropoietin in rats. J Pharmacol Exp Ther 283:520–527 [PubMed] [Google Scholar]
- Kientsch-Engel R, Hallermayer K, Dessauer A, Wieczorek L. (1990) New enzyme-linked immunosorbent assay methods for measurement of serum erythropoietin levels and erythropoietin antibodies. Blood Purif 8:255–259 [DOI] [PubMed] [Google Scholar]
- Kojima S, Haruta J, Enomoto A, Fujisawa H, Harada T, Maita K. (1999) Age-related hematological changes in normal F344 rats: during the neonatal period. Exp Anim 48:153–159 [DOI] [PubMed] [Google Scholar]
- Krzyzanski W, Dmochowski J, Matsushima N, Jusko WJ. (2006) Assessment of dosing impact on intra-individual variability in estimation of parameters for basic indirect response models. J Pharmacokinet Pharmacodyn 33:635–655 [DOI] [PubMed] [Google Scholar]
- Krzyzanski W, Jusko WJ, Wacholtz MC, Minton N, Cheung WK. (2005) Pharmacokinetic and pharmacodynamic modeling of recombinant human erythropoietin after multiple subcutaneous doses in healthy subjects. Eur J Pharm Sci 26:295–306 [DOI] [PubMed] [Google Scholar]
- Krzyzanski W, Perez-Ruixo JJ, Vermeulen A. (2008) Basic pharmacodynamic models for agents that alter the lifespan distribution of natural cells. J Pharmacokinet Pharmacodyn 35:349–377 [DOI] [PMC free article] [PubMed] [Google Scholar]
- Lagarias JC, Reed JA, Wright MH, Wright PE. (1998) Convergence properties of the Nelder-Mead simplex method in low dimensions. SIAM J Optim 9:112–147 [Google Scholar]
- Mager DE, Jusko WJ. (2001) General pharmacokinetic model for drugs exhibiting target-mediated drug disposition. J Pharmacokinet Pharmacodyn 28:507–532 [DOI] [PubMed] [Google Scholar]
- Mager DE, Krzyzanski W. (2005) Quasi-equilibrium pharmacokinetic model for drugs exhibiting target-mediated drug disposition. Pharm Res 22:1589–1596 [DOI] [PubMed] [Google Scholar]
- Mager DE, Woo S, Jusko WJ. (2009) Scaling pharmacodynamics from in vitro and preclinical animal studies to humans. Drug Metab Pharmacokinet 24: 16–24 [DOI] [PMC free article] [PubMed] [Google Scholar]
- Mide SM, Huygens P, Bozzini CE, Fernandez Pol JA. (2001) Effects of human recombinant erythropoietin on differentiation and distribution of erythroid progenitor cells on murine medullary and splenic erythropoiesis during hypoxia and post-hypoxia. In Vivo 15:125–132 [PubMed] [Google Scholar]
- Ramakrishnan R, Cheung WK, Farrell F, Joffee L, Jusko WJ. (2003) Pharmacokinetic and pharmacodynamic modeling of recombinant human erythropoietin after intravenous and subcutaneous dose administration in cynomolgus monkeys. J Pharmacol Exp Ther 306:324–331 [DOI] [PubMed] [Google Scholar]
- Ramakrishnan R, Cheung WK, Wacholtz MC, Minton N, Jusko WJ. (2004) Pharmacokinetic and pharmacodynamic modeling of recombinant human erythropoietin after single and multiple doses in healthy volunteers. J Clin Pharmacol 44:991–1002 [DOI] [PubMed] [Google Scholar]
- Sharma A, Ebling WF, Jusko WJ. (1998) Precursor-dependent indirect pharmacodynamic response model for tolerance and rebound phenomena. J Pharm Sci 87:1577–1584 [DOI] [PubMed] [Google Scholar]
- Tillmann HC, Kuhn B, Kränzlin B, Sadick M, Gross J, Gretz N, Pill J. (2006) Efficacy and immunogenicity of novel erythropoietic agents and conventional rhEPO in rats with renal insufficiency. Kidney Int 69:60–67 [DOI] [PubMed] [Google Scholar]
- Trial J, Rice L. (2004) Erythropoietin withdrawal leads to the destruction of young red cells at the endothelial-macrophage interface. Curr Pharm Des 10:183–190 [DOI] [PubMed] [Google Scholar]
- Veng-Pedersen P, Chapel S, Al-Huniti NH, Schmidt RL, Sedars EM, Hohl RJ, Widness JA. (2004) Pharmacokinetic tracer kinetics analysis of changes in erythropoietin receptor population in phlebotomy-induced anemia and bone marrow ablation. Biopharm Drug Dispos 25:149–156 [DOI] [PubMed] [Google Scholar]
- Verdier F, Walrafen P, Hubert N, Chretien S, Gisselbrecht S, Lacombe C, Mayeux P. (2000) Proteasomes regulate the duration of erythropoietin receptor activation by controlling down-regulation of cell surface receptors. J Biol Chem 275:18375–18381 [DOI] [PubMed] [Google Scholar]
- Walrafen P, Verdier F, Kadri Z, Chrétien S, Lacombe C, Mayeux P. (2005) Both proteasomes and lysosomes degrade the activated erythropoietin receptor. Blood 105:600–608 [DOI] [PubMed] [Google Scholar]
- Wiczling P, Krzyzanski W. (2007) Method of determination of the reticulocyte age distribution from flow cytometry count by a structured-population model. Cytometry A 71:460–467 [DOI] [PubMed] [Google Scholar]
- Wiczling P, Lowe P, Pigeolet E, Lüdicke F, Balser S, Krzyzanski W. (2009) Population pharmacokinetic modelling of filgrastim in healthy adults following intravenous and subcutaneous administrations. Clin Pharmacokinet 48:817–826 [DOI] [PubMed] [Google Scholar]
- Wintrobe MM. (2003) Wintrobe Clinical Hematology, Lippincott Williams & Wilkins, Philadelphia [Google Scholar]
- Wojchowski DM, Caslake L. (1989) Biotinylated recombinant human erythropoietins: bioactivity and utility as receptor ligand. Blood 74:952–958 [PubMed] [Google Scholar]
- Woo S, Jusko WJ. (2007) Interspecies comparisons of pharmacokinetics and pharmacodynamics of recombinant human erythropoietin. Drug Metab Dispos 35:1672–1678 [DOI] [PubMed] [Google Scholar]
- Woo S, Krzyzanski W, Duliege AM, Stead RB, Jusko WJ. (2008) Population pharmacokinetics and pharmacodynamics of peptidic erythropoiesis receptor agonist (ERA) in healthy volunteers. J Clin Pharmacol 48:43–52 [DOI] [PubMed] [Google Scholar]
- Woo S, Krzyzanski W, Jusko WJ. (2006) Pharmacokinetic and pharmacodynamic modeling of recombinant human erythropoietin after intravenous and subcutaneous administration in rats. J Pharmacol Exp Ther 319:1297–1306 [DOI] [PubMed] [Google Scholar]
- Woo S, Krzyzanski W, Jusko WJ. (2007) Target-mediated pharmacokinetic and pharmacodynamic model of recombinant human erythropoietin (rHuEPO). J Pharmacokinet Pharmacodyn 34:849–868 [DOI] [PubMed] [Google Scholar]


