

Abstract
Background
The goal of this study was to determine the nature and prevalence of abnormalities in lipids, glucose metabolism, and body composition in behaviorally HIV-infected young women and their relationship to different classes of antiretroviral therapy (ART) regimens.
Methods
We conducted a cross-sectional multicenter study in behaviorally infected women ages 12-24 years (HIVpos; N=173) and seronegative controls (HIVneg; N=61). HIVpos women were categorized as ART-naïve (N=85), on a non-nucleoside reverse transcriptase inhibitor-containing regimen (NNRTI; N=33), on a protease inhibitor-containing regimen (PI; N=36), or on a non-NNRTI/non-PI containing regimen (N=19). Measurements included fasting lipids; glucose and insulin before and 2 hours after an oral glucose challenge; high-sensitivity C-reactive protein (hsCRP); anthropometry; fat distribution (dual energy X-ray absorptiometry); and ART and medical histories. Race-adjusted results were compared across groups and within HIVpos groups.
Results
The median age was 20 (range 14-24) years. 77% of HIVpos were African American, 35% smoked cigarettes, and 32% reported exercising regularly. More than 40% had a BMI ≥25 kg/m2. Triglycerides; total, HDL, and non-HDL cholesterol; and hsCRP differed significantly among groups, with higher levels most common among those on ART. Indices of glucose metabolism did not differ among groups. In general, cholesterol, hsCRP, and indices of glucose metabolism worsened as BMI increased.
Conclusions
Obesity, dyslipidemia, and inflammation were prominent in HIV-infected adolescent women and, coupled with other risk factors, may accelerate the lifetime risk of cardiovascular disease and other adverse events. These results underscore the need for a multifaceted approach to addressing risk reduction in this population.
Keywords: adolescent, women, obesity, dyslipidemia, inflammation
Summary.
Obesity, dyslipidemia, and inflammation were prominent in HIV-infected adolescent women. Coupled with inactivity, cigarette smoking, and family histories of type 2 diabetes and cardiovascular disease, these factors may accelerate the lifetime risk of cardiovascular disease and other adverse events.
BACKGROUND
The HIV epidemic in the United States among adolescents and young adults remains unabated with an estimated 20,000 new infections annually [1]. Indeed, 34% of incident infections in the U.S. in 2006 are estimated to have occurred among 13-29 year olds [1]. These new behaviorally acquired infections occur disproportionately among ethnic and racial minorities, and in the younger age groups infections in females now outnumber males [2].
The prevalence of obesity is also increasing among adolescents in the U.S. [3], particularly among young women and in racial and ethnic minorities [4]. Obesity contributes to diabetes, dyslipidemia, hypertension, inflammation, kidney disease, and other comorbidities that cumulatively are associated with increased risk of cardiovascular disease (CVD) and other disorders [5-7]. Moreover, minority youth may have a genetic predisposition to insulin resistance, which, in the presence of environmental modulators, could exacerbate their risk of diabetes and result in disease expression during physiologic (puberty) or pathologic (obesity) states of insulin resistance [8]. Thus, there is an intersection between the HIV epidemic in young women and the emerging problems associated with obesity in this age group [9,10].
Both HIV infection and its therapies are known to contribute to metabolic and morphologic alterations that may increase risk of CVD, including dyslipidemia, altered glucose metabolism, central fat accumulation, and inflammation (as reviewed in [11]). All three major classes of antiretroviral therapy (ART), including protease inhibitors (PI), nucleoside reverse transcriptase inhibitors (NRTI), and non-nucleoside reverse transcriptase inhibitors (NNRTI), have been implicated in these complications, with the nature and magnitude of effects differing among drugs in a given class [11]. The extent to which metabolic abnormalities in adolescents are related to HIV infection per se, specific antiretroviral regimens, obesity, puberty, or background risks associated with race, ethnicity, and lifestyle is unknown. This study was designed to determine the nature and prevalence of abnormalities in glucose metabolism, lipids, and body composition in HIV-infected and HIV-uninfected female adolescents and young adults and examine their relationship to different classes of ART regimens.
METHODS
HIV-positive young women (HIVpos; N=173), ages 14-24 years, were recruited consecutively for this cross-sectional study between December 2003 and August 2005 at 17 clinical sites on behalf of the Adolescent Medicine Trials Network for HIV/AIDS Interventions (ATN). Participants were grouped as follows: antiretroviral naïve (ART-naïve; N=85); on an ART regimen that contained an NNRTI but no PI for ≥3 months (NNRTI; N=33); on an ART regimen that included a PI but no NNRTI for ≥3 months (PI; N=36); and on a non-PI/non-NNRTI containing regimen for ≥3 months (non-NNRTI/non-PI; N=19). A seronegative control group (HIVneg; N=61) was recruited at the same clinical sites. Recruitment of HIVneg subjects was initiated after the first 65 HIVpos subjects had been enrolled to assure comparability in age between the two groups. Sites were encouraged to recruit subjects from the same racial and demographic backgrounds as the HIVpos subjects.
All participants were required to be classified as Tanner 4 or 5, have a negative pregnancy test at the time of study unless surgically sterilized, and have accessible medical history. Exclusion criteria included pregnancy in the past year, type 1 diabetes mellitus, or history of anorexia or bulimia. The institutional review board at each site approved the study, and appropriate written informed consent was obtained before enrollment.
Assessments
Fasting (≥8 hours) blood samples were collected for determination of lipids, glucose, insulin, C-peptide, pro-insulin, and high-sensitivity C-reactive protein (hsCRP). Participants then consumed a 75-g oral glucose load, and samples were collected after 2 hours (2-h) for measurement of glucose, insulin, C-peptide, and pro-insulin. Height, weight, and waist circumferences were measured following standard protocols. Study personnel at each site underwent centralized training to standardize the anthropometric measurements. Body mass index (BMI) was categorized according to WHO criteria [12]. Whole-body dual energy X-ray absorptiometry (DXA) scanning was performed to measure total lean body mass (LBM) and fat, as well as regional fat distribution. All scans underwent central analysis at Tufts University by a reader who was blinded to HIV status or ART regimen. A standard phantom was scanned on each DXA instrument used in the study. All scans at a given clinical site were performed on the same DXA instrument.
All participants underwent detailed medical histories. Participants also completed food frequency (Block Dietary Systems, NutritionQuest, Berkeley, CA) and body image questionnaires that included questions about exercise, smoking, and alcohol use.
Laboratory Analyses
Samples were processed locally and then stored at −70°C in a central repository. Upon completion of the study, samples were analyzed at Quest Diagnostics, Baltimore, MD, and Quest Diagnostics Nichols Institute, Chantilly, VA. Total and HDL cholesterol (HDL-C) and triglycerides were measured by enzymatic techniques and LDL cholesterol (LDL-C) calculated in those with triglyceride levels <400 mg/dL [13]. Specimens for glucose were collected on sodium fluoride/potassium oxalate and measured by the hexokinase technique. Serum insulin, C-peptide, and pro-insulin were measured by immunoassay. The homeostasis model of insulin resistance (HOMA-IR) was calculated from fasting insulin and glucose [14]. hsCRP was measured by a particle-enhanced immunonephelometric assay. HIV-1 RNA levels (Roche Amplicor v1.5 assay, detection limit 400 copies/mL) and CD4 T-cell counts were measured locally at each site.
Statistical Analyses
Simple univariate statistics (frequency, percent, median, range) were used to describe characteristics of the study population according to HIV infection status and, among HIVpos, ART regimen. Statistical testing for differences in characteristics among groups was based on chi-square and Fisher's exact test for categorical measures and nonparametric testing (Kruskal-Wallis test) for continuous measures. Model-based estimates of race-adjusted means and standard errors for the metabolic and morphologic outcomes are reported. The effects of HIV infection per se and type of ART regimen on continuous-scaled outcomes was assessed using linear regression. When significant differences among groups were observed overall, pairwise comparisons were performed (between each HIV treatment group and HIVneg and/or between each HIVpos group receiving ART compared to HIVpos, ART-naïve participants). Linear regression was also used to explore the relationship of BMI with the metabolic outcomes in the group as a whole, adjusting for race and HIV status.
All analyses were performed using the SAS Software System, Version 8.0. An alpha of 0.05 or less indicated statistical significance. There were few missing values, so no imputation was performed, nor were adjustments made for multiple comparisons.
RESULTS
Demographic Characteristics
The median age was 20 years in both HIVpos and HIVneg (Table 1). The HIVpos group included a higher proportion of African Americans. More than half of the HIVpos women had had at least one pregnancy (P=0.04 vs. HIVneg). More than 60% of participants reported alcohol use. A greater proportion of HIVpos reported drug use, predominantly marijuana. Cigarette smoking was reported by about one-third of women in both groups. Approximately one-third of HIVpos women reported exercising regularly (P=0.005 vs. HIVneg). Family histories of type 2 diabetes and CVD were reported in approximately 40% and 30% of participants, respectively; neither differed significantly between groups.
Table 1.
Demographic Characteristics
| Characteristic | HIV-negative (n = 61) | HIV-positive (n = 173) | p-valuea |
|---|---|---|---|
| Age (years): Median [range] | 20 [15 - 24] | 20 [14 - 24] | 0.15 |
| Race: n (%) | |||
| Black/African American | 34 (55.7) | 133 (76.9) | 0.005 |
| White | 11 (18.0) | 13 (7.5) | |
| Other/Mixed/Asian/Pacific Islanders | 16 (26.2) | 27 (15.6) | |
| Hispanic ethnicity: n (%) | 17 (27.9) | 30 (17.3) | 0.08 |
| Ever pregnant: n (%) | 22 (36.1) | 89 (51.4) | 0.04 |
| Number of pregnancies: n (%) | |||
| 0 | 39 (63.9) | 84 (48.6) | 0.09 |
| 1 | 15 (24.6) | 52 (30.1) | |
| 2-5 | 7 (11.5) | 37 (21.4) | |
| Number of full-term births: n (%) | |||
| 0 | 11 (50.0) | 33 (37.5) | 0.30 |
| 1 | 10 (45.5) | 36 (40.9) | |
| 2 | 1 (4.5) | 14 (15.9) | |
| 3 | 0 (0.0) | 5 (5.7) | |
| Drink alcohol: n (%) | 41 (67.2) | 106 (61.3) | 0.41 |
| Ever or currently using drugs: n (%) | 22 (36.1) | 102 (59.0) | 0.002 |
| Ever used cocaine | 5 (8.2) | 16 (9.2) | 0.80 |
| Ever used marijuana/hash/THC | 22 (36.1) | 102 (59.0) | 0.002 |
| Currently smoke cigarettes: n (%) | 21 (34.4) | 60 (34.7) | 0.97 |
| Exercise regularly: n (%) | 32 (52.5) | 56 (32.4) | 0.005 |
| Family history of type I diabetes: n (%) | 14 (24.1) | 34 (21.1) | 0.63 |
| Family history of type II diabetes: n (%) | 24 (41.4) | 70 (44.3) | 0.70 |
| Family history of lipid disorders: n (%) | 15 (25.9) | 38 (26.6) | 0.92 |
| Family history of coronary heart disease: n (%) | 18 (32.1) | 58 (37.7) | 0.46 |
With the exception of age, p-values were obtained from chi-square analysis; for age the p-value was obtained from the Student's t-test.
HIV Disease-Related Data
Among the HIVpos groups, the median time since HIV diagnosis ranged from 0.9 years in ART-naïve to 3.9 years in PI (Table 2). Current CD4 count did not differ among groups; among those on ART, nadir CD4 and current HIV RNA were significantly lower, and peak HIV RNA levels were significantly higher than their untreated counterparts. With regard to CDC staging, the ART-naïve group had a greater proportion of participants classified in group A/none and a smaller proportion in group C. The predominant NRTIs used in each group on ART were zidovudine and lamivudine. Current or prior use of stavudine and/or didanosine was low to minimal. Approximately half of participants in the NNRTI group were on nevirapine and the other half on efavirenz. Among participants in the PI group, 58% were on nelfinavir, 42% on a ritonavir-containing regimen (either lopinavir/r or other ritonavir), and 19% on atazanavir. All but one participant in the non-NNRTI/non-PI group was on abacavir.
Table 2.
HIV Disease Characteristics
| Type of Antiretroviral Regimen |
|||||
|---|---|---|---|---|---|
| HIV disease characteristic | ART naïve (n=85) | NNRTI containing regimen (n=33) | PI containing regimen (n=36) | Non-NNRTI/non-PI containing regimen (n=19) | p-valuea |
| Years since HIV diagnosis: Median [Range] | 0.9 [0.1 - 10.6] | 2.6 [0.3 - 12.2] | 3.9 [0.4 - 10.2] | 2.8 [0.1 - 7.7] | <0.0001 |
| Current CD4 count (cells/μL): Median [Range] | 499 [64 – 1,374] | 485 [25 – 1,424] | 469 [56 – 3,011] | 487 [13 – 1,730] | 0.99 |
| Nadir CD4 count (cells/μL): Median [Range] | 450 [16 – 1,012] | 247 [2 - 740] | 250 [0 – 1,366] | 272 [0 - 858] | <0.0001 |
| Current CD4 percent: Median [Range] | 28.0 [5.7 – 50.0] | 29.6 [4.2 – 49.0] | 26.0 [6.0 – 59.0] | 31.0 [1.0 – 48.0] | 0.84 |
| Nadir CD4 percent: Median [Range] | 24.3 [1.0 – 45.1] | 17.9 [2.0 – 37.0] | 18.5 0.0 – 50.0] | 21.0 [0.0 – 39.0] | 0.0003 |
| Current HIV RNA (copies/mL) Median [Range] | 6,066 [<400-652,000] | <400 [<400-57,386] | <400 [<400-404,926] | <400 [<400-95,095] | <0.0001 |
| Current HIV RNA (copies/mL): n (%) | |||||
| ≤400 | 13 (15.3) | 26 (78.8) | 24 (66.7) | 11 (63.2) | <0.0001 |
| 401-2,000 | 18 (21.2) | 2 (6.1) | 0 (0.0) | 1 (5.3) | |
| 2,001-10,000 | 19 (22.4) | 1 (3.0) | 6 (13.7) | 1 (5.3) | |
| 10,000-40,000 | 22 (25.9) | 3 (9.1) | 2 (5.6) | 2 (10.5) | |
| >40,000 | 13 (15.3) | 1 (3.0) | 3 (8.3) | 2 (10.5) | |
| Peak HIV RNA (copies/mL): Median [Range] | 13,399 [25-750,000] | 44,600 [25-567,000] | 72,754 [75-2,947,581] | 35,343 [25-476,330] | 0.007 |
| CDC Stage: n (%) | |||||
| A/none | 62 (72.9) | 17 (51.5) | 17 (47.2) | 8 (42.1) | <0.0001 |
| B | 16 (18.8) | 3 (9.1) | 5 (13.9) | 2 (10.5) | |
| C | 7 (8.2) | 13 (39.4) | 14 (38.9) | 9 (47.4) | |
| Currently receiving any NRTIs: n (%) | NA | 33 (100.0) | 36 (100.0) | 19 (100.0) | |
| Zidovudine | NA | 24 (72.7) | 26 (72.2) | 19 (100.0) | |
| Lamivudine | NA | 31 (93.9) | 33 (91.7) | 18 (94.7) | |
| Stavudine | NA | 2 (6.1) | 3 (8.3) | 0 (0.0) | |
| Didanosine | NA | 5 (15.2) | 3 (8.3) | 0 (0.0) | |
| Abacavir | NA | 1 (3.0) | 2 (5.6) | 18 (94.7) | |
| Tenofovir | NA | 4 (12.1) | 6 (16.7) | 2 (10.5) | |
| Currently receiving any NNRTIs: n (%) | NA | 33 (100.0) | NA | NA | |
| Efavirenz | NA | 16 (48.5) | NA | NA | |
| Nevirapine | NA | 17 (51.5) | NA | NA | |
| Currently receiving any PIs: n (%) | NA | NA | 36 (100.0) | NA | |
| Nelfinavir | NA | NA | 21 (58.3) | NA | |
| Lopinavir/r | NA | NA | 9 (25.0) | NA | |
| Other ritonavirb | NA | NA | 6 (16.7) | NA | |
| Atazanavirc | NA | NA | 7 (19.4) | NA | |
P-values for comparison of categorical measures among HIV positive subjects were obtained from chi-square analysis and for continuous measures from nonparametric testing (Kruskal-Wallis test). Distribution of antiretroviral use is included for descriptive purposes and did not undergo statistical analysis.
Includes subjects on therapeutic or boosting doses of ritonavir who are not using lopinavir
Includes subjects on boosted and unboosted atazanavir-containing regimens
NA: not applicable
Anthropometry and Body Composition
Average BMI, height, and weight did not differ among groups (Table 3). More than 40% in each group had a BMI that was classified as overweight or obese (≥25 kg/m2). There were no significant differences in race-adjusted waist or hip circumferences. Waist/hip ratio differed significantly among groups and was significantly higher in the non-NNRTI/non-PI group compared to both HIVneg and ART-naïve, reflecting the lower hip circumference in the former. There were no significant differences in total LBM or fat distribution. Total body fat averaged >30% in each group and did not differ significantly by HIV or treatment status. There were no significant differences among groups in energy or macronutrient intake (data not shown).
Table 3.
Metabolic and Morphologic Data
| HIV-Positive Subjects According to Type of ART Regimen |
|||||||
|---|---|---|---|---|---|---|---|
| NNRTI containing regimen (n=33) | PI containing regimen (n=36) | Non-NNRTI/non-PI containing regimen (n=19) |
p-valuea |
||||
| HIV-negative (n=61) | ART naïve (n=85) | Overall (n=234) | HIV+ only (N=173) | ||||
| Anthropometric Measurements: | |||||||
| BMI distribution: | n (%) | n (%) | n (%) | n (%) | n (%) | ||
| Underweight (<18.5) | 5 (8.2) | 4 (4.7) | 1 (3.0) | 1 (2.8) | 1 (5.3) | 0.96 | 0.99 |
| Normal (18.5-24.9) | 29 (47.5) | 40 (47.1) | 12 (36.4) | 15 (41.7) | 9 (47.4) | ||
| Overweight (25.0-29.9) | 11 (18.0) | 16 (18.8) | 6 (18.2) | 7 (19.4) | 4 (21.1) | ||
| Obese (≥30) | 16 (26.2) | 25 (29.4) | 14 (42.4) | 13 (36.1) | 5 (26.3) | ||
| Mean (SE) | Mean (SE) | Mean (SE) | Mean (SE) | Mean (SE) | |||
| BMI (kg/m2) | 26.5 ± 1.0 | 27.5 ± 0.8 | 29.0 ± 1.3 | 28.0 ± 1.3 | 27.0 ± 1.7 | 0.62 | 0.72 |
| Height (cm) | 162.8 ± 1.0 | 162.1 ± 0.8 | 162.7 ± 1.3 | 162.9 ± 1.2 | 162.2 ± 1.7 | 0.97 | 0.94 |
| Weight (kg) | 70.4 ± 2.8 | 72.5 ± 2.4 | 77.5 ± 3.8 | 74.4 ± 3.6 | 71.1 ± 5.0 | 0.64 | 0.66 |
| Waist circumference (cm) | 83.9 ± 2.2 | 85.8 ± 1.8 | 91.1 ± 2.9 | 90.9 ± 2.8 | 87.7 ± 3.8 | 0.17 | 0.30 |
| Hip circumference (cm) | 103.2 ± 2.1 | 102.6 ± 1.7 | 106.0 ± 2.8 | 105.2 ± 2.6 | 101.7 ± 3.6 | 0.79 | 0.63 |
| Waist-to-hip ratio | 0.81 ± 0.02 | 0.83 ± 0.01 | 0.86 ± 0.02 | 0.86 ± 0.02 | 0.92 ± 0.03* | 0.02 | 0.11 |
| DXA Measurements: | |||||||
| Total body mass (kg/m) | 42.8 ± 1.5 | 43.5 ± 1.3 | 45.7 ± 2.2 | 45.0 ± 2.1 | 43.3 ± 3.0 | 0.81 | 0.77 |
| Total lean body mass (kg/m) | 25.2 ± 0.5 | 25.6 ± 0.4 | 27.0 ± 0.7 | 26.1 ± 0.7 | 26.5 ± 1.0 | 0.35 | 0.41 |
| Total body fat (kg/m) | 16.1 ± 1.1 | 16.4 ± 1.0 | 17.2 ± 1.6 | 17.5 ± 1.5 | 15.3 ± 2.2 | 0.90 | 0.79 |
| Total body fat (%) | 35.5 ± 1.3 | 35.0 ± 1.1 | 35.9 ± 1.9 | 37.0 ± 1.8 | 33.8 ± 2.5 | 0.86 | 0.69 |
| Mean (SE) | Mean (SE) | Mean (SE) | Mean (SE) | Mean (SE) | |||
| Trunk fat (kg/m) | 7.3 ± 0.6 | 7.4 ± 0.5 | 7.9 ± 0.8 | 8.2 ± 0.8 | 7.3 ± 1.1 | 0.88 | 0.78 |
| Arm fat (kg/m) | 1.6 ± 0.1 | 1.6 ± 0.1 | 1.7 ± 0.2 | 1.7 ± 0.2 | 1.6 ± 0.2 | 0.98 | 0.98 |
| Leg fat (kg/m) | 6.7 ± 0.5 | 6.7 ± 0.4 | 6.9 ± 0.7 | 7.1 ± 0.6 | 5.8 ± 0.9 | 0.84 | 0.67 |
| Metabolic Measurements: b | |||||||
| Triglycerides (mg/dL) | 65.0 ± 6.9 | 84.2 ± 5.8* | 126.2 ± 9.2*† | 106.7 ± 8.8* | 102.6 ± 12.2* | <0.0001 | 0.008 |
| Total cholesterol (mg/dL) | 154.4 ± 4.0 | 152.3 ± 3.4 | 167.8 ± 5.4*† | 173.3 ± 5.1*† | 148.7 ± 7.1 | 0.002 | 0.003 |
| HDL cholesterol (mg/dL) | 48.5 ± 1.6 | 40.5 ± 1.3* | 43.3 ± 2.1 | 46.1 ± 2.0 | 38.8 ± 2.8* | 0.001 | 0.10 |
| LDL cholesterol (mg/dL) | 93.0 ± 3.6 | 95.1 ± 3.0 | 96.3 ± 4.9 | 105.9 ± 4.6 | 89.5 ± 6.3 | 0.16 | 0.14 |
| Non-HDL cholesterol (mg/dL) | 106.0 ± 4.2 | 111.9 ± 3.5 | 124.5 ± 5.6* | 127.2 ± 5.3* | 109.9 ± 7.4 | 0.008 | 0.06 |
| Glucose (mg/dL) | 88.4 ± 1.0 | 85.4 ± 0.8 | 87.9 ± 1.3 | 86.5 ± 1.2 | 87.4 ± 1.7 | 0.17 | 0.35 |
| 2-h glucose (mg/dL) | 92.2 ± 3.1 | 93.1 ± 2.6 | 93.8 ± 4.2 | 98.3 ± 4.0 | 105.6 ± 5.4 | 0.21 | 0.23 |
| Insulin (μIU/mL; log10)c | 1.01 ± 0.04 | 1.02 ± 0.03 | 1.04 ± 0.05 | 0.98 ± 0.05 | 1.10 ± 0.07 | 0.74 | 0.54 |
| 2-h insulin (μIU/mL; log10)c | 1.68 ± 0.05 | 1.68 ± 0.04 | 1.60 ± 0.07 | 1.68 ± 0.06 | 1.70 ± 0.09 | 0.84 | 0.72 |
| Pro-insulin (pmol/L) | 12.9 ± 1.4 | 11.6 ± 1.2 | 14.3 ± 1.9 | 13.3 ± 1.8 | 18.8 ± 2.5 | 0.14 | 0.12 |
| 2-h pro-insulin (pmol/L) | 51.5 ± 5.6 | 47.0 ± 4.7 | 50.5 ± 7.5 | 50.0 ± 7.1 | 52.9 ± 10.0 | 0.97 | 0.96 |
| Mean (SE) | Mean (SE) | Mean (SE) | Mean (SE) | Mean (SE) | |||
| C-peptide (ng/dL) | 2.7 ± 0.2 | 2.7 ± 0.1 | 2.9 ± 0.2 | 2.8 ± 0.2 | 3.3 ± 0.3 | 0.53 | 0.41 |
| 2-h C-peptide (ng/dL) | 7.2 ± 0.4 | 7.2 ± 0.4 | 7.6 ± 0.6 | 7.2 ± 0.6 | 7.2 ± 0.8 | 0.99 | 0.97 |
| Log10 HOMA-IRc | 0.35 ± 0.04 | 0.34 ± 0.04 | 0.37 ± 0.06 | 0.31 ± 0.06 | 0.44 ± 0.08 | 0.74 | 0.53 |
| HS-C-reactive protein (mg/L) | 2.2 ± 0.8 | 2.9 ± 0.7 | 5.7 ± 1.1*† | 3.8 ± 1.1 | 7.5 ± 1.5*† | 0.006 | 0.04 |
Description of metabolic and morphologic characteristics of the study population according to HIV status and type of antiretroviral therapy (ART) regimen currently receiving, based on race-adjusted analyses.
P-values for categorical measures were obtained from the Fisher's Exact test and for continuous measures from linear regression modeling.
Fasting unless otherwise noted
Log-transformed results are reported for fasting and 2-h insulin and HOMA-IR because the distributions were skewed
P<0.05 using HIV-negative subjects as the comparison group
P<0.05 using HIV-infected, ART naïve subjects as the comparison group
DXA: dual-energy X-ray absorptiometry
HOMA-IR: Homeostasis model of insulin resistance [14]
Metabolic Outcomes
Fasting triglyceride and total cholesterol levels differed significantly among all groups and among HIVpos groups (Table 3). In pairwise comparisons, triglyceride levels were significantly higher in all HIVpos groups compared with HIVneg and significantly higher in NNRTI than ART-naïve. Total cholesterol was higher in NNRTI and PI, compared with both HIVneg and ART-naïve. HDL-C differed significantly among groups overall. In pairwise comparisons, HDL-C was significantly lower in ART-naïve and non-NNRTI/non-PI than HIVneg. LDL-C did not differ significantly among groups. Non HDL-C was significantly higher in NNRTI and PI compared with HIVneg.
There were no significant differences among groups in fasting or 2-h glucose, insulin, pro-insulin, C-peptide, or HOMA-IR (Table 3). hsCRP differed significantly among all groups and among HIVpos groups, with significantly higher levels in NNRTI and non-NNRTI/non-PI, compared to HIVneg and ART-naïve.
Using published classification criteria [15-17] and laboratory reference ranges, we examined the prevalence of abnormal values for lipids and hsCRP (Fig. 1). Among ART-naïve, 29% of participants had low HDL-C; abnormal lipid values were more frequently observed among the groups receiving NNRTI and PI containing regimens, whereas low HDL-C was the only major abnormality in the non-NNRTI/non-PI group. Approximately 40% of all three groups on ART had hsCRP levels that were above the upper limit of normal for the assay used (>3 mg/L). In contrast, glucose abnormalities (impaired fasting glucose, impaired glucose tolerance, or diabetes) were relatively infrequent (data not shown).
Figure 1.
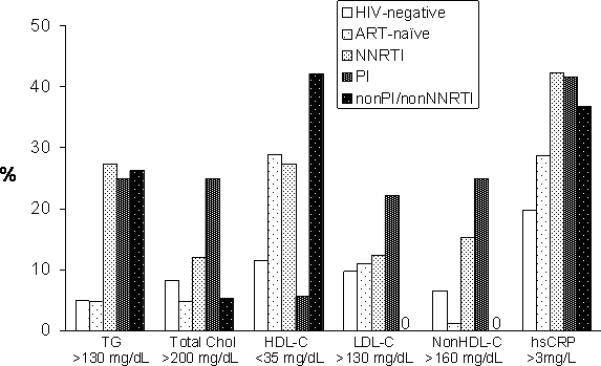
Proportion of participants in each group with abnormal values for lipids and hsCRP, based on published classification criteria [15-17] and laboratory reference ranges.
Association of Metabolic Outcomes with Body Mass Index
In contrast to the comparisons among treatment groups, values for fasting and 2-h glucose, insulin, pro-insulin, and C-peptide, as well as HOMA-IR, differed significantly among BMI categories, generally increasing with increasing BMI (Table 4). All values for cholesterol and hsCRP also differed significantly among BMI categories. In general, participants classified as overweight or obese had values that were higher than those among normal or underweight participants. Values for HDL-C decreased with increasing BMI category. Triglycerides did not differ among BMI categories.
Table 4.
Association of Metabolic Outcomes with Body Mass Index
| Metabolic outcomea | Underweight & Normal weight (BMI <25.0 kg/m2) [N = 117] | Overweight (BMI 25.0 – 29.9 kg/m2) [N = 44] | Obese (BMI ≥30.0 kg/m2) [N = 73] | p-valueb |
|---|---|---|---|---|
| Mean (SE) | Mean (SE) | Mean (SE) | ||
| Glucose (mg/dL) | 85.0 ± 0.7 | 87.8 ± 1.1 | 89.2 ± 0.9 | 0.0007 |
| 2-h glucose (mg/dL) | 90.3 ± 2.2 | 96.9 ± 3.6 | 100.7 ± 2.8 | 0.01 |
| Insulin (μIU/mL; log10)c | 0.90 ± 0.03 | 1.10 ± 0.04 | 1.17 ± 0.03 | <0.0001 |
| 2-h insulin (μIU/mL; log10)c | 1.60 ± 0.03 | 1.69 ± 0.06 | 1.78 ± 0.04 | 0.007 |
| Pro-insulin (pmol/L) | 10.9 ± 1.0 | 13.2 ± 1.6 | 16.8 ± 1.3 | 0.002 |
| 2-h pro-insulin (pmol/L) | 44.9 ± 4.0 | 41.7 ± 6.4 | 61.7 ± 4.9 | 0.01 |
| C-peptide (ng/dL) | 2.4 ± 0.1 | 3.0 ± 0.2 | 3.3 ± 0.1 | <0.0001 |
| 2-h C-peptide (ng/dL) | 6.7 ± 0.3 | 7.0 ± 0.5 | 8.3 ± 0.4 | 0.004 |
| HOMA-IR (log10)c | 0.22 ± 0.08 | 0.43 ± 0.05 | 0.52 ± 0.04 | <0.0001 |
| Total cholesterol (mg/dL) | 152.0 ± 2.9 | 170.4 ± 4.7 | 160.0 ± 3.7 | 0.004 |
| HDL cholesterol (mg/dL) | 46.0 ± 1.1 | 41.7 ± 1.8 | 41.2 ± 1.4 | 0.02 |
| LDL cholesterol (mg/dL) | 89.5 ± 2.5 | 106.3 ± 4.1 | 100.1 ± 3.2 | 0.001 |
| Non-HDL cholesterol (mg/dL) | 106.1 ± 2.9 | 128.7 ± 4.8 | 118.8 ± 3.7 | 0.0001 |
| Triglycerides (mg/dL) | 83.0 ± 5.1 | 102.3 ± 8.2 | 94.7 ± 6.3 | 0.10 |
| hsCRP (mg/L) | 2.6 ± 0.6 | 2.6 ± 0.9 | 5.8 ± 0.7 | 0.002 |
Fasting unless otherwise noted
Least-squares estimated means, their standard errors (SE) and p-values obtained from linear regression modeling, adjusting for race and HIV status.
Log-transformed results are reported for fasting and 2-h insulin and HOMA-IR because the distributions were skewed
DISCUSSION
In this survey of behaviorally HIV-infected young women, overweight/obesity, dyslipidemia, and inflammation were prominent. More than one-third of the HIVpos participants reported a family history of heart disease or type 2 diabetes, more than one-third smoked cigarettes, and less than one-third exercised regularly. Given the known associations of each of these metabolic, genetic, and lifestyle factors with CVD [6], recent evidence linking hsCRP to increased risk of death in patients with HIV infection [18], and the likelihood of life-long exposure to ART, this population of young women may be at particularly high risk of CVD and other adverse events.
In the U.S., the prevalence of overweight/obesity is increasing across all age groups, particularly among Hispanic and African-American women [4]. Studies in non-HIV-infected children and adolescents have demonstrated significant associations between obesity and dyslipidemia, alterations in glucose metabolism, and elevations in systolic blood pressure [8,19,20]. Although CVD has not been studied extensively in children, children and adolescents in the U.S. have higher levels of cholesterol than their counterparts in other countries; autopsy findings show evidence of atherosclerosis that correlate with dyslipidemia; and dyslipidemic children are likely to become dyslipidemic adults [16]. Moreover, the risk of CVD is particular high among racial/ethnic minorities (e.g.[20]). Among HIV-infected adults, studies have demonstrated increased incidence of coronary artery disease and cardiovascular events [21,22], with the risk increasing with increased duration of ART [23].
The prevalence of overweight/obesity in the current study is comparable to that reported previously in the Women's Interagency HIV Study (WIHS) [24,25], which also includes a high proportion of participants representing racial and ethnic minorities. However, in contrast to the WIHS, we found no differences in fat distribution by DXA, presumably reflecting the relatively lower duration of HIV infection and exposure to ART in our population. Overall, the major impact of body habitus on our findings appears to be consistent with conventional obesity, rather than altered fat distribution associated with HIV infection or ART.
Inflammation, as evidenced by increases in hsCRP, is an independent risk factor for CVD in HIV-uninfected [26] and infected [27] populations. Studies in non-HIV-infected adults [28] and youth [29,30] have demonstrated relationships between CRP and features of the metabolic syndrome and markers of oxidative stress. A recent study found that non-obese HIV-infected adults had hsCRP levels comparable to those seen in obese seronegative participants [31]. In the current study, hsCRP exceeded the upper limit of normal in approximately 40% of HIVpos participants on ART, among whom more advanced HIV disease was more common, and was higher in participants classified as obese. These results suggest that both HIV disease and obesity may have contributed to elevations in hsCRP.
There were no significant differences among groups in fasting or 2-h glucose or insulin or HOMA-IR, consistent with results reported previously in the WIHS, which included a high prevalence of overweight/obese participants [32]. However, when we compared our results across BMI categories, we saw highly significant differences, with all indices of glucose metabolism worsening as BMI increased. Thus, it appears that among overweight HIV-positive adolescent and adult women in the U.S., obesity has a greater influence on glucose metabolism than HIV infection or ART. In contrast, our data suggest that body habitus, HIV infection, and ART all play a role in dyslipidemia.
A unique feature of this study is the inclusion of an ART-naïve seropositive group, which provides the opportunity to explore the impact of both HIV infection and ART on metabolic and morphologic outcomes. Although the median duration of known HIV infection in this group was shorter than in the groups on ART, triglyceride levels were significantly higher and HDL-C significantly lower in the ART-naïve participants compared to seronegative controls. Reductions in HDL-C are a recognized effect of untreated HIV infection. However, studies performed before the HAART era suggested that triglycerides were increased only in patients with more advanced HIV disease [33]. Thus, the finding that triglycerides were significantly higher in this group of relatively recently infected young women is novel.
Fewer than one-third of the HIVpos participants exercised regularly, more than one-third already smoked cigarettes, and more than 40% were overweight or obese. Innovative approaches to motivating youth to modify current behaviors are clearly needed. Girls, older adolescents, minorities, and those of lower socioeconomic status are least likely to meet current guidelines for physical activity [34]. Sedentary behavior and TV viewing are independently related to overweight and biomarkers of cardiovascular risk [35,36], and thus are potential targets for intervention. Although dietary interventions are particularly challenging in this population that does not always have control over meal selection or preparation, information about nutrition and positive food choices should also be a component of behavioral interventions.
Other approaches to risk reduction must also be considered. Although cardiovascular risk increases with increasing duration of ART in adults, in the SMART study the risk was found to be even greater in those who underwent treatment interruptions [37], and elevations in hsCRP were independently associated with increased risk of death [18]. It is not known whether this finding will apply to treatment interruptions in adolescents. It is notable that, among those on ART in the current study, 31% had detectable viremia, demonstrating the need for increased emphasis on adherence to ART in this population. Finally, in the absence of adolescent-specific guidelines for managing HIV-associated dyslipidemia, guidelines for HIV-infected adults [38,39] or non HIV-infected youth [40] can be used for reference.
To our knowledge, this is the first comprehensive survey of metabolic and morphologic alterations in behaviorally HIV-infected adolescent women. The study included objective measurements of body habitus and fat distribution, along with biochemical evaluations and extensive medical histories. However, we recognize that our ability to draw inferences from our results is limited by the cross-sectional design. In addition, although our HIVpos and HIVneg participants had similar age distributions, the groups were not balanced with regard to race, parity, drug use, or exercise. Although our statistical analyses adjusted for race, it is possible that imbalances in these and other undocumented factors may have affected our results. Insulin resistance (HOMA-IR) and LDL-C were calculated, rather than measured directly and, thus, we may not have detected subtle differences among groups. Although we did not adjust for multiple comparisons, had we required a more conservative alpha of 0.01 to establish statistical significance, there would still have been significant differences among study groups in levels of triglycerides, total, HDL, and non-HDL cholesterol, and HS-CRP (Table 3), and, among BMI categories, in all metabolic outcomes except HDL-C and triglycerides (Table 4). Finally, the number of participants in our non-NNRTI/non-PI group was lower than in the other groups, which limits our ability to draw conclusions about this group or about the potential influence of abacavir on the results.
In summary, obesity, dyslipidemia, and inflammation were prominent findings in this group of behaviorally infected adolescent women. In addition to HIV infection and ART, our data illustrate the significant impact of overweight and obesity on dyslipidemia, insulin resistance, and elevated hsCRP levels in this population. Coupled with cigarette smoking, inactivity, and family history of type 2 diabetes and CVD, these factors may accelerate the lifetime risk of CVD and other adverse events in a group that is facing lifelong exposure to ART. These results underscore the need for a multifaceted approach to addressing risk reduction in this population.
Acknowledgments
This work was supported by The Adolescent Trials Network for HIV/AIDS Interventions (ATN) from the National Institutes of Health [U01 HD 040533 and U01 HD 040474] through the National Institute of Child Health and Human Development (B. Kapogiannis, L. Serchuck), with supplemental funding from the National Institutes on Drug Abuse (N. Borek) and Mental Health (P. Brouwers, S. Allison). The study was scientifically reviewed by the ATN's Therapeutic Leadership Group. Network, scientific and logistical support was provided by the ATN Coordinating Center (C. Wilson, C. Partlow) at The University of Alabama at Birmingham. Network operations and analytic support was provided by the ATN Data and Operations Center at Westat (J. Korelitz, B. Driver).
We acknowledge the contribution of the investigators and staff at the following ATN sites that participated in this study: Children's Diagnostic and Treatment Center (Ana Puga MD, Esmine Leonard BSN, Zulma Eysallenne RN); Childrens Hospital of Los Angeles (Marvin Belzer MD, Cathy Salata RN, Diane Tucker RN, MSN); Children's Hospital National Medical Center (Lawrence D'Angelo MD, Connie Trexler RN); John H. Stroger Jr. Hospital of Cook County and the CORE Center (Jaime Martinez MD, Kelly Bojan DNP, RN, CFNP, Rachel Jackson MSN, APN, CFNP); Montefiore Medical Center (Donna Futterman MD, Elizabeth Enriquez-Bruce MD, Maria Campos, RN); Mount Sinai Medical Center (Linda Levin-Carmine MD, Mary Geiger RN, MPH, Angela Lee PA-C, MPH); St. Jude Children's Research Hospital (Nehali Patel MD, Aditya Gaur MD, Mary Dillard RN); Tulane University Health Sciences Center (Sue Ellen Abdalian MD, Leslie Kozina RN, Trina Jeanjacques BA); University of California, San Francisco (Barbara Moscicki MD, JB Molaghan, NP); University of Maryland (Ligia Peralta MD, Leonel Flores MD, Esther Collinetti BA); University of Miami School of Medicine (Lawrence Friedman MD, Donna Maturo MSN, ARNP, Hanna Major-Wilson MSN, ARNP); University of Pennsylvania and the Children's Hospital of Philadelphia (Bret Rudy MD, Mary Tanney MPH, MSN, CPNP, Adrienne DiBenedetto BSN); University of Puerto Rico (Irma Febo MD, Carmen Rivera-Torres, MPH); University of South Florida (Patricia Emmanuel MD, Silvia Callejas BSN, ACRN, CCRC, Priscilla Julian RN).
The following sites utilized their General Clinical Research Center/Pediatric Clinical Research Centers, which were supported by grants from the General Clinical Research Center Program of the National Center for Research Resources, National Institutes of Health, Department of Health and Human Services: Children's Hospital of Los Angeles, M01 RR00043; Mt. Sinai Medical Center, M01 RR00071; University of California San Francisco, M01 RR001271; University of Maryland, M01 RR165001; University of Pennsylvania/Children's Hospital of Philadelphia, M01 RR00240; and University of South Florida/All Children's Hospital Clinical Research Center, R60 MC00003.
The authors also wish to acknowledge Nancy Liu, Luceli Cuasay, and Jiahong Xu with Westat for their invaluable assistance. Finally, the investigators are particularly indebted to the youth who participated in this study.
Support: This work was supported by The Adolescent Trials Network for HIV/AIDS Interventions (ATN) from the National Institutes of Health [U01 HD 040533 and U01 HD 040474] through the National Institute of Child Health and Human Development, with supplemental funding from the National Institutes on Drug Abuse and Mental Health.
Footnotes
Potential conflicts of interest: All authors declare that they have no conflicts.
REFERENCES
- 1.Hall HI, Song R, Rhodes P, et al. Estimation of HIV incidence in the United States. JAMA. 2008;300:520–9. doi: 10.1001/jama.300.5.520. [DOI] [PMC free article] [PubMed] [Google Scholar]
- 2.Wilson CM, Houser J, Partlow C, Rudy BJ, Futterman DC, Friedman LB. The REACH (Reaching for Excellence in Adolescent Care and Health) project: study design, methods, and population profile. J Adolesc Health. 2001;29:8–18. doi: 10.1016/s1054-139x(01)00291-9. [DOI] [PubMed] [Google Scholar]
- 3.Flegal KM, Carroll MD, Ogden CL, Johnson CL. Prevalence and trends in obesity among US adults, 1999-2000. JAMA. 2002;288:1723–7. doi: 10.1001/jama.288.14.1723. [DOI] [PubMed] [Google Scholar]
- 4.Ogden CL, Carroll MD, Curtin LR, McDowell MA, Tabak CJ, Flegal KM. Prevalence of overweight and obesity in the United States, 1999-2004. JAMA. 2006;295:1549–55. doi: 10.1001/jama.295.13.1549. [DOI] [PubMed] [Google Scholar]
- 5.Steinberger J, Daniels SR. Obesity, insulin resistance, diabetes, and cardiovascular risk in children: an American Heart Association scientific statement from the Atherosclerosis, Hypertension, and Obesity in the Young Committee (Council on Cardiovascular Disease in the Young) and the Diabetes Committee (Council on Nutrition, Physical Activity, and Metabolism). Circulation. 2003;107:1448–53. doi: 10.1161/01.cir.0000060923.07573.f2. [DOI] [PubMed] [Google Scholar]
- 6.Wilson PW, Bozeman SR, Burton TM, Hoaglin DC, Ben Joseph R, Pashos CL. Prediction of first events of coronary heart disease and stroke with consideration of adiposity. Circulation. 2008;118:124–30. doi: 10.1161/CIRCULATIONAHA.108.772962. [DOI] [PubMed] [Google Scholar]
- 7.Smoak CG, Burke GL, Webber LS, Harsha DW, Srinivasan SR, Berenson GS. Relation of obesity to clustering of cardiovascular disease risk factors in children and young adults. The Bogalusa Heart Study. Am J Epidemiol. 1987;125:364–72. doi: 10.1093/oxfordjournals.aje.a114543. [DOI] [PubMed] [Google Scholar]
- 8.de Ferranti SD, Gauvreau K, Ludwig DS, Neufeld EJ, Newburger JW, Rifai N. Prevalence of the metabolic syndrome in American adolescents: findings from the Third National Health and Nutrition Examination Survey. Circulation. 2004;110:2494–7. doi: 10.1161/01.CIR.0000145117.40114.C7. [DOI] [PubMed] [Google Scholar]
- 9.Amorosa V, Synnestvedt M, Gross R, et al. A tale of 2 epidemics: the intersection between obesity and HIV infection in Philadelphia. J Acquir Immune Defic Syndr. 2005;39:557–61. [PubMed] [Google Scholar]
- 10.Kruzich LA, Marquis GS, Wilson CM, Stephensen CB. HIV-infected US youth are at high risk of obesity and poor diet quality: a challenge for improving short- and long-term health outcomes. J Am Diet Assoc. 2004;104:1554–60. doi: 10.1016/j.jada.2004.07.031. [DOI] [PubMed] [Google Scholar]
- 11.Grunfeld C, Kotler DP, Arnett DK, et al. Contribution of metabolic and anthropometric abnormalities to cardiovascular disease risk factors. Circulation. 2008;118:e20–8. doi: 10.1161/CIRCULATIONAHA.107.189623. [DOI] [PMC free article] [PubMed] [Google Scholar]
- 12.WHO Consultation on Obesity . Obesity: preventing and managing the global epidemic. World Health Organization; Geneva: 2000. WHO Technical Report Series 894. [PubMed] [Google Scholar]
- 13.Friedewald WT, Levy RI, Fredrickson DS. Estimation of the concentration of low-density lipoprotein cholesterol in plasma, without use of the preparative centrifuge. Clinical Chemistry. 1972;18:499–502. [PubMed] [Google Scholar]
- 14.Matthews DR, Hosker JP, Rudenski AS, Naylor BA, Treacher DF, Turner RC. Homeostasis model assessment: insulin resistance and B-cell function from fasting plasma glucose and insulin concentrations in man. Diabetologia. 1985;28:412–9. doi: 10.1007/BF00280883. [DOI] [PubMed] [Google Scholar]
- 15.Botton J, Heude B, Kettaneh A, et al. Cardiovascular risk factor levels and their relationships with overweight and fat distribution in children: the Fleurbaix Laventie Ville Sante II study. Metabolism. 2007;56:614–22. doi: 10.1016/j.metabol.2006.12.006. [DOI] [PMC free article] [PubMed] [Google Scholar]
- 16.National Cholesterol Education Program (NCEP) highlights of the report of the Expert Panel on Blood Cholesterol Levels in Children and Adolescents. Pediatrics. 1992;89:495–501. [PubMed] [Google Scholar]
- 17.American Diabetes Association Type 2 diabetes in children and adolescents. Diabetes Care. 2000;23:381–9. doi: 10.2337/diacare.23.3.381. [DOI] [PubMed] [Google Scholar]
- 18.Kuller LH, Tracy R, Belloso W, et al. Inflammatory and coagulation biomarkers and mortality in patients with HIV infection. PLoS Med. 2008;5:e203. doi: 10.1371/journal.pmed.0050203. [DOI] [PMC free article] [PubMed] [Google Scholar]
- 19.Weiss R, Dziura J, Burgert TS, et al. Obesity and the metabolic syndrome in children and adolescents. N Engl J Med. 2004;350:2362–74. doi: 10.1056/NEJMoa031049. [DOI] [PubMed] [Google Scholar]
- 20.Webber LS, Harsha DW, Phillips GT, Srinivasan SR, Simpson JW, Berenson GS. Cardiovascular risk factors in Hispanic, white, and black children: the Brooks County and Bogalusa Heart studies. Am J Epidemiol. 1991;133:704–14. doi: 10.1093/oxfordjournals.aje.a115945. [DOI] [PubMed] [Google Scholar]
- 21.Triant VA, Lee H, Hadigan C, Grinspoon SK. Increased acute myocardial infarction rates and cardiovascular risk factors among patients with human immunodeficiency virus disease. J Clin Endocrinol Metab. 2007;92:2506–12. doi: 10.1210/jc.2006-2190. [DOI] [PMC free article] [PubMed] [Google Scholar]
- 22.Friis-Moller N, Sabin CA, Weber R, et al. Combination antiretroviral therapy and the risk of myocardial infarction. N Engl J Med. 2003;349:1993–2003. doi: 10.1056/NEJMoa030218. [DOI] [PubMed] [Google Scholar]
- 23.Friis-Moller N, Reiss P, Sabin CA, et al. Class of antiretroviral drugs and the risk of myocardial infarction. N Engl J Med. 2007;356:1723–35. doi: 10.1056/NEJMoa062744. [DOI] [PubMed] [Google Scholar]
- 24.Mulligan K, Anastos K, Justman J, et al. Fat distribution in HIV-infected women in the United States: DEXA substudy in the Women's Interagency HIV Study. J Acquir Immune Defic Syndr. 2005;38:18–22. doi: 10.1097/00126334-200501010-00004. [DOI] [PubMed] [Google Scholar]
- 25.Sobieszczyk ME, Hoover DR, Anastos K, et al. Prevalence and predictors of metabolic syndrome among HIV-infected and HIV-uninfected women in the Women's Interagency HIV Study. J Acquir Immune Defic Syndr. 2008;48:272–80. doi: 10.1097/QAI.0b013e31817af461. [DOI] [PubMed] [Google Scholar]
- 26.Ridker PM, Cook NR. Biomarkers for prediction of cardiovascular events. N Engl J Med. 2007;356:1472–3. [PubMed] [Google Scholar]
- 27.Triant VA, Meigs JB, Grinspoon SK. Association of C-reactive protein and HIV infection with acute myocardial infarction. J Acquir Immune Defic Syndr. 2009;51:268–73. doi: 10.1097/QAI.0b013e3181a9992c. [DOI] [PMC free article] [PubMed] [Google Scholar]
- 28.Sutherland JP, McKinley B, Eckel RH. The metabolic syndrome and inflammation. Metab Syndr Relat Disord. 2004;2:82–104. doi: 10.1089/met.2004.2.82. [DOI] [PubMed] [Google Scholar]
- 29.Lambert M, Delvin EE, Paradis G, O'Loughlin J, Hanley JA, Levy E. C-reactive protein and features of the metabolic syndrome in a population-based sample of children and adolescents. Clin Chem. 2004;50:1762–8. doi: 10.1373/clinchem.2004.036418. [DOI] [PubMed] [Google Scholar]
- 30.Kelishadi R, Sharifi M, Khosravi A, Adeli K. Relationship between C-reactive protein and atherosclerotic risk factors and oxidative stress markers among young persons 10-18 years old. Clin Chem. 2007;53:456–64. doi: 10.1373/clinchem.2006.073668. [DOI] [PubMed] [Google Scholar]
- 31.Samaras K, Gan SK, Peake PW, Carr A, Campbell LV. Proinflammatory markers, insulin sensitivity, and cardiometabolic risk factors in treated HIV infection. Obesity. 2009;17:53–9. doi: 10.1038/oby.2008.500. [DOI] [PubMed] [Google Scholar]
- 32.Danoff A, Shi Q, Justman J, et al. Oral glucose tolerance and insulin sensitivity are unaffected by HIV infection or antiretroviral therapy in overweight women. J Acquir Immune Defic Syndr. 2005;39:55–62. doi: 10.1097/01.qai.0000147659.80642.5a. [DOI] [PubMed] [Google Scholar]
- 33.Grunfeld C, Pang M, Doerrler W, Shigenaga JK, Jensen P, Feingold KR. Lipids, lipoproteins, triglyceride clearance, and cytokines in human immunodeficiency virus infection and the acquired immunodeficiency syndrome. J Clin Endocrinol Metab. 1992;74:1045–52. doi: 10.1210/jcem.74.5.1373735. [DOI] [PubMed] [Google Scholar]
- 34.Pate RR, Freedson PS, Sallis JF, et al. Compliance with physical activity guidelines: prevalence in a population of children and youth. Ann Epidemiol. 2002;12:303–8. doi: 10.1016/s1047-2797(01)00263-0. [DOI] [PubMed] [Google Scholar]
- 35.Aadahl M, Kjaer M, Jorgensen T. Influence of time spent on TV viewing and vigorous intensity physical activity on cardiovascular biomarkers. The Inter 99 study. Eur J Cardiovasc Prev Rehabil. 2007;14:660–5. doi: 10.1097/HJR.0b013e3280c284c5. [DOI] [PubMed] [Google Scholar]
- 36.Laurson KR, Eisenmann JC, Welk GJ, Wickel EE, Gentile DA, Walsh DA. Combined influence of physical activity and screen time recommendations on childhood overweight. J Pediatr. 2008;153:209–14. doi: 10.1016/j.jpeds.2008.02.042. [DOI] [PubMed] [Google Scholar]
- 37.El Sadr WM, Lundgren JD, Neaton JD, et al. CD4+ count-guided interruption of antiretroviral treatment. N Engl J Med. 2006;355:2283–96. doi: 10.1056/NEJMoa062360. [DOI] [PubMed] [Google Scholar]
- 38.Schambelan M, Benson CA, Carr A, et al. Management of metabolic complications associated with antiretroviral therapy for HIV-1 infection: recommendations of an International AIDS Society-USA panel. J Acquir Immune Defic Syndr. 2002;31:257–75. doi: 10.1097/00126334-200211010-00001. [DOI] [PubMed] [Google Scholar]
- 39.Wohl DA, McComsey G, Tebas P, et al. Current concepts in the diagnosis and management of metabolic complications of HIV infection and its therapy. Clin Infect Dis. 2006;43:645–53. doi: 10.1086/507333. [DOI] [PubMed] [Google Scholar]
- 40.McCrindle BW, Urbina EM, Dennison BA, et al. Drug therapy of high-risk lipid abnormalities in children and adolescents: a scientific statement from the American Heart Association Atherosclerosis, Hypertension, and Obesity in Youth Committee, Council of Cardiovascular Disease in the Young, with the Council on Cardiovascular Nursing. Circulation. 2007;115:1948–67. doi: 10.1161/CIRCULATIONAHA.107.181946. [DOI] [PubMed] [Google Scholar]