

Abstract
Lung cancer is usually disseminated at diagnosis making prognosis poor. Smokers are at high risk for lung cancer and are targets for prevention and early detection strategies. Sputum is a potential source for lung cancer biomarkers, but no test is currently available with sufficient sensitivity and specificity for clinical screening utility. Chromosomal aneusomy (CA) was measured in sputum samples collected prospectively from 100 incident lung cancer cases and 96 controls matched on age, gender, and date of collection. The CA-FISH assay was performed using a four-target DNA FISH probe including EGFR, MYC, 5p15 and CEP6. Sensitivity for a positive CA-FISH assay (abnormal for ≥ 2 of the 4 markers) was substantially higher for samples collected within 18 months (76%) than >18 months before lung cancer diagnosis (31%). Specificity for a positive FISH by this same definition was 85%. Among subjects providing sputum sample within 18 months before diagnosis, sensitivity was higher for squamous cell cancers (94%) than for other histologic types (69%). The adjusted odds ratios for specimens collected within 18 months of cancer diagnosis were higher using the CA-FISH assay (OR=27.2, 95% CI 7.8 to 94.1) than previous studies assessing cytologic atypia (OR=2.3, CI 0.8 to 6.4) or gene promoter methylation (OR=6.5; CI 1.2 to 35.5). In conclusion, chromosomal aneusomy in sputum is a promising biomarker for prediction of lung cancer risk. Evaluation of the 4-DNA targets was more effective than any single marker and had highest sensitivity for samples collected ≤ 18 months to lung cancer diagnosis and patients diagnosed with squamous cell carcinoma.
Keywords: Sputum, Lung Cancer, FISH, biomarker, Chromosomal Abnormality
INTRODUCTION
Survival rates for lung cancer have been low for many years (1), mostly because the majority of patients present with advanced stage disease.. Lung cancer risk can be estimated by several factors that can be easily determined, including smoking history, age, previous tobacco related malignancy, family history of lung cancer and the presence of chronic obstructive pulmonary disease (2–5). However, clinical prediction based on these risk factors is poor at the individual level (6–9), and there is an urgent need for non-invasive assays for early detection of lung cancer among smokers and former smokers. Computerized tomography (CT) imaging of the lung shows promise for early lung cancer detection, but the efficacy of CT screening for reducing mortality from lung cancer is yet to be demonstrated (10–14). If CT screening is effective, it will likely be more effective for detecting peripheral lung cancers than for central lesions, so complementary methods for identifying central airway cancers is needed.
We have been conducting a prospective study to assess the performance of various biomarkers in sputum to detect lung cancer. We previously demonstrated that both moderate and higher levels of cytologic atypia (15–17) and gene promoter methylation (18;19) can predict incident lung cancer in a cohort of heavy smokers with airflow obstruction. In a small set of nested cases and controls selected from our ongoing cohort study, a four-target FISH assay was a suitable test to detect abnormal cells in sputum (20). In this study we utilized the same four-target FISH assay to evaluate chromosomal aneusomy (CA) in sputum cells in a larger number of subjects and compared results to sensitivity and specificity previous observed for cytology and gene promoter hypermethylation in sputum.
MATERIALS AND METHODS
Subject Population
Subjects included in this study were enrolled in the Colorado High Risk Cohort Study from 1993 to 2003. Methods of accrual and processing of specimens have been described previously (21). Briefly, subjects have been recruited from community and academic pulmonary clinics, primarily in the metropolitan area of Denver, Colorado. At the time of enrollment, all subjects had a cigarette smoking history of at least 30 pack years, significant pulmonary airflow obstruction but no history of cancer or acute respiratory infection. Cohort members were followed by active methods including telephone and mail, and by passive methods, including matching to the Colorado Department of Public Health and Environment Vital Statistics and Central Cancer Registry records. These patients were asked to collect two consecutive three-day early morning, spontaneous cough sputum specimens in jars containing Saccomanno’s fixative (2% carbowax and 50% alcohol). Sputum specimens were stored at room temperature in the Tissue Procurement Core of the University of Colorado SPORE in Lung Cancer.
In 2005, 114 incident lung cancer cases were identified and matched with 114 control subjects from the same cohort who had remained clinically cancer free for at least 5 years (controls). The individual matching was performed according to gender, age (± 6 years), and date of enrollment in the cohort study (± 6 months). FISH assay results could be obtained from 100 of these cases (88%) and 96 of these controls (84%). Stage was defined according to the SEER Summary Stage 1977 guidelines and the information was obtained directly from the Colorado Central Cancer Registry. Stage I was defined as localized, Stage II and IIIA as regional, and Stage IIB and IV as distant. There was a single case of CIS in the analysis that was grouped with the unknown category following criteria previously used (15)
Assay Methods
For FISH assays, specimens were processed according to protocol previously described (20;22) using approximately 300 μl of sputum from the same pooled sample collected from days 4 to 6 from which the cytologic examination was performed. The cells were washed two or three times in phosphate buffer saline (PBS), centrifuged and the cell pellet was then incubated for 20 min in 1.5 ml Hanks balanced salt solution (HBSS)/10 mM ethylenediaminetetracetic acid (EDTA)/20 mM dithiothreitol (DTT). After centrifugation, the pellet was then fixed in 1.5 ml of fresh methanol: glacial acetic acid and the cell suspension dropped within a ~12 mm diameter circle drafted with a wax pen onto two uncoated, dry microscope slides. The slides were then air dried, stored in a desiccator overnight, and one of them was selected for the FISH assays based on cellularity, nuclear morphology, lack of purulence, debris and residual cytoplasm.
The FISH assays were performed with the LAVysion™ probe set (Abbott Molecular) including one centromeric sequence (6p11.1-q1 1, CEP 6, labeled with SpectrumAqua) and three single copy DNA sequences: 5p15.2 (markers D5S23, D5S721 labeled with SpectrumGreen), 7p12 (EGFR, labeled with SpectrumRed), and 8q24.12-q24.13 (MYC, labeled in SpectrumGold). The hybridization was performed in freshly prepared slides (1–3 days old) after incubation in saline sodium citrate buffer (2xSSC) at 37°C for 30 min and in 70% glacial acetic acid for 1 min, digestion in pepsin (0.5mg/ml in 10 mM HCl) at 37°C for 10 min and fixation in 1% formaldehyde at room temperature for 5 min. Seven μl of the LAVysion probe was applied on the selected hybridization area, which was covered with a 15 mm circular glass coverslip and sealed with rubber cement. Denaturation and hybridization were performed using the HYBrite thermocycler (Abbott Molecular) programmed for a 2 min melting time at 72°C and 24 hours of hybridization at 37°C. Post-hybridization washes included sequential incubations in 2xSSC/0.1% tergitol (nonylphenoxypolyethoxyethanol, NP-40) for 2 min at 73C and 2xSSC for 2 min at RT. Subsequently, slides were briefly dehydrated in ethanol, air-dried, and DAPI (0.3 ug of 4′6′-diamidino-2-phenylindole dihydrochloride per milliliter of Vectashield mounting medium) was applied to counterstain the chromatin and protect from light exposure.
Analysis was performed using epifluorescence microscopes equipped with single band pass filters for DAPI, Texas red, FITC, SpectrumAqua and SpectrumGold. For documentation, images were acquired with cooled CCD camera (Photometrics, Tucson, AZ) in monochromatic layers and merged and processed using the CytoVysion software (Applied Imaging Inc). Selection of cells from analyses followed the FISH selective cell assessment previously described (20). The hybridization areas were scanned for putative epithelial cells with non-overlapped, non-disrupted nuclei with distinctive signals. Sputum cells selected for analysis in the study had large, oblong-shaped nuclei with coarse chromatin texture and sometimes irregular nuclear borders. When detectable, the small ratio nucleus/cytoplasm was also an important criterion in the cell selection. The entire area (approximately 12 mm diameter) was completely scanned by a trained cytogeneticist. On average, more than 500 nuclei were examined per slide and 30 nuclei were selected as cytologically “atypical” based on the morphological features described above. Specimens carrying fewer than 100 nuclei with good hybridization signals were considered failures, and the failure rate was 14% (32 out of 228 specimens. Reasons for failure were insufficient cellularity in the 300 ml of fixed cell suspension, degraded condition of cells, and unacceptable quality of hybridization in two attempts (a standard protocol plus customized troubleshooting).
The following criteria were used for assessment of the CA-FISH assay: An abnormal cell was defined as showing gain in copy number (more then 2 signals) for at least two DNA targets or gain in copy number for at least one DNA target and loss (less than 2 signals) for at least two DNA targets. Because tumor cells are expected to be rare in sputum, specimens were classified as abnormal when they showed ≥ 2% abnormal cells among the scored nuclei. A total of 401 sputum specimens blinded for the patient information (patient ID, time of collection and cancer status) were assayed by FISH, with an overall success rate of 83%.
Statistical Analyses
The sputum specimens were categorized into several subsets for independent investigation according to the number of months prior to the diagnosis of cancer in the cases (within 18 months or longer than 18 months prior to diagnosis), and according to the histologic type of lung cancer detected. In subjects with multiple specimens collected at a specific time frame, the specimen collected closest to the date of lung cancer diagnosis (or to the same date for the matched control) was the single sample used for these analyses. Sensitivity and specificity were estimated and logistic regression models were used to evaluate the association between lung cancer and FISH-detected chromosomal aneusomy with adjustment for potential confounding factors. Covariates included age (continuous), sex, smoking status (former vs. current at baseline), FEV1 and pack-years of tobacco use. Former smokers were defined as having quit at least one year at the time of enrollment. Pack years were defined as the average number of packs smoked per day multiplied by the number of years smoked. The two variables comprising pack years were those reported at time of enrollment. Associations were expressed as odds ratios with corresponding 95% confidence intervals. Univariate and multivariate models adjusting for covariates were implemented. All analyses were carried out using Statistical Analysis Software (version 9.2, SAS Institute, Inc., Cary, NC).
RESULTS
This study compared 100 cases to 96 controls (Table 1). The mean age was 67 years and the majority of patients were male (75%), former smokers (63%) and white (96%). These specimens were collected within 18 months of clinical diagnosis of lung cancer in the cases and this time point was selected to make it consistent with earlier reports (15;18) and to allow larger numbers of subjects to be included in the subgroup analyses. As shown in Table 2, there was a significant association between detection of chromosomal aneuploidy and cancer status in each patient subset for each of the four FISH markers, but sensitivity for all samples ranged from as low as 19% to only 59%. Among all the samples, sensitivity based on 2 or more of the 4 markers being positive was 56% and specificity was 85%. Age-adjusted and fully-adjusted odds ratio (OR) increased from approximately 5 when any of the 4 markers was abnormal to approximately 8 when 2 or more of the markers were abnormal. Figure 1 illustrated sputum cells with normal copy numbers for all DNA targets analyzed and with copy number gain for abnormality for three or four of the tested markers.
Table 1.
Characteristics of incident lung cancer cases and controls nested within the Colorado High Risk Cohort
| Characteristics | Cases (N=100) | Controls (N=96) | ||
|---|---|---|---|---|
| N | % | N | % | |
| Gender | ||||
| Male | 75 | 75 | 71 | 74 |
| Female | 25 | 25 | 25 | 26 |
| Race | ||||
| White | 95 | 95 | 92 | 96 |
| Other | 5 | 5 | 4 | 4 |
| Age | ||||
| <65 years | 37 | 37 | 35 | 36 |
| 65 years and older | 63 | 63 | 61 | 64 |
| Mean age (SD) | 67.1 (8.04) | 67.1 (8.20) | ||
| Smoking | ||||
| Current smoker | 40 | 40 | 31 | 32 |
| Former Smoker | 57 | 57 | 63 | 66 |
| Current status unknown | 3 | 3 | 2 | 2 |
| Mean pack-years (SD) | 74.2 (35.6) | 66.9 (29.0) | ||
Table 2.
Abnormalities in selected and pooled FISH aneuploidy markers among nested incident lung cancer cases and controls sampled from the Colorado High Risk Cohort.
| Marker | Cases* (N=100) | Controls* (N=96) | Odds ratio (95% CI) | |||
|---|---|---|---|---|---|---|
| Abnormal | Abnormal | Age-adjusted model | Fully-adjusted model* | |||
| N | % | N | % | |||
| Individual DNA markers | ||||||
| EGFR | 59 | 59 | 21 | 22 | 5.2 (2.8, 9.8) | 4.9 (2.6, 9.4) |
| 5p15 | 47 | 47 | 13 | 14 | 5.7 (2.8, 11.5) | 5.6 (2.7, 11.4) |
| cMYC | 46 | 46 | 12 | 13 | 6.0 (2.9, 12.4) | 5.5 (2.6, 11.5) |
| CEP6 | 19 | 19 | 2 | 2 | 11.1 (2.5, 49.0) | 12.0 (2.7, 54.5) |
| Number of abnormal markers among the pooled 4 | ||||||
| None | 31 | 31 | 67 | 70 | 1.0 (reference) | 1.0 (reference) |
| Any of the 4 | 69 | 69 | 29 | 33 | 5.2 (2.8, 9.4) | 5.0 (2.6, 9.3) |
| ≥ 2 markers | 56 | 56 | 14 | 15 | 8.8 (4.2, 18.2) | 8.3 (3.9,17.7) |
Adjusted for age, sex, fev1, pack-years of smoking, and current smoking status
Figure 1.
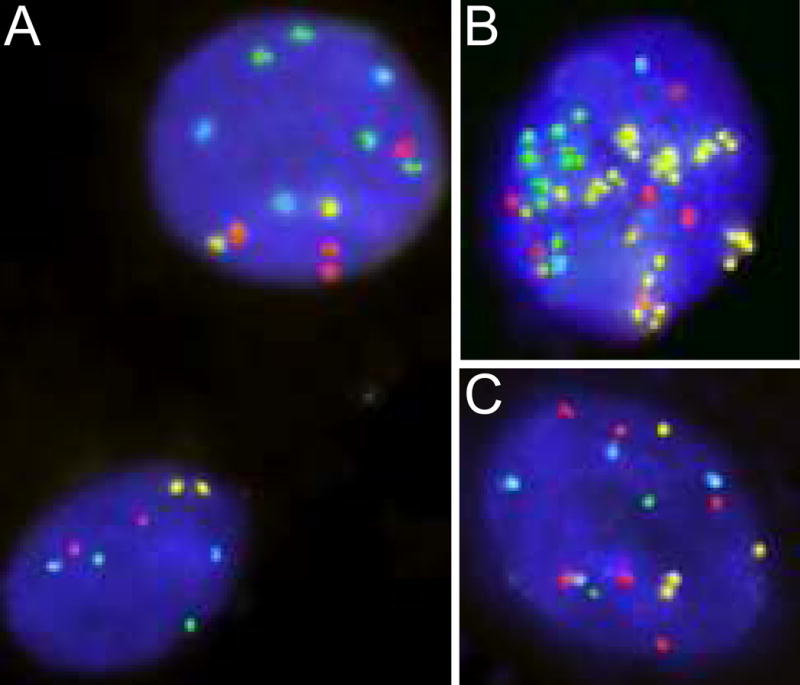
Sputum specimens from three Cases hybridized with the LAVysion probe set, including DNA sequences of EGFR (red), 5p15 (green), MYC (yellow) and CEP 6 (aqua). A. Nuclei showing normal pattern (bottom left, 2 copies of red, green, yellow and aqua signals) and abnormal pattern (4 copies of EGFR, 4 copies of 5p15, 2 copies of MYC and 3 copies of CEP 6 signals). B. Nucleus with copy number gain for all markers, including MYC gene amplification. C. Nucleus showing copy number gain for 3 markers (EGFR, MYC and CEP6).
There was a large difference in sensitivity for samples depending on the time between sample collection and the lung cancer diagnosis (Table 3). Sensitivity increased to 76% for samples collected within 18 months of cancer diagnosis. Among samples collected within 18 months of diagnosis, sensitivity was 95% for those cases diagnosed with squamous cell cancer, and sensitivity was also high among cancers diagnosed at a localized stage (93%) (Table 3). Sensitivity and specificity were slightly improved for samples collected within 12 months (Supplemental Table 1) or 6 months of diagnosis, overall and by histology, but the number of specimens in the 6-month interval was small enough to prevent stable sanalysis.
Table 3.
Abnormality in FISH, defined as 2 or more markers abnormal among the 4 tested markers, by time between sputum collection and the date of lung cancer incidence, by cancer histology, and by cancer stage.
| Characteristic | Cases | Odds ratio (95% CI) * | ||
|---|---|---|---|---|
| n / N abnormal | % | Age-adjusted model | Fully-adjusted model** | |
| Time between sputum collection and lung cancer incidence | ||||
| More than 18 months | 14/45 | 31 | 2.0 (0.7, 5.6) | 1.7 (0.6, 5.3) |
| Within 18 months | 42/55 | 76 | 24.1 (8.8, 65.8) | 29.9 (9.5, 94.1) |
| Among samples collected within 18 months before diagnosis | ||||
| Lung cancer histology | ||||
| Squamous cell | 15/16 | 94 | 131.1 (13.6, 999) | Not estimable |
| Adenocarcinoma | 11/17 | 65 | 12.9 (3.6, 46.2) | 16.4 (3.7, 72.2) |
| Small cell | 3/5 | 60 | 10.2 (1.4, 73.7) | 4.7 (0.2, 99.9) |
| Others | 10/13 | 77 | 29.8 (6.0, 148.8) | 77.8 (7.9, 764.5) |
| Unknown | 3/4 | 75 | 21.0 (1.7, 254.4) | 10.3 (0.4, 242.4) |
| Lung cancer stage | ||||
| Localized | 14/15 | 93 | 123.5 (12.4, 999) | Not estimable |
| Regional | 4/7 | 57 | 12.2 (2.0, 73.5) | 15.7 (2.1,118.6) |
| Distant | 8/14 | 57 | 9.0 (2.4, 34.7) | 20.6 (3.6, 118.0) |
| Unknown | 16/19 | 84 | 39.8 (9.1, 173.4) | 37.7 (7.6, 186.8) |
Odds ratios comparing cases to the pooled control group, among whom there were 7/59 (12%) who had ≥ 2 abnormal FISH markers for ≤ 18 month proximal samples and 7/37 (19%) who had ≥ 2 abnormal FISH markers for > 18 month proximal samples.
Adjusted for age, sex, FEV1, pack-years of smoking, and current smoking status
Abnormalities detected by FISH associated significantly with cytology atypia (Kendall’s r: 0.44, p <0.001), higher frequency of abnormal specimens were detected by FISH than by cytology among cases (Supplemental Table 2). ROC curve analyses showed that area under the curve was highest when FISH and cytology were in the model (AUC=0.85) but not significantly better than FISH alone (AUC=0.84) (Supplemental Figure 1). Both models have included adjustments for age, sex, fev1, pack-years of smoking, and current smoking status. Additionally, association between cytologia atypia and individual tumor subtypes was overall lower than detected by FISH markers (Supplemental Table 3).
DISCUSSION
Lung cancer biomarkers expressed in readily accessible samples, such as blood (23), sputum (8), exhaled breath (24) or urine (25), have great potential utility for guiding clinical decisions in the setting of CT detected lung nodules, for identifying high risk populations for inclusion in chemoprevention or early detection trials, and for population screening. While investigation in this area is active, no such lung cancer risk biomarkers suitable for clinical application have been validated. Recently, it was reported that matched sputum and tumor tissues from lung cancer patients carried similar chromosomal deletions (26). Chromosomal missegregation, with resulting losses and gains, is a hallmark of cancer and in this study we have shown that chromosomal aneusomy is strongly associated with lung cancer incidence for samples prospectively collected within 18 months before lung cancer diagnosis. Such abnormalities have high enough sensitivity (76%) and specificity (85%) to be of possible utility in selected clinical screening settings.
The results from this nested case-control study build on those in our previously published investigation of chromosomal aneusomy in a subset of 33 case-control pairs by tripling the numbers of subjects. The samples collected closest to diagnosis were scored for two or more abnormalities to more closely represent the characteristics of a screening test using a single collected sample, rather than using the worst score of several sputum collections. This study’s results using a single sample collected within 18 months are generally consistent with the previous findings for samples collected within 12 months.
Comparing these findings to those from our previous assessments of sputum cytology and methylation (15;18), we observed much better combinations of sensitivity and specificity for detecting incident lung cancer with the CA-FISH assay (sensitivity 76%, specificity 85%) than for either cytology (sensitivity 29%, specificity 83%) or gene promoter methylation (sensitivity and specificity both 64%) (Table 4). Although these comparisons are all made within this same cohort, those analyses differed in minor ways. We did assess all three of these biomarkers in a subset of 48 cases and 48 controls in this study who had all three biomarkers assayed from the same sputum sample, and found results quite similar to those presented in Table 4. These three biomarkers are largely independent of each other, but further analyses of independence and complementarity will require larger numbers of subjects. Thus, CA-FISH deserves further study and validation in additional high risk populations for use either as a primary screen in high risk populations or to assist clinical management of those suspected of having cancer, given the assay’s performance in those with localized or regional stage disease. Further research using greater numbers of subjects successfully assayed with all three tests is also needed to investigate whether combination of these biomarkers will lead to improved sensitivity or specificity for lung cancer detection. An analysis in sputum specimens from a small number of patients has recently concluded that deletion detected by a panel of four FISH probes, HYAL2, FHIT, p16, and SP-A, improved sensitivity, specificity, and accuracy of CT scan for diagnosing central lung cancers (27).
Table 4.
Comparison of CA FISH findings in this analysis with previously-published findings for sputum cytology and sputum DNA methylation markers from this same cohort.
| Sensitivity | Specificity | Fully-adjusted odds ratio (95% CI) | |
|---|---|---|---|
| Cytologic atypia* | 29% | 83% | 1.8 (1.3, 2.6) |
| DNA methylation** | 64% | 64% | 6.5 (1.2, 35.5) |
| CA-FISH *** | 76% | 85% | 29.9 (9.5, 94.1) |
from reference # 15. Atypia is defined as moderate atypia or worse. Odds ratio is adjusted for age, sex, race/ethnicity, pack-years of smoking, and smoking status at baseline, and year of enrollment into the cohort.
From reference # 18. Methylation is defined as three or more of a panel of six markers methylated. Odds ratio is adjusted for age, sex, fev1, pack-years of smoking, and current smoking status
Data from the current report. Positive FISH assay is defined as 2 or more of 4 FISH markers abnormal. Odds ratio is adjusted for age, sex, FEV1, pack-years of smoking, and current smoking status
It is somewhat surprising that the assay for chromosomal aneusomy in expectorated sputum is so highly specific for lung cancer, in contrast to the lower specificity described in studies investigating chromosomal aneusomy in premalignant respiratory epithelium carried out by a number of groups, including ours (28). We speculate that the additional requirement that aneusomic cells be exfoliated for detection in sputum may be partially responsible for this degree of specificity.
This study is best considered as a proof of principle. The favorable sensitivity especially for squamous cell cancer and for detection of localized stage disease supports further validation of the assay. The specificity of CA-FISH exceeds that of any other sputum test reported to date. It is likely that the performance characteristics can be further improved. The probes used in the LAVysion four-target set may not be optimal for lung cancer detection. Research is currently ongoing to compare this original probe set to others based on chromosomal regions commonly amplified in lung cancer (29–33). Amplifications, rather than deletions, are less likely to occur as an artifact in the preparation of samples and thus are more desirable as targets of FISH cocktails.
While the current CA-FISH test is labor intensive, time-consuming and may not well suited to immediate clinical application, our results show sufficient promise that efforts to simplify the assay are merited. A higher degree of automation of screening for chromosomal aneusomy, techniques to enrich the number of epithelial cells in the sample, and combining FISH with immunohistochemical markers to more readily identify the epithelial target cells are obvious areas to be explored. Some promising results in these fields have been reported in small studies recently published (34;35).
There are a number of limitations to the CA-FISH assay. Sensitivity of the assay is related to the time between sputum sample acquisition and the cancer diagnosis. In addition, the assay has greatest sensitivity for squamous cell lung cancer. Central airway neoplasms are less likely to be detected by CT scan, so CA-FISH may well complement CT screening in diagnosis of squamous cell cancers and detection of localized disease. While the performance of CA-FISH for adenocarcinoma is not as good, it is still potentially useful for clinical decision making in the management of lung nodules.
In conclusion, the CA-FISH assay was more sensitive and specific for predicting lung cancer incidence than cytology or DNA methylation. The scoring criteria for the CA-FISH assay were designed to be highly specific with a low frequency of false positive results. The CA-FISH assay identifies chromosomal missegregations, a hallmark for carcinomas and a molecular feature already reported in advanced lung premalignancy. The assay is promising for identification of subjects at risk prior to clinically overt lung cancer and should be evaluated as an adjunct risk assessment marker in lung cancer screening trials.
Supplementary Material
Acknowledgments
The study was partially sponsored by the NCI programs Early Detection Research Network U01-CA85070, CCSG P30-CA46934 and Specialized Program of Research Excellence P50CA58187 and P50CA58184, and a research grant from Oncomethylome Sciences, Inc. Special thanks to J. Haney for technical support.
Reference List
- 1.Jemal A, Siegel R, Ward E, Hao Y, Xu J, Thun MJ. Cancer statistics. CA Cancer J Clin. 2009 Jul;59(4):225–49. doi: 10.3322/caac.20006. [DOI] [PubMed] [Google Scholar]
- 2.Gao Y, Goldstein AM, Consonni D, Pesatori AC, Wacholder S, Tucker MA, et al. Family history of cancer and nonmalignant lung diseases as risk factors for lung cancer. Int J Cancer. 2009 Jul 1;125(1):146–52. doi: 10.1002/ijc.24283. [DOI] [PMC free article] [PubMed] [Google Scholar]
- 3.Lee G, Walser TC, Dubinett SM. Chronic inflammation, chronic obstructive pulmonary disease, and lung cancer. Curr Opin Pulm Med. 2009 Jul;15(4):303–7. doi: 10.1097/MCP.0b013e32832c975a. [DOI] [PubMed] [Google Scholar]
- 4.Schwartz AG, Cote ML, Wenzlaff AS, Van DA, Chen W, Ruckdeschel JC, et al. Chronic obstructive lung diseases and risk of non-small cell lung cancer in women. J Thorac Oncol. 2009 Mar;4(3):291–9. doi: 10.1097/JTO.0b013e3181951cd1. [DOI] [PMC free article] [PubMed] [Google Scholar]
- 5.Young RP, Hopkins RJ, Hay BA, Epton MJ, Mills GD, Black PN, et al. Lung cancer susceptibility model based on age, family history and genetic variants. PLoS One. 2009;4(4):e5302. doi: 10.1371/journal.pone.0005302. [DOI] [PMC free article] [PubMed] [Google Scholar]
- 6.Anglim PP, Alonzo TA, Laird-Offringa IA. DNA methylation-based biomarkers for early detection of non-small cell lung cancer: an update. Mol Cancer. 2008;7:81. doi: 10.1186/1476-4598-7-81. [DOI] [PMC free article] [PubMed] [Google Scholar]
- 7.Baryshnikova E, Destro A, Infante MV, Cavuto S, Cariboni U, Alloisio M, et al. Molecular alterations in spontaneous sputum of cancer-free heavy smokers: results from a large screening program. Clin Cancer Res. 2008 Mar 15;14(6):1913–9. doi: 10.1158/1078-0432.CCR-07-1741. [DOI] [PubMed] [Google Scholar]
- 8.Belinsky SA, Grimes MJ, Casas E, Stidley CA, Franklin WA, Bocklage TJ, et al. Predicting gene promoter methylation in non-small-cell lung cancer by evaluating sputum and serum. Br J Cancer. 2007 Apr 23;96(8):1278–83. doi: 10.1038/sj.bjc.6603721. [DOI] [PMC free article] [PubMed] [Google Scholar]
- 9.Xie Y, Todd NW, Liu Z, Zhan M, Fang H, Peng H, et al. Altered miRNA expression in sputum for diagnosis of non-small cell lung cancer. Lung Cancer. 2009 May 13; doi: 10.1016/j.lungcan.2009.04.004. [DOI] [PMC free article] [PubMed] [Google Scholar]
- 10.Fischer B, Lassen U, Mortensen J, Larsen S, Loft A, Bertelsen A, et al. Preoperative staging of lung cancer with combined PET-CT. N Engl J Med. 2009 Jul 2;361(1):32–9. doi: 10.1056/NEJMoa0900043. [DOI] [PubMed] [Google Scholar]
- 11.Henschke CI, Yankelevitz DF, Libby DM, Pasmantier MW, Smith JP, Miettinen OS. Survival of patients with stage I lung cancer detected on CT screening. N Engl J Med. 2006 Oct 26;355(17):1763–71. doi: 10.1056/NEJMoa060476. [DOI] [PubMed] [Google Scholar]
- 12.Markowitz SB, Miller A, Miller J, Manowitz A, Kieding S, Sider L, et al. Ability of low-dose helical CT to distinguish between benign and malignant noncalcified lung nodules. Chest. 2007 Apr;131(4):1028–34. doi: 10.1378/chest.05-3014. [DOI] [PubMed] [Google Scholar]
- 13.Midthun DE, Jett JR. Update on screening for lung cancer. Semin Respir Crit Care Med. 2008 Jun;29(3):233–40. doi: 10.1055/s-2008-1076743. [DOI] [PubMed] [Google Scholar]
- 14.Wilson DO, Weissfeld JL, Fuhrman CR, Fisher SN, Balogh P, Landreneau RJ, et al. The Pittsburgh Lung Screening Study (PLuSS): outcomes within 3 years of a first computed tomography scan. Am J Respir Crit Care Med. 2008 Nov 1;178(9):956–61. doi: 10.1164/rccm.200802-336OC. [DOI] [PMC free article] [PubMed] [Google Scholar]
- 15.Byers T, Wolf HJ, Franklin WA, Braudrick S, Merrick DT, Shroyer KR, et al. Sputum cytologic atypia predicts incident lung cancer: defining latency and histologic specificity. Cancer Epidemiol Biomarkers Prev. 2008 Jan;17(1):158–62. doi: 10.1158/1055-9965.EPI-07-0436. [DOI] [PubMed] [Google Scholar]
- 16.Kennedy TC, Franklin WA, Prindiville SA, Cook R, Dempsey EC, Keith RL, et al. High prevalence of occult endobronchial malignancy in high risk patients with moderate sputum atypia. Lung Cancer. 2005 Aug;49(2):187–91. doi: 10.1016/j.lungcan.2005.02.009. [DOI] [PubMed] [Google Scholar]
- 17.Prindiville SA, Byers T, Hirsch FR, Franklin WA, Miller YE, Vu KO, et al. Sputum cytological atypia as a predictor of incident lung cancer in a cohort of heavy smokers with airflow obstruction. Cancer Epidemiol Biomarkers Prev. 2003 Oct;12(10):987–93. [PubMed] [Google Scholar]
- 18.Belinsky SA, Liechty KC, Gentry FD, Wolf HJ, Rogers J, Vu K, et al. Promoter hypermethylation of multiple genes in sputum precedes lung cancer incidence in a high-risk cohort. Cancer Res. 2006 Mar 15;66(6):3338–44. doi: 10.1158/0008-5472.CAN-05-3408. [DOI] [PubMed] [Google Scholar]
- 19.Palmisano WA, Divine KK, Saccomanno G, Gilliland FD, Baylin SB, Herman JG, et al. Predicting lung cancer by detecting aberrant promoter methylation in sputum. Cancer Res. 2000 Nov 1;60(21):5954–8. [PubMed] [Google Scholar]
- 20.Varella-Garcia M, Kittelson J, Schulte AP, Vu KO, Wolf HJ, Zeng C, et al. Multi-target interphase fluorescence in situ hybridization assay increases sensitivity of sputum cytology as a predictor of lung cancer. Cancer Detect Prev. 2004;28(4):244–51. doi: 10.1016/j.cdp.2004.04.007. [DOI] [PubMed] [Google Scholar]
- 21.Kennedy TC, Proudfoot SP, Franklin WA, Merrick TA, Saccomanno G, Corkill ME, et al. Cytopathological analysis of sputum in patients with airflow obstruction and significant smoking histories. Cancer Res. 1996 Oct 15;56(20):4673–8. [PubMed] [Google Scholar]
- 22.Romeo MS, Sokolova IA, Morrison LE, Zeng C, Baron AE, Hirsch FR, et al. Chromosomal abnormalities in non-small cell lung carcinomas and in bronchial epithelia of high-risk smokers detected by multi-target interphase fluorescence in situ hybridization. J Mol Diagn. 2003 May;5(2):103–12. doi: 10.1016/s1525-1578(10)60459-x. [DOI] [PMC free article] [PubMed] [Google Scholar]
- 23.Massion PP, Caprioli RM. Proteomic strategies for the characterization and the early detection of lung cancer. J Thorac Oncol. 2006 Nov;1(9):1027–39. [PubMed] [Google Scholar]
- 24.Ligor M, Ligor T, Bajtarevic A, Ager C, Pienz M, Klieber M, et al. Determination of volatile organic compounds in exhaled breath of patients with lung cancer using solid phase microextraction and gas chromatography mass spectrometry. Clin Chem Lab Med. 2009;47(5):550–60. doi: 10.1515/CCLM.2009.133. [DOI] [PubMed] [Google Scholar]
- 25.Yano T, Shoji F, Baba H, Koga T, Shiraishi T, Orita H, et al. Significance of the urinary 8-OHdG level as an oxidative stress marker in lung cancer patients. Lung Cancer. 2009 Jan;63(1):111–4. doi: 10.1016/j.lungcan.2008.04.014. [DOI] [PubMed] [Google Scholar]
- 26.Li R, Todd NW, Qiu Q, Fan T, Zhao RY, Rodgers WH, et al. Genetic deletions in sputum as diagnostic markers for early detection of stage I non-small cell lung cancer. Clin Cancer Res. 2007 Jan 15;13(2 Pt 1):482–7. doi: 10.1158/1078-0432.CCR-06-1593. [DOI] [PubMed] [Google Scholar]
- 27.Jiang F, Todd NW, Qiu Q, Liu Z, Katz RL, Stass SA. Combined genetic analysis of sputum and computed tomography for noninvasive diagnosis of non-small-cell lung cancer. Lung Cancer. 2009 Jan 30; doi: 10.1016/j.lungcan.2009.01.004. [DOI] [PMC free article] [PubMed] [Google Scholar]
- 28.Jonsson S, Varella-Garcia M, Miller YE, Wolf HJ, Byers T, Braudrick S, et al. Chromosomal aneusomy in bronchial high-grade lesions is associated with invasive lung cancer. Am J Respir Crit Care Med. 2008 Feb 1;177(3):342–7. doi: 10.1164/rccm.200708-1142OC. [DOI] [PMC free article] [PubMed] [Google Scholar]
- 29.Gandhi J, Zhang J, Xie Y, Soh J, Shigematsu H, Zhang W, et al. Alterations in genes of the EGFR signaling pathway and their relationship to EGFR tyrosine kinase inhibitor sensitivity in lung cancer cell lines. PLoS One. 2009;4(2):e4576. doi: 10.1371/journal.pone.0004576. [DOI] [PMC free article] [PubMed] [Google Scholar]
- 30.Garnis C, Lockwood WW, Vucic E, Ge Y, Girard L, Minna JD, et al. High resolution analysis of non-small cell lung cancer cell lines by whole genome tiling path array CGH. Int J Cancer. 2006 Mar 15;118(6):1556–64. doi: 10.1002/ijc.21491. [DOI] [PubMed] [Google Scholar]
- 31.Tonon G, Wong KK, Maulik G, Brennan C, Feng B, Zhang Y, et al. High-resolution genomic profiles of human lung cancer. Proc Natl Acad Sci U S A. 2005 Jul 5;102(27):9625–30. doi: 10.1073/pnas.0504126102. [DOI] [PMC free article] [PubMed] [Google Scholar]
- 32.Weir BA, Woo MS, Getz G, Perner S, Ding L, Beroukhim R, et al. Characterizing the cancer genome in lung adenocarcinoma. Nature. 2007 Dec 6;450(7171):893–8. doi: 10.1038/nature06358. [DOI] [PMC free article] [PubMed] [Google Scholar]
- 33.Zhao X, Weir BA, LaFramboise T, Lin M, Beroukhim R, Garraway L, et al. Homozygous deletions and chromosome amplifications in human lung carcinomas revealed by single nucleotide polymorphism array analysis. Cancer Res. 2005 Jul 1;65(13):5561–70. doi: 10.1158/0008-5472.CAN-04-4603. [DOI] [PubMed] [Google Scholar]
- 34.Qiu Q, Todd NW, Li R, Peng H, Liu Z, Yfantis HG, et al. Magnetic enrichment of bronchial epithelial cells from sputum for lung cancer diagnosis. Cancer. 2008 Aug 25;114(4):275–83. doi: 10.1002/cncr.23596. [DOI] [PMC free article] [PubMed] [Google Scholar]
- 35.Katz RL, Zaidi TM, Fernandez RL, Zhang J, He W, Acosta C, et al. Automated detection of genetic abnormalities combined with cytology in sputum is a sensitive predictor of lung cancer. Mod Pathol. 2008 Aug;21(8):950–60. doi: 10.1038/modpathol.2008.71. [DOI] [PMC free article] [PubMed] [Google Scholar]
Associated Data
This section collects any data citations, data availability statements, or supplementary materials included in this article.