

Abstract
Targeted therapies result in heterogeneous drug delivery, often with highly variable drug uptake in the targeted cells and significant numbers of cells that are essentially untargeted. However, both the variably targeted cells and neighboring bystander cells may respond to the treatment. Using ionizing radiation as an example of a targeted therapeutic agent, we describe a quantitative immunofluorescence-based approach for concomitant quantification of exposure and measurement of biological responses in both targeted and bystander cells. Cultures of human skin fibroblasts are co-pulse-labeled with 3H-deoxycytidine (3H-dC) and bromodeoxyuridine (BrdU). The labeled cells, identified by BrdU immunofluorescence, are internally irradiated by low-energy β-particles emitted by incorporated 3H-dC. BrdU immunofluorescence intensity is proportional to radioactivity incorporated and, therefore, to radiation dose rate. Cell-cycle arrest in G2 is measured in labeled cells as function of dose rate. Stress responses in bystander cells, indicated by a G1 checkpoint, are concomitantly measured with a flow cytometric-cumulative labeling index (FCM-CLI) assay. The overall approach presented herein may be useful in the context of evaluating responses to targeted drug delivery.
INTRODUCTION
Targeted drug delivery to a specific cell population invariably results in differential exposure to therapeutic agents at the cellular level. As a consequence, targeted cells will be variably affected by the therapeutic agent. In addition, it is now evident that biological effects may also occur in untargeted cells, as they respond to signals sent by their targeted neighbors (1,2). These bystander effects can be detrimental or beneficial in nature and have attracted interest in immunology, pharmacology, gene therapy, and targeted radiation therapy. Among the bystander effects reported are cell killing, DNA damage, induction of micronuclei, apoptosis, mutations, neoplastic transformation, chromosome aberrations, altered proliferation, and propagation of stress responses (3).
Approaches have been developed that permit noninvasive detection of drug intake at the subtissue level (4). Moreover, nanoparticles that encapsulate a drug together with a fluorescent marker show promise in lowering drug-detection limits to the cellular level (5). To improve our understanding of the response of multicellular systems to targeted therapies, it is necessary to quantify the amount of drug delivered to individual cells and measure the corresponding biological responses (6,7). In addition, responses in neighboring bystander cells should also be monitored. The present work describes a method that meets these criteria and serves as an example of the scientific potential of such approaches.
MATERIALS AND METHODS
Cultures
AG01522 primary human skin fibroblasts were obtained from the Coriell Cell Repository (Camden, NJ, USA), expanded to passage 10, and stored in liquid nitrogen. Cells were routinely cultured in Cellgro® minimum essential medium (MEM; Mediatech, Herndon, VA, USA) supplemented with uninactivated 12.5% v/v fetal bovine serum (FBS; Nova-Tech, Grand Island, NE, USA), 100 U/mL penicillin, 100 ng/mL streptomycin (Mediatech), and 2 mM L-glutamine (Invitrogen, Carlsbad, CA, USA). We refer to this complete medium preparation here as cMEM. For experiments, cells were grown as three-dimensional (3-D) cultures on Cytomatrix® carbon units (Cytomatrix, Chelmsford, MA, USA) and maintained in humidified air supplemented with 3% CO2 (8). cMEM was replaced on alternate days. Under these 3-D culture conditions, the distribution throughout the phases of the cell cycle was approximately G0/G1: G2/M:S = 90%:5%:5%, the length of S phase was 6.0 ± 0.5 h, and that of G2/M phase was 4.5 ± 0.5 h (flow cytometry determinations). G0/G1 phase length was not determined directly.
Cell Targeting and Dosimetry
Solutions of 10 μM BrdU (Sigma-Aldrich, St. Louis, MO, USA) were prepared in cMEM. 2′-deoxycytidine [5-3H(N); Moravek Biochemicals, Brea, CA, USA] was obtained at specific activity 855 GBq/mmol and diluted in cMEM to 185 kBq/mL. To radiolabel and thereby irradiate a small fraction of cells in the culture, the cultures were co-pulse-labeled for 3 h with 3H-deoxycytidine (3H-dC) and bromo-deoxyuridine (BrdU). Cultures were then washed six times with cMEM, harvested from the Cytomatrix using 0.25% w/v trypsin/EDTA (Mediatech), seeded at low density in culture dishes containing cMEM with 1 μM iododeoxyurdine (IdU; Fluka, Sigma-Aldrich), and harvested at various times for assessment of cumulative labeling index (CLI) in unlabeled bystander cells as previously described (8).
After washing cells free of extracellular radioactivity, a known number of cells were subjected to liquid scintillation counting for determination of average cellular activity. Since only a minor fraction of the cultured cells contains 3H-dC, the measured average millibecquerel per cell was converted to average millibecquerel per labeled cell, upon dividing the former by the fraction of BrdU-positive cells, as estimated by flow cytometry on parallel cultures. Assuming spherical cell nuclei with a 3.5-μm radius (9), average cellular radiation dose rates were calculated from cellular activity measurements using the cellular S value 4.09 × 10⁻³ Gy Bq s−1 (10).
To evaluate biological response of individual cells as function of radiation dose, the latter must be inferred from the intensity of BrdU immunofluorescence on a cell-by-cell basis. The pyrimidine nucleosides deoxythymidine (usually referred to as thymidine), deoxycytidine, and the thymidine analogue BrdU are known to be similarly incorporated into the DNA during S phase of the cell cycle. BrdU immunofluorescence intensity and incorporated 3H-dC activity both increase linearly as a function of concentration in the cMEM. Thus, BrdU immunofluorescence intensity can be correlated with intracellular 3H-dC activity, and therefore to dose rate in individual cells. This was achieved by means of the relationship , where is the dose rate to the cell nucleus (in cGy/h), F is the fluorescence intensity of a single cell that incorporated BrdU, a is a fitted parameter, and b is a negative offset to correct for autofluorescence and unspecific fluorochrome binding (zero radiation dose corresponds to a non-zero fluorescence intensity). Representative values are a = 0.053 and b = −1.6.
In this manner, BrdU incorporation can be used as a surrogate for determining incorporation of 3H-dC or 3H-deoxythymidine (3H-dT) into DNA, or for iodinated radiochemicals, such as 125IdU or 125iododeoxycytidine (IdC) (11,12). It should be noted, however, that BrdU incorporation cannot be used to indicate incorporation of tritiated deoxyguanosine (3H-dG) or deoxyadenosine (3H-dA), because purine nucleoside metabolism is significantly different from that of pyrimidine nucleosides and result in S phase independent and non-DNA-specific incorporation.
Flow Cytometry and Cell Sorting
Cells were washed in Hank’s balanced salt solution (HBSS; Sigma-Aldrich) and fixed in 70% v/v ethanol added dropwise while gently vortex mixing. Fixed cells were stored up to several months in 70% ethanol at −20°C without any appreciable loss of immunostaining intensity. The protocol for immuno detection of BrdU and IdU was adapted from Schutte et al. (13). All washes were done using 1% w/v bovine serum albumin (BSA; Promega, Madison, WI, USA) prepared in phosphate-buffered saline (PBS). To expose the sites of incorporation of BrdU/IdU, the DNA in the cells was denatured with 2 N HCl and 0.2 mg/mL pepsin (Sigma-Aldrich) for 15 min at 37°C and neutralized with 1 M Tris-HCl, pH 10.0. Approximately 1 × 10⁶ cells were then washed and reacted, when applicable, with 1:50 rat anti-BrdU monoclonal antibody (AbCam, Cambridge, MA, USA) in 0.5% v/v Tween® 20 (Sigma-Aldrich), 1% FBS, and 1% w/v BSA (designated Ab buffer). All antibody exposures were for 25 min at room temperature on a shaking platform. After washing, cells were immunoreacted, when applicable, with a mouse anti-BrdU/IdU monoclonal antibody (BD Biosciences, San Jose, CA, USA), washed, and immunoreacted with a mixture of 1:200 Alexa Fluor® 633-conjugated goat anti-rat immunoglobulin G (IgG) and 1:2000 Alexa Fluor 488-conjugated goat anti-mouse IgG (both from Invitrogen) in Ab buffer. After a final wash, cells were incubated in 5 mg/mL propidium iodide (Fluka) and RNase (Sigma; 117 Kunitz units/mL) in 1% w/v BSA for a minimum of 1 h at room temperature before flow cytometry. The concentration of each fluorochrome was optimized by multiple titration experiments to minimize spillover in other fluorescence channels.
For flow cytometry on a BD FACSCalibur™ instrument, Alexa Fluor 488 and Alexa Fluor 633 fluorescence were acquired in logarithmic amplification in FL1 and FL4, respectively, and PI fluorescence was acquired in linear amplification in FL2. Cell doublets were discriminated on FL2-height versus FL2-area plots (14). Software-based fluorescence spillover compensation (albeit minimal) was estimated using single-stained samples and the FlowJo compensation platform (version 7.1; Tree Star, Ashland, OR, USA). For cell-sorting experiments, a Becton Dickinson FACS Vantage™ with DiVa module was used.
It should be noted that the pepsin/HCl treatment used in the BrdU and IdU immunostaining procedures can be replaced by DNase treatment (15), which produces similar immunostaining results while preserving protein integrity for concomitant analysis.
Evaluation of G2 Arrest in Radiolabeled Cells
For evaluation of G2 arrest induced by irradiation with 3H β-particles in BrdU+ cells as function of BrdU immunofluorescence intensity, cultures were co-pulsed with BrdU and 3H-dC, fixed at several times thereafter, and prepared for flow cytometry. BrdU+ cells were divided in multiple regions as a function of their immunofluorescence intensity level. These regions were used to gate out populations that were examined for their DNA content using the DNA analysis platform implemented in the Flow Jo package (Dean-Jett-Fox DNA histogram fitting algorithm). The estimated fraction of G2/M events in radiolabeled cells was corrected by subtraction of the same estimate from sham-labeled cells in the same fluorescence intensity region, without any manipulation of the gating regions.
Validation of Quantitative Immunostaining of BrdU and IdU
Cells were pulse-labeled with 10 μM BrdU for 1 h, washed six times with cMEM for a total of 30 min, labeled with 2 μM IdU for 4 h, chased with cMEM for 10 min, harvested, fixed, and subjected to immunoflow cytometry as specified in the section entitled Flow Cytometry and Cell Sorting. Incorporation of IdU and BrdU was quantified and related to the position in the cell cycle at time of analysis with flow cytometry, as well as at time of pulse-labeling.
Validation of the Quantitative Relationship between BrdU and 3H-dC Incorporation
To verify the correspondence between BrdU and 3H-dC uptake in DNA, cells were co-pulse-labeled with 5 μCi/mL 3H-dC and 10 μM BrdU for 3 h, washed with cMEM, and fixed with 70% ethanol 17 h later. Cells were then subjected to immunostaining for BrdU, sorted on a BD FACS Vantage DiVa according to BrdU incorporation, and plated on 35-mm culture dishes for autoradiographic examination. The fraction of cells showing grains in the developed photographic emulsions was determined.
Validation of the FCM-CLI Assay
For validation of the CLI assay based on immunodetection of IdU with flow cytometry (i.e., the FCM-CLI assay), cells were pulse-labeled with 10 μM BrdU for 3 h and washed for 15 min. Cultures were then non-competitively co-pulsed with 37 kBq/mL 3H-dC and 1 μM IdU. After 17 h, cells were harvested, fixed, and prepared for immunostaining of BrdU and IdU as previously specified. BrdU-events were sorted on a fluorescence-activated cell sorter (FACS) based on low- and high-intensity Alexa Fluor 488 fluorescence, to indicate IdU− or IdU+ events, respectively. Sorted cells were plated for autoradiography, and the fraction of cells which presented grains in their nuclei on the developed photographic emulsions was determined in the IdU− and IdU+ cells.
Autoradiography
Adherent cell cultures were fixed in 70% ethanol, washed with distilled water, and layered with photographic emulsion (Type II; Eastman Kodak, Rochester, NY, USA). After incubation in light-tight boxes containing Drierite crystals at 4°C for 3–4 weeks to allow for decays, samples were developed, fixed, lightly stained with crystal violet, and observed at 600× magnification with a bright-field optical microscope.
RESULTS AND DISCUSSION
To demonstrate concomitant quantification of targeted drug delivery and biological response in individual cells, we show here how one can selectively target and irradiate actively proliferating cells with 3H-dC and identify these cells by co-labeling them with BrdU (Figure 1). The fraction of cells that are actively proliferating and labeled with BrdU and 3H-dC while in S phase of the cell cycle dictates what percentage of cultured cells will be targeted (8). The extremely short range (average range in tissue approximately 1 mm) of the β-particles emitted by 3H results in self-irradiation of the labeled cells and insignificant irradiation of neighboring unlabeled bystander cells (16). We demonstrate that BrdU immunofluorescence intensity is proportional to 3H-dC intake and, therefore, to the radiation dose rate imparted to the labeled cells. Biological effects at the level of perturbations in cell cycle progression are simultaneously evaluated in both radiolabeled and unlabeled bystander cells. Specifically, a radiation dose-dependent G2 checkpoint (17) is measured in radiolabeled cells, and induction of a stress-related G1 checkpoint is measured in unlabeled bystander cells. This is accomplished with an FCM-CLI assay (18) wherein incorporation of a second DNA precursor, IdU, is measured in cells that do not contain radioactivity (BrdU−) as they advance in the cell cycle through the G1 checkpoint and initiate DNA synthesis. Detection of IdU uptake specifically in BrdU− cells is enabled by thymidine analog immunodiscrimination (19), whereby one thymidine analog is used as a radiolabeling indicator (BrdU) and another as an indicator of biological response (IdU). We first demonstrate the specificity of all antibodies used (Figure 2) and then show that simultaneous immunodetection of both BrdU and IdU is quantitative (Figure 3). Finally, we prove that immunodetection of BrdU coincides with 3H-dC delivery and shows measurements of cell cycle progression in both variably radiolabeled and unlabeled bystander cells (Figure 4).
Figure 1. The experimental approach to concomitantly quantify drug delivery and biological responses in both targeted cells and untargeted bystander cells.
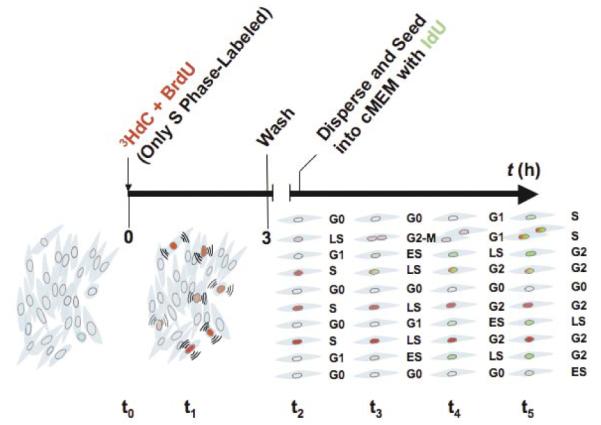
t0, three-dimensional (3-D) cultures are co-pulse-labeled with 3H-deoxycitidine (3H-dC) and bromodeoxyuridine (BrdU); t1, about 5% of the cells are in S phase and therefore radiolabeled. Cells are differentially radiolabeled (red) depending on the amount of time spent in S phase during the 3-h pulse-labeling. Targeted cells are irradiated and initiate signaling ((())) with unlabeled bystander cells. t2, to allow quiescent G0-unlabeled bystander cells to proliferate, cultures are harvested at various times after pulse-labeling and plated at lower density in the presence of iododeoxyuridine (IdU). t3, when bystander cells move from G0/G1 into S, they begin to incorporate IdU (light green). t4 and t5, as time elapses, cells in S phase incorporate more IdU (dark green) and additional cells enter S phase. A reduction in the rate of bystander cells progressing through the G1–S transition is indicative of a stress-response. Targeted cells that incorporate the lowest levels of 3H-dC/BrdU (light red) may proceed through G2 and undergo mitotic division, the others being arrested in G2 (dark red) in a dose-dependent manner. Radiolabeled cells can also take up IdU while in S phase (red/green). However, immunoflow cytometry discriminates incorporation of IdU from that of BrdU. Thus, the fraction of cells that overcome the G1 checkpoint and move through S phase to incorporate IdU, is determined specifically among bystanders. ES, early S phase; LS, late S phase; cMEM, complete minimal essential medium (see Materials and Methods section).
Figure 2. Evidence for specificity of primary and secondary antibodies.

(A–E) Red (Alexa Fluor 633) or green (Alexa Fluor 488) fluorescence. Bromodeoxyuridine (BrdU) was detected by both the (A) anti-BrdU antibody and the (B) anti-BrdU/IdU antibody; iododeoxyurdine (IdU) was essentially undetected with the (C) anti-BrdU antibody, while being detected by the (D) anti-BrdU/IdU antibody. Alexa Fluor 633 goat anti-rat immunoglobulin G (IgG) had a limited cross-reactivity with (E) mouse anti-BrdU/IdU antibody, while Alexa Fluor 488 goat anti-mouse showed no reactivity with the (F) rat anti-BrdU antibody. Data for one of two replicate experiments is shown.
Figure 3. Quantitative immunostaining of DNA-incorporated bromodeoxyuridine (BrdU) and iododeoxyurdine (IdU).

(Top left panel) density plot of BrdU versus BrdU/IdU fluorescence. The events gated in regions (A–E) are shown as DNA content histograms in the remaining panels. The position of the DNA histogram peaks can be compared quantitatively across panels A–E, as they reflect events gated out from the regions identified in the upper left panel. (A) High levels of BrdU reflect cells that were around the middle of S phase at the time of the BrdU pulse and therefore incorporated BrdU for the full hour it was administered. At the time of assay, the cells in the population were mostly in G2/M phase. (B) Intermediate levels of BrdU reflect cells that incorporated fewer BrdU molecules than in panel A because they were about to exit S phase when the BrdU pulse started. These cells could not incorporate the IdU that was administered later. Many of these cells had the time to divide and occupy the G0/G1 compartment, while the histogram is devoid of S phase events. (C) Intermediate levels of BrdU and high levels of BrdU/IdU reflect cells that were entering S phase toward the end of the time BrdU was being administered. There is a relatively low incorporation of BrdU in these cells but full incorporation of IdU as they progressed through S phase later; at the end of the IdU pulse they were all essentially in S phase. (D) Low-fluorescence intensity of both BrdU and BrdU/IdU correspond to cells that were either non-cycling (G0), or in early G1, or in G2 at the time of the BrdU pulse. (E) Low BrdU and high BrdU/IdU reflect cells which were in G1 during the BrdU pulse, but entered S phase only at the subsequent IdU pulse. These events appear to be in early S phase relative to the population gated in panel C. The relatively small peak at the G2/M position in panel E may reflect undiscriminated cell doublets. Data for one of two replicate experiments is shown.
Figure 4. Quantitative relationship between bromodeoxyuridine (BrdU) immunostaining and activation of a radiation-induced G2 checkpoint.

(A) Contour plot of BrdU (Alexa Fluor 633 fluorescence) versus DNA content (propidium iodide). Five regions are identified according to BrdU− immunofluorescence intensity. (B) Events from regions 1–4 were gated out and examined for the onset of a G2 checkpoint as function of mean dose rate to labeled cells. Error bars represent one standard deviation. (C) The a flow cytometric-cumulative labeling index (FCM-CLI) assay was run on unlabeled bystander cells (gated in region 5, panel A) to measure activation of the G1 checkpoint, relative to shamlabeling conditions. The two datasets were fitted to a sigmoid model function and their similarity statistically compared with an F-test (P value 0.99; Origin® 7.5 software; RockWare, Golden, CO, USA). Data for one of two replicate experiments is shown.
Primary and fluorochrome-conjugated secondary antibodies were tested for their specificity by immunoreaction with cells that were pulse-labeled with BrdU or IdU. The anti-BrdU antibody showed minimal reactivity with IdU, while the anti-BrdU/IdU antibody showed equal reactivity with both BrdU and IdU. Secondary antibodies also proved to be highly specific (Figure 2). Immunostaining was demonstrated to be quantitative for both IdU and BrdU (Figure 3), as BrdU and IdU are incorporated in varying amounts as function of time spent in S phase during pulse-labeling (i.e. cell cycle position at time of exposure). This is readily measured with immunofluorescence, demonstrating quantitative and specific detection of both thymidine analogs.
For verification of the correspondence between BrdU and 3H-dC uptake in DNA, autoradiograms of events sorted as BrdU+ (Figure 4A, regions 1–4) revealed that >93% of cells showed grains in the developed photographic emulsions. As a countercheck, only 2% of the cells sorted as BrdU− (no 3H-dC incorporated; Figure 4A, region 5) showed grains in the autoradiograms. Previous experiments indicated that the fraction of BrdU+ cells (measured with flow cytometry) corresponds to the 3H-dC-labeled fraction measured via autoradiography (8). Taken together, these results indicate that incorporation of BrdU marks incorporation of 3H in this system. Also, when evaluating the G2 arrest as a function of 3H-dC/BrdU incorporation, we found that the cells showing a more prominent radiation-induced G2 arrest corresponded to those with higher levels of BrdU incorporation (Figure 4, A and B). BrdU immunofluorescence intensity quantitatively correlates with BrdU incorporation (Figure 3), which in turn reflects incorporation of 3H-dC; and based on the fact that the G2 arrest is radiation dose-dependent in our experimental conditions, we concluded that BrdU immunofluorescence intensity is a quantitative indicator of exposure to 3H-dC. This allowed us to measure G2 delay in cells that were being irradiated at varying dose rates within the same sample (Figure 4B).
To validate our approach for concomitant measurements of perturbations of cell-cycle progression in unlabeled bystander cells, we verified that DNA incorporation of IdU by actively proliferating bystander cells could be used in this system as a substitute for 3H-thymidine in the classical autoradiography-based CLI assay (18). After cell sorting with flow cytometry, autoradiographic examination of cells that had been co-pulsed with IdU and 3H-dC showed that >98% of the IdU+ cells contained photographic grains, whereas only 2% of the IdU- cells had grains. Therefore, we concluded that the IdU-based FCM-CLI assay could be used to evaluate the onset of G1 checkpoints in bystander cells, relative to sham bystanders, when the bystander effect is signaled by adjacent cells that are being irradiated due to incorporation of 3H-dC. No significant bystander G1 checkpoint was observed when cells were released from the Cytomatrix 3 h after radiolabeling (Figure 4C). Similar findings were observed when cells were released from 2 to 48 h after radiolabeling (8).
We showed that BrdU immunofluorescence can be used to identify the radiolabeled cells and the amount of radioactivity incorporated (Figure 2 and Figure 3), and therefore the radiation dose rate (Figure 4B). This is a distinct advantage over previous approaches to identify radiolabeled cells in which they were dyed with a fluorescent tracer, such as carboxyfluorescein diacetate succinimidyl ester (CFDA) or lipophilic carbocyanine (DiI), before assembly with unlabeled cells (16,20,21). In the DiI/CFDA approach, cells were therefore not targeted in situ, and the amount of radioactivity in individual cells was not in proportion to fluorescence intensity. The present work also shows that, concomitant with quantitative detection of exposure to incorporated radioactivity and stress response (perturbations in cell-cycle progression) in radiolabeled cells, incorporation of IdU can be used to measure stress responses in untargeted bystander cells. The advantages of our approach are readily apparent. However, an experimental approach that delivers the tracer and drug in a single package may offer even further advantages (5). Use of fluorescent probes that do not require fixation could offer expanded opportunities to simultaneously detect other cellular markers of interest.
Although our method has been designed to investigate bystander responses in radiobiology, our general approach has broad applications to many scientific fields and to both in vitro cell culture and in vivo models. Even under highly controlled in vitro experimental conditions in which a clonal cell population is uniformly exposed to a drug or toxin, intake may be inhomogeneous (22). Accordingly, the biological response of the cells in the population may be highly variable. Even greater degrees of variability can be expected in vivo, where bystander effects are also attracting attention (23). Progress in single molecule detection in heterogeneously targeted cell populations could also take advantage of this approach. A number of assay technologies are readily amenable to approaches that use fluorescent markers to quantify uptake and response, among them, flow cytometry, laser scanning cytometry, laser capture microscopy, and confocal microscopy.
ACKNOWLEDGMENTS
We thank P. Neti, E.I. Azzam. M. Buonanno, S.M. de Toledo, B. Pandey, P. Venkatachalam, N. Asaad, and B.I. Gerashchenko for their constructive criticism. This work was supported by the National Institutes of Health grant no. R01CA83838 (to R.W.H.), a New Jersey Commission for Cancer Research postdoctoral fellowship (to M.P.), and a University of Medicine and Dentistry of New Jersey Foundation Scholarship (to M.P.). Finally, the authors greatly appreciate the support provided by T. Denny, L. Dong, and D. Stein at the core flow cytometry facility, which is supported, in part, by a U.S. Public Health Service shared instrumentation grant no. 1 S10 RR14753-01.
Footnotes
COMPETING INTERESTS STATEMENT The authors declare no competing interests.
REFERENCES
- 1.Lumniczky K, Safrany G. Cancer gene therapy: combination with radiation therapy and the role of bystander cell killing in the anti-tumor effect. Pathol. Oncol. Res. 2006;12:118–124. doi: 10.1007/BF02893457. [DOI] [PubMed] [Google Scholar]
- 2.Wright EG, Coates PJ. Untargeted effects of ionizing radiation: implications for radiation pathology. Mutat. Res. 2006;597:119–132. doi: 10.1016/j.mrfmmm.2005.03.035. [DOI] [PubMed] [Google Scholar]
- 3.Azzam EI, de Toledo SM, Little JB. Stress signaling from irradiated to non-irradiated cells. Curr. Cancer Drug Targets. 2004;4:53–64. doi: 10.2174/1568009043481641. [DOI] [PubMed] [Google Scholar]
- 4.Artemov D, Solaiyappan M, Bhujwalla ZM. Magnetic resonance pharmacoangiography to detect and predict chemotherapy delivery to solid tumors. Cancer Res. 2001;61:3039–3044. [PubMed] [Google Scholar]
- 5.Panyam J, Sahoo SK, Prabha S, Bargar T, Labhasetwar V. Fluorescence and electron microscopy probes for cellular and tissue uptake of poly(D,L-lactide-co-glycolide) nanoparticles. Int. J. Pharm. 2003;262:1–11. doi: 10.1016/s0378-5173(03)00295-3. [DOI] [PubMed] [Google Scholar]
- 6.Kvinnsland Y, Stokke T, Aurlien E. Radioimmunotherapy with alpha-particle emitters: microdosimetry of cells with a heterogeneous antigen expression and with various diameters of cells and nuclei. Radiat. Res. 2001;155:288–296. doi: 10.1667/0033-7587(2001)155[0288:rwapem]2.0.co;2. [DOI] [PubMed] [Google Scholar]
- 7.Editorial Going single, but not alone. Nat. Methods. 2006;3:581. doi: 10.1038/nmeth0806-581. [DOI] [PubMed] [Google Scholar]
- 8.Pinto M, Azzam EI, Howell RW. Bystander responses in three-dimensional cultures containing radiolabelled and unlabelled human cells. Radiat. Prot Dosimetry. 2006;122:252–255. doi: 10.1093/rpd/ncl460. [DOI] [PMC free article] [PubMed] [Google Scholar]
- 9.Raju MR, Eisen Y, Carpenter S, Jarrett K, Harvey WF. Radiobiology of alpha particles. IV. Cell inactivation by alpha particles of energies 0.4-3.5 MeV. Radiat. Res. 1993;133:289–296. [PubMed] [Google Scholar]
- 10.Goddu SM, Howell RW, Bouchet LG, Bolch WE, Rao DV. MIRD Cellular S values: self-absorbed dose per unit cumulated activity for selected radionuclides and monoenergetic electron and alpha particle emitters incorporated into different cell compartments. Society of Nuclear Medicine; Reston, VA: 1997. [Google Scholar]
- 11.National Council on Radiation Protection and Measurements (NCRP) Tritium and other radionuclide labeled organic compounds incorporated in genetic material. NCRP; Washington, DC: 1979. NCRP Report 3. [Google Scholar]
- 12.Feinendegen LE. Tritium-Labeled Molecules in Biology and Medicine. Academic Press; New York: 1967. [Google Scholar]
- 13.Schutte B, Reynders MM, van Assche CL, Hupperets PS, Bosman FT, Blijham GH. An improved method for the immunocytochemical detection of bromodeoxyuridine labeled nuclei using flow cytometry. Cytometry. 1987;8:372–376. doi: 10.1002/cyto.990080405. [DOI] [PubMed] [Google Scholar]
- 14.Wersto RP, Chrest FJ, Leary JF, Morris C, Stetler-Stevenson MA, Gabrielson E. Doublet discrimination in DNA cell-cycle analysis. Cytometry. 2001;46:296–306. doi: 10.1002/cyto.1171. [DOI] [PubMed] [Google Scholar]
- 15.Gonchoroff NJ, Katzmann JA, Currie RM, Evans EL, Houck DW, Kline BC, Greipp PR, Loken MR. S-phase detection with an antibody to bromo-deoxyuridine. Role of DNase pretreatment. J. Immunol. Methods. 1986;93:97–101. doi: 10.1016/0022-1759(86)90438-2. [DOI] [PubMed] [Google Scholar]
- 16.Bishayee A, Rao DV, Howell RW. Evidence for pronounced bystander effects caused by nonuniform distributions of radioactivity using a novel three-dimensional tissue culture model. Radiat. Res. 1999;152:88–97. [PMC free article] [PubMed] [Google Scholar]
- 17.Maity A, McKenna WG, Muschel RJ. The molecular basis for cell cycle delays following ionizing radiation: a review. Radiother. Oncol. 1994;31:1–13. doi: 10.1016/0167-8140(94)90408-1. [DOI] [PubMed] [Google Scholar]
- 18.Nagasawa H, Keng P, Maki C, Yu Y, Little JB. Absence of a radiation-induced first-cycle G1-S arrest in p53+ human tumor cells synchronized by mitotic selection. Cancer Res. 1998;58:2036–2041. [PubMed] [Google Scholar]
- 19.Vega CJ, Peterson DA. Stem cell proliferative history in tissue revealed by temporal halogenated thymidine analog discrimination. Nat. Methods. 2005;2:167–169. doi: 10.1038/nmeth741. [DOI] [PubMed] [Google Scholar]
- 20.Howell RW, Bishayee A. Bystander effects caused by nonuniform distributions of DNA-incorporated 125I. Micron. 2002;33:127–132. doi: 10.1016/s0968-4328(01)00007-5. [DOI] [PMC free article] [PubMed] [Google Scholar]
- 21.Gerashchenko BI, Howell RW. Flow cytometry as a strategy to study radiation-induced bystander effects in co-culture systems. Cytometry. 2003;54A:1–7. doi: 10.1002/cyto.a.10049. [DOI] [PubMed] [Google Scholar]
- 22.Neti PV, Howell RW. Log normal distribution of cellular uptake of radioactivity: implications for biologic responses to radiopharmaceuticals. J. Nucl. Med. 2006;47:1049–1058. [PMC free article] [PubMed] [Google Scholar]
- 23.van Dillen IJ, Mulder NH, Vaalburg W, de Vries EF, Hospers GA. Influence of the bystander effect on HSV-tk/GCV gene therapy. A review. Curr. Gene Ther. 2002;2:307–322. doi: 10.2174/1566523023347733. [DOI] [PubMed] [Google Scholar]