

Abstract
G-protein coupled receptor (GPCR) kinase 2 interacting protein-1 (GIT1) is a scaffold protein expressed in various cell types including neurons, endothelial and vascular smooth muscle cells. The GIT1 knockout (KO) mouse has a pulmonary phenotype due to impaired endothelial function. Because GIT1 is tyrosine phosphorylated by Src kinase, we anticipated that GIT1 KO should have a bone phenotype similar to Src KO. Microcomputed tomography of the long bones revealed that GIT1 KO mice have a 2.3-fold increase in bone mass compared to wild-type controls. Histomorphometry showed increased trabecular number and connectivity suggesting impaired bone remodeling. Immunoblot analysis of GIT1 expression showed that it was expressed in both osteoclasts and osteoblasts. Osteoblast activity and function assayed by alkaline phosphatase, mineral nodule formation and in vivo calcein labeling were normal in GIT1 KO mice suggesting that the observed increase in bone mass was due to an osteoclast defect. GIT1 KO bone marrow cells differentiated into multinucleated osteoclasts, but had defective bone resorbing function on dentin slices. This defect was likely caused by loss of podosome belt based on immunofluorescence analysis and previous studies showing that GIT1 is required for podosome formation. Furthermore, we found that GIT1 was a regulator of Receptor activator of NFκB (RANK) signaling since it was tyrosine phosphorylated in a Src dependent manner and was required for phospholipase C-γ2 phosphorylation. These data show that GIT1 is a key regulator of bone mass in vivo by regulating osteoclast function, and suggest GIT1 as a potential target for osteoporosis therapy.
Keywords: GIT1, Src kinase, osteoclast function, bone mass
Introduction
GPCR kinase 2 interacting protein (GIT1) is a multi-domain scaffold protein. We identified GIT1 as a Src substrate regulating phospholipase Cγ (PLCγ) activity upon angiotension II (Ang II) stimulation in vascular smooth muscle cells (VSMC) (Haendeler et al., 2003). The major functions of GIT1 involve actin cytoskeleton organization, receptor trafficking and endocytosis. Structurally, GIT1 consists of an N-terminal ARF-GAP domain, Spa homology domain (SHD), ankyrin repeats, synaptic localization domain (SLD) and paxillin-binding site (PBS). GIT1 interacts with a number of signaling molecules through these domains and spatially regulates their localization (Hoefen and Berk, 2006). The biological functions of GIT1 are diverse. We have previously shown that GIT1 regulates postnatal lung development by regulating lung vasculature (Pang et al., 2009) and is involved in dendritic spine formation and cognition in the brain (Menon P et al., 2010). GIT1 is also upregulated in atherosclerotic plaques (Slevin M et al., 2006) and regulates endothelial cell (EC) and VSMC migration (Wang et al., 2008; Yin et al., 2005). But the physiological role of GIT1 in bone homeostasis and in the skeleton system is unknown.
Bone homeostasis is a metabolic process required to maintain bone structure and function during adult life. It is a continuous process balanced by the catabolic bone resorbing activity of osteoclasts (OCs) and the anabolic mineralized bone matrix deposition activity of osteoblasts (OBs). OCs are hematopoietic cells from the monocyte/macrophage lineage, which differentiate into multinucleated cells (MNCs) upon stimulation with receptor activator of NF-κB ligand (RANKL) and macrophage colony stimulating factor (M-CSF) (Teitelbaum, 2007). In pathological conditions such as rheumatoid arthritis, Paget’s disease and multiple myeloma, an increase in OC function is observed leading to excessive bone loss, while a decrease in OC function results in increased bone density leading to poor bone quality and a high fracture risk (Boyle WJ, 2003).
When attached to the bone matrix, OCs polarize and undergo actin cytoskeletal reorganization resulting in formation of the sealing zone. The sealing zone isolates an area on the bone surface called the resorption lacunae where bone degradation occurs (Väänänen, 2005). Podosomes, which are F-actin rich structures present in ECs, fibroblasts, and melanoma cells, are involved in cell migration and invasion. In OCs, they fuse to form podosome belts (actin rings) at the cell periphery and are required for bone resorbing activity. Interestingly, podosome belts are reminiscent of the sealing zone that is formed by active OCs on hydroxyapaptite containing bone matrix (Linder and Aepfelbacher, 2003). Actin cytoskeleton organization and formation of the sealing zone are events downstream of RANK and integrin receptor signaling which are regulated by actin regulatory proteins, such as Src kinase (Boyce et al., 1992), Pyk2 (Gil-Henn H et al., 2007), PLC-γ2 (Epple et al., 2008) and Vav3 (Faccio R et al., 2005). In context of these reports, all of these molecules have been shown to be important for OC function. Thus, genetic deletion of these proteins in mice leads to increases in bone density, highlighting the importance of actin regulatory proteins in OC function.
We previously established that GIT1 localizes to podosomes in human umbilical vein endothelial cells (HUVEC) (Wang et al., 2008). Knockdown of GIT1 in HUVEC significantly decreased the number of cells exhibiting podosomes, implicating GIT1 as essential for podosome formation. OCs, which alternate between the resorptive and migratory phases during bone remodeling, require their actin cytoskeleton reorganization to be functionally active. Hence, we hypothesized that GIT1 regulates OC function and bone homeostasis through direct modulation of podosome formation. Addressing this hypothesis, we provide evidence that genetic deletion of GIT1 in mice results in increased bone mass due to disorganized podosome belt formation in OCs resulting in impaired bone resorption. Furthermore, we show that GIT1 functions downstream of RANK signaling in a Src dependent manner and regulates PLC-γ2 phosphorylation.
Materials and Methods
Generation of GIT1 KO mice
GIT1 KO mice (C57/BL6) were generated as described in Pang et al (Pang et al., 2009). Chimeric mice generated were backcrossed for more than 7 generations. Genotyping was performed by PCR analysis on DNA samples isolated from tail chips. All studies were performed according to the National Institute of Health guidelines using an approved institutional protocol.
Histology and MicroCT analysis
For histology, femur bones of 10-12 week old mice were fixed in 3.7% formaldehyde overnight, decalcified in 0.5 M EDTA (pH 7.4) for 10 days, paraffin embedded and sectioned at 6 microns (μm). The tissue sections were stained with hematoxylin and eosin (H&E) or TRAP (Acid leukocyte kit, Sigma, St. Louis, MO, USA) according to standard protocols. For micro CT, un-delcalcified femur bones were subjected to scanning using micro CT scanner (Viva Ct 40,Scano Medical AG, Swizerland) at 10 μm resolution to obtain 3D images. Femur sections were scanned from the growth plate regions and extended in the proximal regions for approximately 400 slices. Morphometric analysis was performed on 200 slices. The three dimensional structures were constructed and the bone morphometric parameters were analyzed. The parameters include percentage of bone volume (BV) /total volume (TV) [BV/TV%], number of trabeculae per mm [Tb.N], trabecular space or marrow space [Tb.space, mm], trabecular thickness [Tb.Thickness, mm] and trabecular connectivity density per mm3 [Conn. Density (1/mm3)].
Osteoclast and Osteoblast cultures
For OC cultures, bone marrow [BM] cells were isolated from femur bones of 10-12 week old mice.1 × 106 cells were seed in 12 well dishes and cultured in minimum essential medium (α-MEM) (Gibco) with 10% heat inactivated fetal bovine serum (FBS), 1% penicillin/streptomycin, 1 % non essential amino acids, M-CSF (20 ng/ml, Sigma), and RANKL (50 ng/ml, R&D) for 7-8 days with media change every 48 hrs. Cells were washed once with PBS, fixed in 3.7 % formaldehyde for 10 min and TRAP stained according to the protocol. TRAP-positive cells with nuclei ≥ 3 were counted as OC. For OC precursors, cells were serum starved for 4-6 hrs on Day 5 and stimulated with 100 ng/ml RANKL unless otherwise mentioned. For OB culture, cells seeded at a density of 2 × 10⁶ in 6 well dishes and grown in media without any cytokines. From Day 3 onwards, culture media was supplemented with 10 mM β-glycerophosphate (Calbiochem), and 5 μg/ml ascorbic acid (Sigma) with media change every 3 days. On Day 14 and Day 21, cells were fixed in 10% neutral buffered formalin. ALP staining and alizarin-red stain were performed as described in van der Eerden et al (van der Eerden et al., 2005) . Briefly, for ALP staining cells were incubated in Tris-HCl, pH 9.5 containing 0.5M MgCl2, 0.6 mg/ml bromo-chlorp-indoryl-phoshopate (BCIP, Sigma) and 150 μg/ml nitro blue tetrazolium (Sigma) for 30 mins at 37°C and washed with PBS. Alizarin red staining was performed by incubating the cells with saturated alizarin-red solution in 95% ethanol for 15 mins. After the incubation, the cells were washed with distilled water. The number of ALP and alizarin-red positive colonies were counted with a microscope and expressed a percentage relative to control.
In vivo Calcein labeling
Calcein (Sigma) was prepared in 1.4% solution of sodium carbonate in distilled water. Mice were injected intraperitoneally at a dose of 25 mg/kg on Day 0 and Day 7. Animals were sacrificed on Day 14. Femurs were isolated, fixed in 75% ethanol and the non-decalcified bones were embedded in plastic. Transverse sections were cut at 3 μm thickness and unstained sections were viewed by fluorescence microscope (Olympus BXL microscope, Olympus, Tokyo, Japan). Analysis of fluorescent labeled images was carried out in Image-Pro program as described in Bajayo et al (Bajayo et al., 2005). The terminology and units used were in accordance with the convention of standardized nomenclature.
Immunoprecipitation and Western Blotting
BM cells at different time points were washed once with PBS and lysed with RIPA buffer (150 mM NaCl, 1% Nonidet P-40, 0.5% deoxycholic acid, 0.1% SDS, 50 mM Tris-HCl, pH 8.0) containing protease inhibitor cocktail (1:1000, Sigma). Lysates were centrifuged for 5 min, 8000 rpm, 4° C to remove cell debris. Protein concentrations were determined by Bradford protein assay. For immunoblotting, protein samples (20 μg) were boiled for 5 min in 2X SDS sample buffer and separated by SDS-PAGE, transferred to nitrocellulose membranes (Life Sciences, Pall Corporation), blocked and incubated with appropriate primary antibodies. For immunoprecipitation, Raw 264.7 cells were treated with RANKL (50 ng/ml) for 4 days to induce OC formation, serum starved for 4-6 hrs and stimulated with 100 ng/ml RANKL. Protein samples (500μg -1 mg) were precleared for 1 hour at 4°C, treated for 3hrs with indicated antibodies at 4°C and incubated with protein agarose beads overnight. The beads were washed 3 times with lysis buffer, boiled for 5 min in 2X SDS sample buffer, separated by SDS-PAGE, transferred to nitrocellulose membranes and blocked. After incubating with fluorescence-conjugated secondary antibodies (Alexa Fluor), immunoreactive proteins were visualized by Odyssey infrared imaging system (LI-COR Biotechnology, Nebraska). GIT1, GIT2, PLCγ2, Src and actin were from Santa Cruz Biotechnology, phospho antibodies [pJNK, p-p38, p-Erk1/2, p-IKBalpha and p-PLCγ2 (Y759)] and were from Cell signaling; 4G10 phosphotyrosine antibody was from Millipore. Results were normalized by arbitrarily setting the densitometry of control samples to one.
Immunofluorescence
BM cells or RAW 264.7 cells were cultured on 24 well dishes at a density of 5× 10⁵ cells on glass cover slips with RANKL (50 ng/ml) and MCSF (20 ng/ml) to induce OC formation. Cells were washed with PBS, fixed in 3.7% formaldehyde for 5 mins, permeabilized with 0.1% triton X-100 and rinsed again in PBS. The cells were blocked in 5% goat serum for 1 hr and stained for antibodies against GIT1 (1: 500, Invitrogen), Src GD11clone (1: 500,Upstate Biotechnology), PLCγ2 (1: 500), phospho-PLCγ2 Y759 (1:500) overnight in 1% goat serum. The cells were then washed, immunostained with Alexa Fluor secondary antibodies (Molecular probes, Eugene, OR, USA). Rhodamine-Phallodin (Invitogen) and DAPI (Invitrogen) were used to visualize actin rings and nuclei respectively. Images were taken using Olympus BXL microscope (Olympus, Tokyo, Japan). The acquisition time for the images were kept constant at all times.
Bone resorbtion assay
Bone resorbtion was assayed by measuring the ability of OC cultured on bovine cortical slices (4.4 × 4.4 × 0.2 mm) to form resorption pits. Approximately 104 cells per well in 96-well plates were cultured on top of bone slices containing 0.2 ml alpha MEM media along with MCSF (20 ng/ml) and RANKL (50 ng/ml) for 7-8 days to induce osteoclast formation (Day 0). On the second day, half the media was replaced. Subsequently, media with added factors was replaced every second day. On Day 7-8, bone slices were rinsed with PBS and treated with 0.2 % sodium hydroxide to disrupt the cell attachement from bone matrix. The bone slices were then vigorously washed with PBS and stained with 1% toluidine blue for 4 hrs at room temperature. The washes were repeated with PBS. The resorption pits formed were visualized by light microscopy. Images were taken using Olympus BXL microscope. Pit area was traced using Image J analysis and quantified as percentage to control.
Statistical Analysis
All experimental values are expressed as mean ± SEM from three or more independent experiments. The significance of the results was assessed by two-tailed unpaired student’s t-test. A p value of < 0.05 was considered statistically significant.
Results
GIT1 regulates bone mass in vivo
To analyze bone mass, we first performed three-dimensional microstructural analysis using high-resolution microcomputed tomography (micro CT). We harvested long bones (femora) of 10-12 week old sex matched GIT1 WT and KO mice. The size and shape of the femur bones was normal in GIT1 KO mice. However, microCT analyses revealed an increase in trabecular bone mass in GIT1 KO compared to WT control mice (Fig. 1A). Bone morphometric analysis of the percentage (%) of bone volume (BV) to total bone volume (TV) [(BV/TV)%] showed a 61% increase in GIT1 KO compared to WT littermate controls (Fig 1B, p=0.0002*). A significant increase in trabecular number (Fig 1C, p<0.0001*) and trabecular connectivity density (Fig 1D, p=0.0008*) was observed in GIT1 KO mice. Due to increased trabecular number and connectivity, the trabecular space (bone marrow space) in GIT1 KO mice was significantly smaller (Fig 1E, p<0.0001*). No significant changes in the trabecular bone thickness (Table S1) were observed although some of the trabeculae showed a slight transition from rod to plate-like structure. Cortical bone parameters were unaltered in GIT1 KO mice (data not shown). Histological examinations of the femora further confirmed the increase in trabecular number and connectivity density in GIT1 KO mice compared to GIT1 WT controls (Fig. 1F,G arrows). It should be noted that the growth plate regions in GIT1 KO mice were similar to WT growth plates, suggesting that chondrocytic cells involved in endochondral ossification were unaffected. Overall, these results demonstrate that the deletion of GIT1 in vivo leads to an increase in bone mass suggesting a role for GIT1 in the maintenance of skeletal homeostasis.
Fig. 1. GIT1 KO mice have increased bone mass.
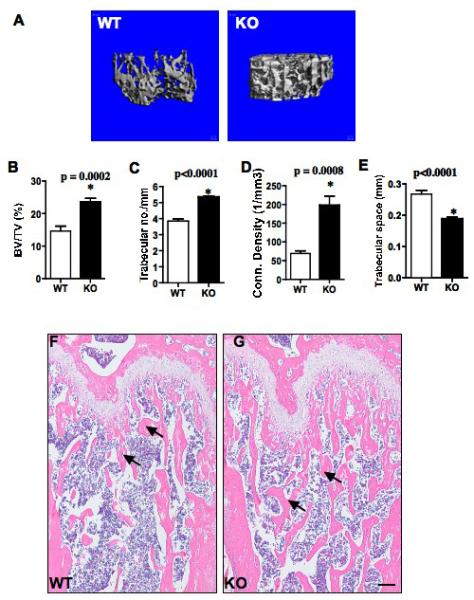
(A) Three dimensional microCT analysis of the long bones from 10-12 week old sex matched GIT1 WT and KO mice. Wt n=9; KO n=8. (B-E) Bone morphometric analysis of the long bones from GIT1 WT and KO mice. BV/TV%: percentage of bone volume (BV)/total volume (TV); Conn. Density (1/mm3): Connectivity density per mm3. All values are expressed as mean ± SEM. Data analysis was done by two-tailed unpaired student’s t-test. A p<0.05 was considered to statistically significant. (F) Longitudinal sections of femur bones of GIT1 WT and KO mice stained with H&E. Trabecular bone number and connectivity are greater in GIT1 KO femurs compared to WT controls as indicated by arrows. (Scale bar: 20 μm) n=3 per group.
GIT1 KO mice have normal osteoclast number
Increased bone mass in GIT1 KO mice could be the consequence of either decreased OC function or increased OB function. To understand the bone cell type involved, we first determined GIT1 expression in OC during osteoclastogenesis (OC differentiation) using Western blot analysis (Fig.S1 A). GIT1 was not detected in naïve BM cells derived from WT mice (Day 0). Following induction of OC differentiation by treatment with RANKL and MCSF, GIT1 expression progressively increased between Day 5 and Day 10. As expected, we did not detect GIT1 expression in GIT1 KO BM cells at Day 7 (Fig 2A) or at any time point during differentiation. We next analyzed OC formation in vivo by tartarate-resistant acid phosphotase (TRAP) assay on GIT1 WT and KO femur sections (Fig 2B,C). Quantitative analysis of the number of OC per mm2 revealed that OC number was comparable between GIT1 WT and KO mice (WT= 10 ±1, KO = 11±2; p>0.05). This suggests that OC formation was not affected in GIT1 KO mice. To determine whether OC function was impaired we stained for un-remodeled cartilage using alcian blue/orange eosin stain in the femur sections of GIT1 WT and KO mice (Fig 2D,E). Increased cartilage remnants were detected in the trabeculae of 10-week old GIT1 KO mice compared to WT controls (Fig 2E, arrows). This may be due to defective resorption of the cartilage during the bone remodeling. These data suggest that OC function may be impaired in GIT1 KO OC leading to an increase in bone mass.
Fig. 2. GIT1 KO mice have normal osteoclast number.
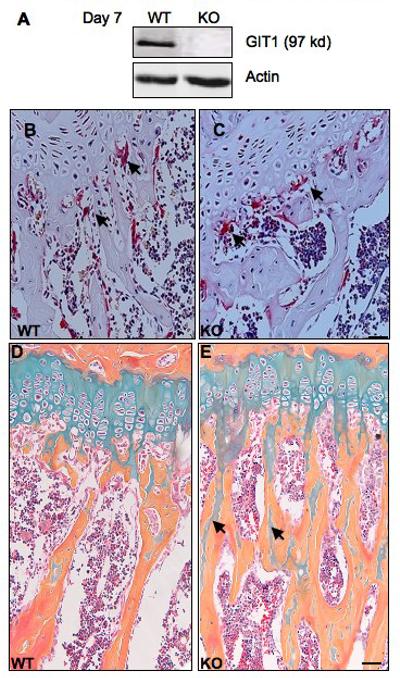
(A) BM cells from GIT1 WT were differentiated into OC with MCSF (20 ng/ml) and RANKL (50 ng/ml). Cell lysates were harvested on day 7 and protein expression probed using GIT1 antibody. GIT1 KO OC did not show GIT1 protein expression. Actin serves as loading control. (B,C) TRAP stain in the femur sections of GIT1 WT and KO mice. OC per mm2 were quantified using light microscopy. WT= 10±1; KO= 11± 2. Values are expressed as mean ± SEM (n=3) Scale bar: 50μm. (D,E) GIT1 WT and KO femur sections were stained with alcian blue to visualize cartilage and counterstained with Orange O-eosin for bone. Note increased presence of cartilage remnants (blue) in the trabecular bone (orange) in GIT1 KO mice (E, arrows) (Scale bar: 20 μm, n=3).
GIT1 deficiency impairs osteoclast function
We next investigated whether GIT1 is required for OC differentiation by using an in vitro TRAP assay (Fig. 3A-D). Like WT cells, treatment of GIT1 KO BM cells with cytokines, was able to induces differentiation into TRAP positive MNCs (nuclei ≥ 3) when plated on culture dishes (Fig 3A,B, arrows) or dentin slices (Fig 3C,D, arrows). The number of OCs formed was comparable between GIT1 WT and KO (WT= 80±10, KO=75 ±12, p>0.05) mice. Since GIT1 was expressed in precursor cells (Day 5, Fig.S1 A), we further examined the activation of signaling molecules in OC precursor cells required for OC differentiation. Upon stimulation with RANKL, phosphorylation of JNK, ERK1/2, p-38,A KT, and IkBα were not significantly affected by loss of GIT1 (Fig.S1 B). This suggests that GIT1 deletion does not affect differentiation from OC precursor cells. We next examined the ability of GIT1 WT and KO OC to resorb bone using a bone resorption assay (Fig 3E,F). BM cells were cultured with RANKL and MCSF on dentin slices for 7-8 days to induce OC formation. Resorption pits were viewed by staining with toludiene blue. Pit areas were traced and quantified using Image J program. Quantitative analysis of the percentage of pit area resorbed by GIT1 KO OCs was decreased by 65% relative to WT controls (Fig. 3G, p=0.0078*). These results suggest that the main role of GIT1 in OC is to support bone resorption. To gain further insight into whether deletion of GIT1 impairs OC actin cytoskeleton formation, F-actin rings were visualized with fluorescently labeled rhodamine-phallodin (Fig 3H,I). In WT OC F-actin was organized in podosome belts in the cell periphery (Fig 3H). In contrast, GIT1 KO OC had loss of podosome belts with F-actin localization in punctate podosome clusters in the cell periphery and throughout the cell (Fig 3I). Nuclei stained with DAPI (blue) in GIT1 KO OCs did not show nuclear condensation or fragmentation characteristic of apoptotic cells. Quantification of the normal podosome belts revealed a 60% decrease in GIT1 KO cells compared to WT controls (Fig 3J, p<0.05*). Taken together, these data show that while deletion of GIT1 does not impair osteoclastogenesis, it is required for appropriate podosome belt formation and functional integrity of OC.
Fig. 3. GIT1 deficiency impairs osteoclast function.
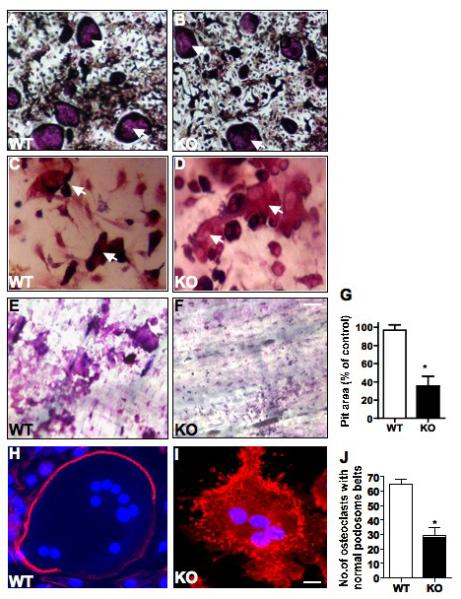
GIT1 WT and KO BM cells were differentiated into OC for 7 days on (A,B) culture dish and (C,D) dentin slices. Cells were fixed, TRAP stained and TRAP positive cells greater than 3 nuclei (arrows) were quantified using a light microscope (WT= 80±10, KO=75 ±12, p>0.05). (E, F) Resorbtion pits on dentine slices were examined by toludiene stain after removing OCs. (G) Quantitative analysis of the pit area volume as percentage of control showed a 65% decrease in GIT1 KO OC. (H, I) GIT1 WT and KO OC were fixed on day 7 and stained for F-actin rings using rhodamine phalloidin. In WT OC, F-actin (red) was organized in podosome belts (H) while GIT1 KO OC showed loss of podosome belts (I). Nuclei (blue) were stained with DAPI to identify multinucleated cells. (Scale bar: 15 μm) (J) Quantitative analysis of number of normal podosome belts in GIT1 WT and KO OC showed a 60% decrease in GIT1 KO OC. A total of 70 OC were counted from three individual experiments. All values are expressed as mean ± SEM. (n=3). Data analysis was done by two-tailed unpaired student’s t-test. A p<0.05 was considered statistically significant.
GIT1 functions downstream of RANK signaling in osteoclast
We previously showed that GIT1 is tyrosine (Y) phosphorylated in a Src dependent manner and this posttranslational event is important for signal transduction mediated events (Haendeler et al., 2003; Pang et al., 2008; van Nieuw Amerongen et al., 2004). Since GIT1 is weakly expressed in OC precursor cells (Day 5, Fig. S1 A), we examined whether GIT1 is phosphorylated in mature OCs (Day 7) in response to RANKL treatment. We used 4G10 phosphotyrosine antibody to identify GIT1 tyrosine phoshorylation (Fig 4A). GIT1 was phosphorylated between 5 and 15 mins upon stimulation with RANKL in WT BM OCs. Basal GIT1 phosphorylation was also observed without RANKL, suggesting that some GIT1 exists in a basally phosphorylated state. As expected, no phosphorylated GIT1 was detected in GIT1 KO OCs. To confirm our results, we used RAW 264.7 cells that, upon stimulation with RANKL form multinucleated OCs. In RAW 264.7 cells, GIT1 expression progressively increased between Day 2 and Day 4 upon RANKL treatment (Fig.S2 A). Immunoblotting total cell lysate (Fig.S2 B) and immunoprecipitation using 4G10 antibody (Fig.S2 C), demonstrate that GIT1 phosphorylation increased at 5 mins. These data suggests that GIT1 functions downstream of RANKL/RANK signaling. Since Src kinase is activated downstream of RANK (Wong et al., 1999), we next investigated whether GIT1 is phosphorylated in a Src dependent manner. Treatment with Src inhibitor PP2 significantly decreased GIT1 tyrosine phosphorylation basally and upon RANKL stimulation in GIT1 WT OCs (Fig 4B) and in RAW 264.7 cells (Fig. S2 D). Since GIT1 is a scaffold protein we next hypothesized that GIT1 regulates Src specific signaling pathways. We previously showed that GIT1 is a scaffold protein for PLCγ in VSMC (Haendeler et al., 2003) and EC (Wang et al., 2008). We focused on PLCγ2 isoform in OC since this isoform is predominantly tyrosine phosphorylated downstream of RANK signaling (Mao et al., 2006). Indeed, phosphorylation of PLCγ2 was attenuated in GIT1 KO OCs (Fig 4C). These data suggest that GIT1, downstream of RANK signaling regulates phosphorylation of PLCγ2.
Fig. 4. GIT1 functions downstream of RANK signaling.
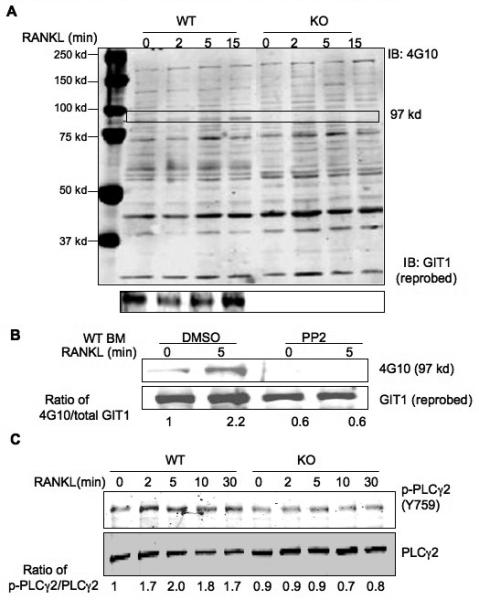
(A) GIT1 WT and KO BM cells were differentiated into OC by treatment with RANKL (50 ng/ml) and MCSF (20 ng/ml) for 7 days. Cells were serum starved for 6 hrs, stimulated with 100 ng/ml RANK for the indicated times. Cell lysates were harvested and probed with 4G10 phosphotyrosine antibody to visualize GIT1 phosphorylation (97 kd, arrow). Blots were then probed for GIT1 expression. (B) WT BM OC were treated with Src inhibitor PP2 (10 μM for 1 hr), stimulated with 100 ng/ml RANKL for 5 mins. GIT1 phosphorylation was probed using 4G10 antibody. Blots were reprobed for GIT1 expression. (C) GIT1 WT and KO OC on day 7 were starved and treated with RANKL (100 ng/ml) for indicated times. Lysates were immunoblotted with phoshorylated specific PLCγ2 (Y759) antibody (p-PLCγ2 Y759). Fold induction of normalized, phosphorylated protein vs time 0 of the control are shown.
GIT1 is involved in osteoclast podosome belt formation
Since it has been established that GIT1 is spatially involved in cytoskeletal arrangement and podosome formation in EC (Wang et al., 2008), we investigated whether GIT1 localizes to podosome belts in OC. We visualized localization of Src, GIT1 and PLCγ2 in WT OCs using immunofluorescence. Rhodamine-Phalloidin was used to stain actin rings. In WT BM OC, Src localization was observed in the outer edge of the cell in very close proximity to the actin ring (Fig 5A). GIT1 co-localized predominantly with the actin ring (Fig 5B) while PLCγ2 localization was observed in the actin ring and in the perinuclear regions (Fig 5C). Staining with a phosphospecifc antibody to tyrosine 759 of PLCγ2 (phospho-PLCγ2) upon RANK stimulation for 5 mins after RANKL treament, revealed the presence of phospho-PLCγ2 in WT cells to be predominantly in the actin ring (Fig 5D). Since podosome belts were disorganized in GIT1 KO OC, localization of Src, PLCγ2 and phosho-PLCγ2 staining was diffusely present throughout the cell (Fig.S3 A, C, D). No staining was observed for GIT1 in GIT1 KO OC (Fig.S3 B). Furthermore, Src activity measured by its phosphorylation at Y416 was normal in GIT1 KO cells further confirming that Src functions upstream of GIT1 (Fig.S4). Taken together these data show that GIT1 is phosphorylated downstream of RANK in a Src dependent manner, raising the possibility that this signaling paradigm underlies the podosome belt formation defect in GIT1 KO OC.
Fig. 5. Src, GIT1 and PLCγ2 localizes in the podosome belts.
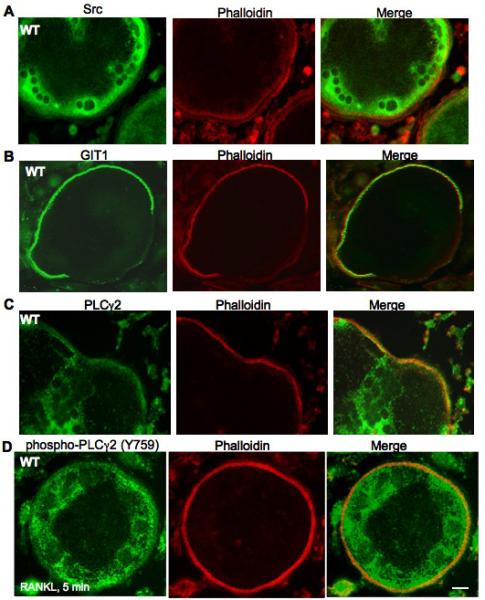
WT KO BM cells were differentiated into OC by treatment with MCSF (20 ng/ml) and RANKL (50 ng/ml) for 7 days, fixed and stained for (A) Src, (B) GIT1 and (C) PLCγ2. (D) WT OCs were serum starved for 4 hrs and stimulated with RANKL (100ng/ml) for 5 mins, fixed and stained for phosphorylated form of PLCγ2 using phospho- PLCγ2 (Y759) antibody. Rhodamine-phalloidin was used to visualize actin rings. (Scale bar: 15 μm)
Osteoblast differentiation and function normal in GIT1 KO
The high bone mass phenotype in GIT1 KO mice shown in Fig. 1A could involve a positive functional effect of GIT1 ablation in OB. As a first step to addressing this question, we examined temporal expression of GIT1 in BM derived OBs. As shown in Fig. S5 A, GIT1 is absent in BM derived cells at the time of plating up to 5 days into differentiation. Subsequently, GIT1 expression progressively increased between Day 7 and Day 10. To determine if GIT1 ablation impacts OB differentiation and function, we performed alkaline phosphatase [ALP] and alizarin-red staining in cultures of GIT1 WT and KO BM cells for 2-3 weeks. GIT1 WT and KO cultures contained similar amounts of ALP positive colonies (Fig.S5 B) and alizarin-red positive mineralized nodules (Fig.S5 D) suggesting that OB differentiation and function is not perturbed in cells from GIT1 KO mice. Quantitative analysis of percentage of ALP and alizarin-red positive colonies relative to percentage control were similar between GIT1 WT and KO (Fig S5 C and E). These results were further confirmed by an in vivo calcein labeling approach to quantify bone formation (Fig S5 F). Bone formation parameters were measured as described in Bajayo et al (Bajayo et al., 2005). Mineralized Surface (MS,%), Mineral Apposition Rate (MAR, μm/day) and Bone Formation Rate (BFR, μm3/μm2/day) were similar between GIT1 KO and WT controls (Fig S5 G-I). Thus, ablation of GIT1 does not affect OB differentiation in vitro and OB function in vivo, suggesting that the increase in bone mass observed in GIT1 KO is primarily due to an OC defect.
Discussion
The major finding of the present study is that deletion of GIT1 in mice leads to a significant increase in bone mass. Histological and bone morphometric comparisons reveal that this is largely caused by an increase in trabecular number and connectivity. The high bone mass phenotype in GIT1 KO mice is predominantly the result of a defect in OC function rather than an increase in OB mediated bone formation. Although OC numbers were not changed in GIT1 KO mice compared to WT controls, OC function was impaired as indicated by decreased bone resorption in vitro and by the presence of increased cartilage remnants within the trabecular bone. Deletion of GIT1 did not affect OB differentiation and function in vitro and bone formation rate in vivo. Furthermore, we demonstrate that GIT1 functions downstream of RANK signaling in a Src kinase dependent manner. Though 60% of the GIT1 KO mice are postnatally lethal due to defective pulmonary vasculature (Pang et al., 2009), the surviving animals develop normally and exhibit normal morphology of different tissues where GIT1 is expressed. However, GIT1 KO of 10-12 weeks old mice shows an increase in bone density. This study demonstrates for the first time that GIT1 plays a crucial role in the maintenance of bone mass in vivo.
Targeted deletion of Src in mice results in severe osteopetrosis due to complete lack of OC function (Soriano et al., 1991). Compensation by other Src family members does not occur, signifying a unique role of Src in OC function (Lowe et al., 1993). In naïve bone marrow derived macrophages, Src expression is absent. But upon treatment with RANKL and MCSF, its expression is induced marking the commitment of the cells to the osteoclast lineage (Kim et al., 2009). Small molecule inhibitors of Src focused on disrupting Src interaction with its substrates, adaptor proteins or proteins that determine its localization are being developed (Metcalf et al., 2002; Sawyer et al., 2002). But, whether the kinase activity of Src or its scaffolding function is important for OC function remains unresolved. Overexpression of kinase defective Src mutant K295M in Src KO mice reduces the osteopetrotic phenotype due to partial rescue of the OC cytoskeletal defect (Schwartzberg et al., 1997). In contrast to these findings, several studies show that Src K295M failed to restore podosome belt and bone resorbing activity in Src KO OC, implying that its kinase activity is critical for OC function (Destaing et al., 2008; Miyazaki et al., 2004). In this study we demonstrate that deletion of GIT1, a substrate of Src, results in a osteopetrosis-like phenotype. Our finding suggests that the kinase activity of Src that is required for GIT1 phosphorylation is important for OC function.
Both Src and GIT1 KO OC show loss of podosome belt formation and defective OC function. However, compared to Src KO mice that completely lack OC function (Boyce et al., 1992), G1T1 KO OCs have a 65% decrease in their OC function as observed by their decreased resorbtion on dentine slices. This suggests that there might be a compensatory mechanism involved. GIT2, an ortholog of GIT1, has recently been shown to be important for sealing zone formation in OC cultured from RAW 264.7 cells (Heckel et al., 2009). The authors showed that knockdown of GIT2 by siRNA perturbed sealing zone formation while analogous knockdown of GIT1 had no effect. Our in vitro and in vivo results are in contrast with these findings. This disparity could be due to the differences in the model system used in these studies. In our study, we used OCs cultured from the BM cells of GIT1 KO mice, which are physiologically relevant. Though we did not observe up-regulation of GIT2 protein expression in GIT1 KO OC (Fig. S6), it is possible that expression of GIT2 might be sufficient to functionally compensate for some of the functions of GIT1. We do not dispute the fact that GIT2 is important for podosome belt formation in OC, but we believe that GIT1 in combination with GIT2 regulate podosome belt formation in OC. The bone phenotype in GIT2 KO mice has not yet been described. However even in the presence of GIT2, GIT1 KO mice show increase in bone mass indicating that GIT1 is important for OC function and bone homeostasis.
RANK signaling is known to be important for cytoskeletal organization in OC, though the exact mechanism is not clearly defined (Armstrong et al., 2002). Wong et al (Wong et al., 1999) showed that Src is activated in a multi-step process downstream of RANK signaling. Src is constitutively bound to the RANK receptor and its basal activity is enhanced by the recruitment of the adaptor protein Traf6 to the receptor complex. Activated Src then phosphorylates and regulates several signaling proteins that mediate cell polarization, podosome belt formation and ruffle border formation. Intriguingly, we observe that GIT1 is phosphorylated in a Src dependent manner upon RANK stimulation. Loss of GIT1 did not affect all RANK signaling pathways. This suggests that GIT1 couples RANK to specific Src signaling cascades through its scaffolding action. Indeed, GIT1 KO OC show decreased phosphorylation of PLCγ2 that is tyrosine phosphorylated in Src dependent manner upon RANK stimulation (Mao et al., 2006). Whether GIT1 can directly associate with RANK and regulate specific signaling cascades or whether this interaction is mediated by Trafs remains to be determined. Additionally, whether GIT1 can regulate immunoreceptor tyrosine based activation motif [ITAM] signaling by regulating PLCγ2 phosphorylation requires further investigation. In addition to RANK signaling, it is known that Src regulates actin cytoskeleton through Src-Syk-αvβ3-Vav3 complex (Zou et al., 2007). Since GIT1 regulates outside-in integrin signaling in platelets (Sato et al., 2008), it is possible that GIT1 functions downstream of RANK and integrin signaling pathways and regulates podosome belt formation.
In conclusion, our data shows that genetic deletion of GIT1 in mice leads to increases in bone mass. Our findings suggest that GIT1 maintains OC cytoskeleton integrity and function. These data identify for the first time GIT1 as a key mediator of bone homeostasis. It is possible that strategies to inhibit GIT1 function specifically in the bone can block bone degradation observed in several pathological conditions, thus suggesting GIT1 as a potential therapeutic target.
Supplementary Material
Acknowledgments
We would like to thank Dr. Hani Awad, Laura Yanoso, Nathaniel Miller for microCT analysis, Dr. Kofi Mensah for help with the RAW 264.7 cells and Dr. LianPing Xing for dentine slices.
Contract grant sponser: National Institute of Health (NIH)
Contract grant number: NIH grant HL-63462 to BC Berk
References
- Armstrong A, Tometsko M, Glaccum M, Sutherland C, Cosman D, Dougall W. A RANK/TRAF6-dependent signal transduction pathway is essential for osteoclast cytoskeletal organization and resorptive function. J Biol Chem. 2002;277:44347–44356. doi: 10.1074/jbc.M202009200. [DOI] [PubMed] [Google Scholar]
- Bajayo A, Goshen I, Feldman S, Csernus V, Iverfeldt K, Shohami E, Yirmiya R, Bab I. Central IL-1 receptor signaling regulates bone growth and mass. Proc Natl Acad Sci U S A. 2005;102:12956–12961. doi: 10.1073/pnas.0502562102. [DOI] [PMC free article] [PubMed] [Google Scholar]
- Boyce B, Yoneda T, Lowe C, Soriano P, Mundy G. Requirement of pp60c-src expression for osteoclasts to form ruffled borders and resorb bone in mice. Cell. 1992;90:1622–1627. doi: 10.1172/JCI116032. [DOI] [PMC free article] [PubMed] [Google Scholar]
- Boyle WJSW, LAcey DL. Osteoclast differentiation and activation. Nature. 2003;423:37–42. doi: 10.1038/nature01658. [DOI] [PubMed] [Google Scholar]
- Destaing O, Sanjay A, Itzstein C, Horne W, Toomre D, De Camilli P, Baron R. The tyrosine kinase activity of c-Src regulates actin dynamics and organization of podosomes in osteoclasts. Mol Biol Cell. 2008;19(1):394–404. doi: 10.1091/mbc.E07-03-0227. [DOI] [PMC free article] [PubMed] [Google Scholar]
- Epple H, Cremasco V, Zhang K, Mao D, Longmore G, Faccio R. Phospholipase Cgamma2 modulates integrin signaling in the osteoclast by affecting the localization and activation of Src kinase. Mol Cell Biol. 2008;28(11):3610–3622. doi: 10.1128/MCB.00259-08. [DOI] [PMC free article] [PubMed] [Google Scholar]
- Faccio R, Teitelbaum SL, Fujikawa K, Chappel J, Zallone A, Tybulewicz VL, Ross FP, W S. Vav3 regulates osteoclast function and bone mass. Nature Medicine. 2005;11(3):284–290. doi: 10.1038/nm1194. [DOI] [PubMed] [Google Scholar]
- Gil-Henn H, Destaing O, Sims NA, Aoki K, Alles N, Neff L, Sanjay A, Bruzzaniti A, De Camilli P, Baron R, J S. Defective microtubule-dependent podosome organization in osteoclasts leads to increased bone density in Pyk2(-/-) mice. J Cell Biol. 2007;178(6):1053–1064. doi: 10.1083/jcb.200701148. [DOI] [PMC free article] [PubMed] [Google Scholar]
- Haendeler J, Yin G, Hojo Y, Saito Y, Melaragno M, Yan C, Sharma V, Heller M, Aebersold R, Berk B. GIT1 mediates Src-dependent activation of phospholipase Cgamma by angiotensin II and epidermal growth factor. J Biol Chem. 2003;278(50):49936–49944. doi: 10.1074/jbc.M307317200. [DOI] [PubMed] [Google Scholar]
- Heckel T, Czupalla C, Santo A Expirto, Anitei M, Sanchez-Fernandez M Arantzazu, Mosch K, Krause E, Hoflack B. Src-dependent repression of ARF6 is required to maintain podosome-rich sealing zones in bone-digesting osteoclasts. Proc Natl Acad Sci U S A. 2009;106(5):1451–1456. doi: 10.1073/pnas.0804464106. [DOI] [PMC free article] [PubMed] [Google Scholar]
- Hoefen R, Berk B. The multifunctional GIT family of proteins. J Cell Sci. 2006;119:1469–1475. doi: 10.1242/jcs.02925. [DOI] [PubMed] [Google Scholar]
- Kim H, Zhang K, Zhang L, Ross F, Teitelbaum S, Faccio R. The Src family kinase, Lyn, suppresses osteoclastogenesis in vitro and in vivo. Proc Natl Acad Sci U S A. 2009;106:2325–2330. doi: 10.1073/pnas.0806963106. [DOI] [PMC free article] [PubMed] [Google Scholar]
- Linder S, Aepfelbacher M. Podosomes: adhesion hot-spots of invasive cells. Trends Cell Biol. 2003;13(7):376–385. doi: 10.1016/s0962-8924(03)00128-4. [DOI] [PubMed] [Google Scholar]
- Lowe C, Yoneda T, Boyce B, Chen H, Mundy G, Soriano P. Osteopetrosis in Src-deficient mice is due to an autonomous defect of osteoclasts. Proc Natl Acad Sci U S A. 1993;90:4485–4489. doi: 10.1073/pnas.90.10.4485. [DOI] [PMC free article] [PubMed] [Google Scholar]
- Mao D, Epple H, Uthgenannt B, Novack D, Faccio R. PLCgamma2 regulates osteoclastogenesis via its interaction with ITAM proteins and GAB2. J Clin Invest. 2006;116(11):2869–2879. doi: 10.1172/JCI28775. [DOI] [PMC free article] [PubMed] [Google Scholar]
- Menon P, Deane R, Sagare A, Lane SM, Zarcone TJ, O’Dell MR, Yan C, Zlokovic BV, BC B. Impaired spine formation and learning in GPCR kinase 2 interacting protein-1 (GIT1) knockout mice. Brain Research. 2010 doi: 10.1016/j.brainres.2009.11.084. [DOI] [PMC free article] [PubMed] [Google Scholar]
- Metcalf Cr, van Schravendijk M, Dalgarno D, Sawyer T. Targeting protein kinases for bone disease: discovery and development of Src inhibitors. Curr Pharm Des. 2002;8:2049–2075. doi: 10.2174/1381612023393323. [DOI] [PubMed] [Google Scholar]
- Miyazaki T, Sanjay A, Neff L, Tanaka S, Horne W, Baron R. Src kinase activity is essential for osteoclast function. J Biol Chem. 2004;279(17):176660–176666. doi: 10.1074/jbc.M311032200. [DOI] [PubMed] [Google Scholar]
- Pang J, Hoefen R, Pryhuber G, Wang J, Yin G, White R, Xu X, O’Dell M, Mohan A, Michaloski H, Massett M, Yan C, Berk B. G-Protein-Coupled Receptor Kinase Interacting Protein-1 Is Required for Pulmonary Vascular Development. Circulation. 2009;119(11):1524–1532. doi: 10.1161/CIRCULATIONAHA.108.823997. [DOI] [PMC free article] [PubMed] [Google Scholar]
- Pang J, Yan C, Natarajan K, Cavet M, Massett M, Yin G, Berk B. GIT1 mediates HDAC5 activation by angiotensin II in vascular smooth muscle cells. Arterioscler Thromb Vasc Biol. 2008;28(5):892–898. doi: 10.1161/ATVBAHA.107.161349. [DOI] [PMC free article] [PubMed] [Google Scholar]
- Sato H, Suzuki-Inoue K, Inoue O, Ozaki Y. Regulation of adaptor protein GIT1 in platelets, leading to the interaction between GIT1 and integrin alpha(IIb)beta(3) Biochem Biophys Res Commun. 2008 doi: 10.1016/j.bbrc.2008.01.064. [DOI] [PubMed] [Google Scholar]
- Sawyer T, Bohacek R, Dalgarno D, Eyermann C, Kawahata N, Metcalf Cr, Shakespeare W, Sundaramoorthi R, Wang Y, Yang M. SRC homology-2 inhibitors: peptidomimetic and nonpeptide. Mini Rev Med Chem. 2002;2:475–488. doi: 10.2174/1389557023405765. [DOI] [PubMed] [Google Scholar]
- Schwartzberg P, Xing L, Hoffmann O, Lowell C, Garrett L, Boyce B, Varmus H. Rescue of osteoclast function by transgenic expression of kinase-deficient Src in src-/- mutant mice. Genes Dev. 1997;11(21):2835–2844. doi: 10.1101/gad.11.21.2835. [DOI] [PMC free article] [PubMed] [Google Scholar]
- Slevin M, Elasbali AB, Turu M Miguel, Krupinski J, Badimon L, J G. Identification of differential protein expression associated with development of unstable human carotid plaques. Am J Pathol. 2006;168(3):1004–1021. doi: 10.2353/ajpath.2006.050471. [DOI] [PMC free article] [PubMed] [Google Scholar]
- Soriano P, Montgomery C, Geske R, Bradley A. Targeted disruption of the c-src proto-oncogene leads to osteopetrosis in mice. Cell. 1991;64(4):693–702. doi: 10.1016/0092-8674(91)90499-o. [DOI] [PubMed] [Google Scholar]
- Teitelbaum S. Osteoclasts: what do they do and how do they do it? Am J Pathol. 2007;170:427–435. doi: 10.2353/ajpath.2007.060834. [DOI] [PMC free article] [PubMed] [Google Scholar]
- Väänänen K. Mechanism of osteoclast mediated bone resorption--rationale for the design of new therapeutics. Adv Drug Deliv Rev. 2005;57(7):959–971. doi: 10.1016/j.addr.2004.12.018. [DOI] [PubMed] [Google Scholar]
- van der Eerden B, Hoenderop J, de Vries T, Schoenmaker T, Buurman C, Uitterlinden A, Pols H, Bindels R, van Leeuwen J. The epithelial Ca2+ channel TRPV5 is essential for proper osteoclastic bone resorption. Proc Natl Acad Sci U S A. 2005;102:17507–17512. doi: 10.1073/pnas.0505789102. [DOI] [PMC free article] [PubMed] [Google Scholar]
- van Nieuw Amerongen G, Natarajan K, Yin G, Hoefen R, Osawa M, Haendeler J, Ridley AJ, Fujiwara K, van Hinsbergh V, Berk BC. GIT1 mediates thrombin signaling in endothelial cells: role in turnover of RhoA-type focal adhesions. Circ Res. 2004;94(8):1041–1049. doi: 10.1161/01.RES.0000125627.77235.0C. [DOI] [PubMed] [Google Scholar]
- Wang J, Taba Y, Pang J, Yin G, Yan C, Berk B. GIT1 Mediates VEGF-Induced Podosome Formation in Endothelial Cells. Critical Role for PLC{gamma} Arterioscler Thromb Vasc Biol. 2008;29(2):202–208. doi: 10.1161/ATVBAHA.108.174391. [DOI] [PMC free article] [PubMed] [Google Scholar]
- Wong B, Besser D, Kim N, Arron J, Vologodskaia M, Hanafusa H, Choi Y. TRANCE, a TNF family member, activates Akt/PKB through a signaling complex involving TRAF6 and c-Src. Mol Cell. 1999;4(6):1041–1049. doi: 10.1016/s1097-2765(00)80232-4. [DOI] [PubMed] [Google Scholar]
- Yin G, Zheng Q, Yan C, Berk B. GIT1 Is a Scaffold for ERK1/2 Activation in Focal Adhesions. J Biol Chem. 2005;280(30):27705–27712. doi: 10.1074/jbc.M502271200. [DOI] [PubMed] [Google Scholar]
- Zou W, Kitaura H, Reeve J, Long F, Tybulewicz V, Shattil S, Ginsberg M, Ross F, Teitelbaum S. Syk, c-Src, the alphavbeta3 integrin, and ITAM immunoreceptors, in concert, regulate osteoclastic bone resorption. J Cell Biol. 2007;176:877–888. doi: 10.1083/jcb.200611083. [DOI] [PMC free article] [PubMed] [Google Scholar]
Associated Data
This section collects any data citations, data availability statements, or supplementary materials included in this article.