

Abstract
Maximal endurance exercise capacity is determined by a variety of factors, including maximal ability to transport O2 to the muscle mitochondria and to use this O2 for ATP generation (V̇O2MAX). This analysis combines the individually well-known O2 mass conservation equations for the four critical steps in the O2 transport pathway (ventilation, alveolar/capillary diffusion, circulation and muscle diffusion) into an analytical, closed form, model showing how V̇O2MAX depends on all four steps. It further shows how changes in any one step affect the function of the others. This analytical approach however requires approximating the O2Hb dissociation curve as linear. Removing this condition to allow for the real O2Hb curve requires numerical analysis best explained graphically. Incorporating maximal mitochondrial metabolic capacity to use O2 allows prediction of when V̇O2MAX is limited by transport or by metabolic capacity. This simple approach recapitulates in vivo behavior and clarifies the determinants of maximal exercise.
Keywords: maximal O2 consumption, maximal exercise capacity, oxygen transport, oxygen utilization
Endurance exercise depends on delivering O2 from the air to the contracting muscle mitochondria. This O2 pathway is very well understood in terms of its individual steps [1] (Figure 1), but there remains considerable misunderstanding about how the steps relate to one another and combine to determine maximal O2 throughput. Modeling O2 transport as an integrated system offers the opportunity to clarify how the system works and which steps are important to overall function. To do this requires appreciation of three principal issues: First, the four main steps shown in Figure 1 (ventilation, alveolar-capillary diffusion, circulation, and muscle diffusion) form an in series set of steps for O2 as molecules are passed from the air to the lungs to the blood and finally to the mitochondria. Second, O2 throughput at each step must conserve O2 mass. Finally, for present purposes, the system should be considered in a steady state, such that the transients at the onset and cessation of exercise are removed from consideration.
Figure 1.
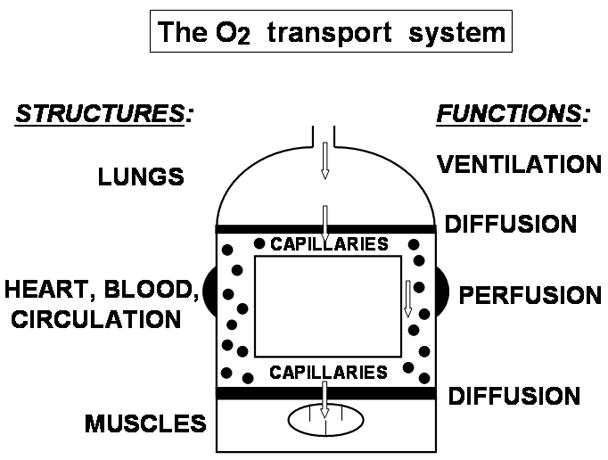
Diagram of the O2 transport system, consisting of four major organs/tissues (lungs, cardiovascular system, blood and muscle) supporting the four principal transport functions (ventilation, alveolar-capillary diffusion, circulatory perfusion and muscle diffusion).
Under these constraints, well known transport equations exist for each step. These were described some 60 years ago [2–5]. The equations describing transport by convective processes (ventilation and circulation) simply conserve mass; those describing transport by diffusive processes start as first order linear differential equations that must be integrated along the relevant capillary path to yield overall mass conservation and O2 throughput from start to end of the capillary.
The purpose of this analysis is to bring these separate equations together as a system, and from this to examine how the system functions. To do this, either of two approaches could be used. One is to approximate the O2Hb dissociation curve by a straight line (the slope being modeled by a single constant) rather than using the complex non-linear function that it really is [5–6]. The other is to use the actual O2Hb dissociation curve [7]. The former allows algebraic analysis with closed form solutions that give a clear overview of the principles of system function at the cost of strict numerical accuracy. The latter provides accurate simulation for O2 transport, but the complex nature of the dissociation curve precludes analytical solutions. Thus, numerical analysis must be applied, and this means that each such computation yields a particular solution correct and applicable only for the values of the chosen variables. These two approaches are nicely complementary and both will be addressed in what follows.
O2 transport modeled using linear approximation to the O2Hb dissociation curve
Figure 2 presents at the top the mass balance equations for each of the four processes [4–5]. Those describing diffusion (at both the lungs and muscles) have already been integrated to provide the overall solution. These equations are each far from novel as mentioned above. What should be realized is that these four equations contain precisely four unknowns as set out in Figure 2. Therefore, this equation set can be solved algebraically, and the solutions for the four unknowns are also laid out in Figure 2.
Figure 2.
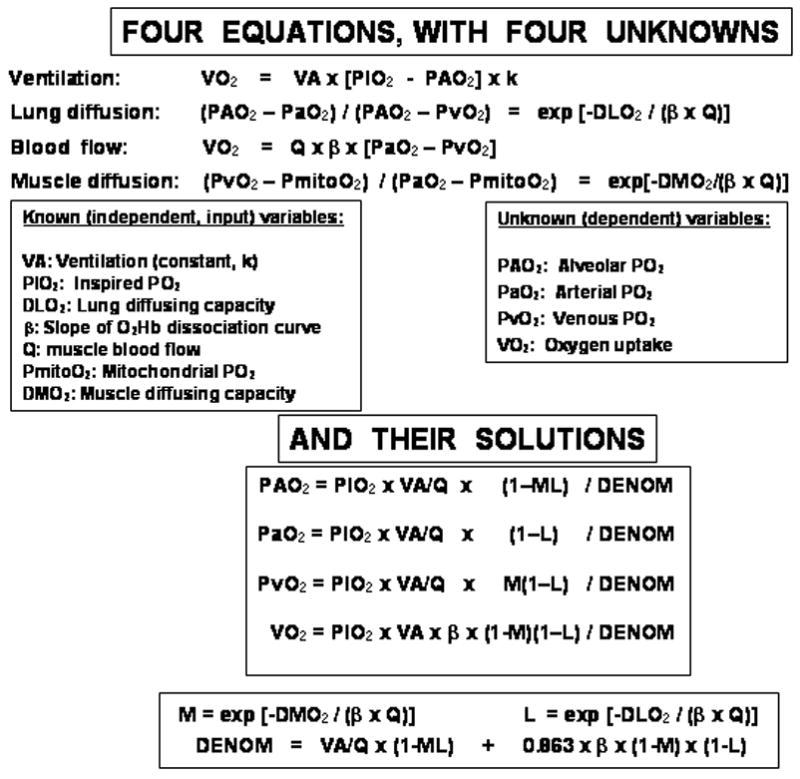
By approximating the O2Hb dissociation curve as a straight line, the four O2 transport functions are each described by explicit equations that can be solved simultaneously to yield analytical solutions for the four indicated dependent variables in terms of given values of the seven independent variables listed. These solutions are given in the lower section of the figure.
In Figure 3, the top section shows these solutions graphically as just one of the input variables, maximal cardiac output, is systematically altered across the spectrum from 0 to 50 l/minute using data for all variables corresponding to maximal exercise for normal fit young adults. Oxygen uptake varies as would be expected, cardiac output being just one component of an in series transport system. It governs V̇O2 when low (<10 L/min), but has little effect when higher. This characteristic non-linear behavior of V̇O2 is explained by the basic governing equations (top of Figure 2). The higher the cardiac output, the greater is the convective flow of O2 within the circulatory system (blood flow equation). However, the two equations describing diffusion each have an exponential term with blood flow, Q̇, in the denominator of the exponent. Thus, as Q̇ increases, there is less and less complete diffusive equilibration in both the lungs and muscles, offsetting the enhancement by the circulatory component mentioned above. As Q̇ increases, the fall in arterial PO2 and rise in venous PO2 shown in figure 3 reflect this interference to diffusive transport and limit the gain in V̇O2MAX with increasing Q̇.
Figure 3.
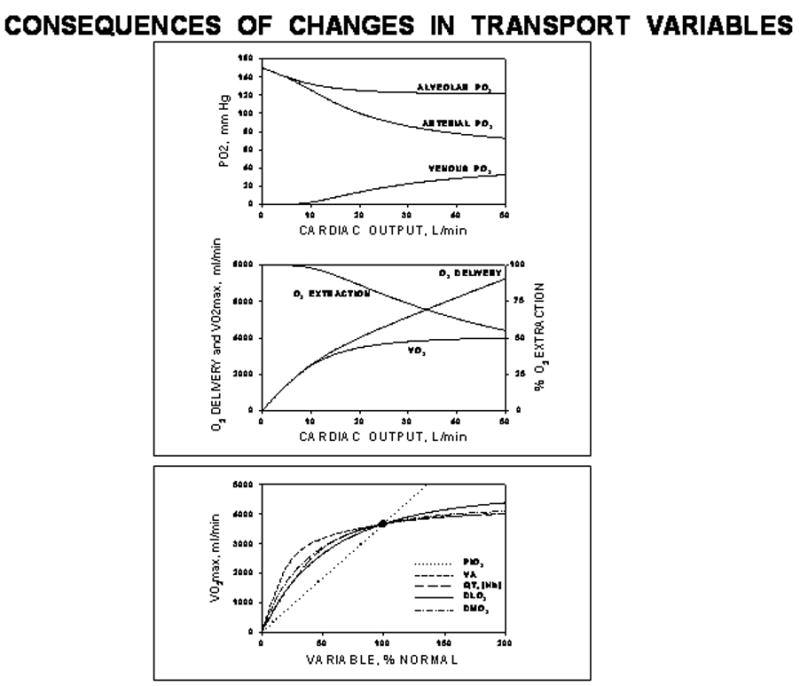
Upper box: Graphical expression of the solutions listed in Figure 2 for the case of changing cardiac output. Lower box: Summary solutions for the effects on V̇O2MAX of varying each independent variable one at a time. Except for the effects of PIO2 (which reflect the linear approximation to the O2Hb dissociation curve), the effects of all other variables are similarly non-linear.
This pattern of behavior is seen when any of the independent transport variables (Figure 2) is altered, as shown in the bottom panel of Figure 3. Except for the linear relationship between V̇O2MAX and PIO2 (which is an artifact of assuming the O2Hb dissociation curve is linear as PIO2 increases), the effects of changing any of the independent variables are similar as Figure 3 shows. The major point of this analysis is that in an in series system such as that for O2 transport, every component has the potential to affect V̇O2MAX. The standard question of “what limits V̇O2MAX: is it the heart, the lungs or the muscle?” needs to be replaced by the question “how important are the various independent variables to V̇O2MAX?” There is no one determinant of maximal V̇O2.
O2 transport modeled using the actual O2Hb dissociation curve
Figures 2 and 3 demonstrate the power of analytical approaches to the O2 transport system, but also reveal the approximations resulting from assuming a linear O2Hb dissociation curve. Numerical analysis to solve the equation system of Figure 2 reconfigured to use the actual dissociation curve is feasible. Because each simulation produces a particular result [7], a more efficient way to present system behavior is to use a graphical approach [8]. Figure 4 shows the conceptual basis for this approach. Panel A describes the coexistent transport processes of blood flow to, and diffusion within, muscle. Panel B focuses on the convective, circulatory transport component using the well-known Fick principle of mass conservation (as also used in Figure 2). Panel C focuses on the diffusive transport of O2 from muscle microvascular red cells to muscle mitochondria, using the laws of diffusion. The equations now reflect the actual dissociation curve. For the diffusive component, PcapO2 represents mean capillary PO2 between the artery and vein, which in effect serves to integrate O2 diffusion along the capillary length. In panel C, O2 flux is given by the product of the muscle diffusing capacity, D, and the difference between the mean capillary PO2 (PcapO2) and the mitochondrial PO2 (PmitoO2).
Figure 4.
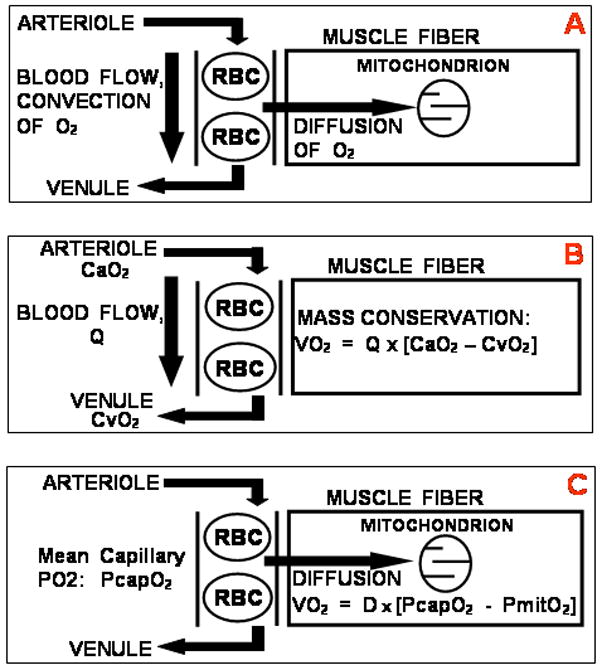
Panel A: Concept of convective transport of O2 to the muscle by blood flow and simultaneous diffusive transport of O2 from red cells to mitochondria in muscle. Panel B: The convective transport component must obey the Fick principle of mass conservation. Panel C: The diffusive component must obey the laws of diffusion.
Two important approximations are now made to simplify the presentation: First, mitochondrial PO2 is taken to be zero. It must be less than 3–4 mm Hg, which is the measured value of the PO2 associated with myoglobin in the cytoplasm during heavy exercise [9]. Mean capillary PO2 on the other hand is about 40–50 mm Hg, calculated by numerical analysis between measured values of arterial and muscle venous PO2 [10]. The second approximation is to replace PcapO2 by a constant, k, multiplying PvO2 (muscle venous PO2). This too has been shown to be reasonable [10]. The two transport equations of Figure 4 may now be written:
| 1 |
| 2 |
These two equations are plotted in Panel A of Figure 5, with V̇O2 on the ordinate and PvO2 on the abscissa, assuming PmitoO2=0. The square symbols indicate the boundaries of equation 1 above, the equation describing convective blood flow. The open square marks what would be seen if all O2 was extracted from the flowing blood; the closed square if no O2 at all were extracted from the flowing blood. Neither extreme is ever seen in practice.
Figure 5.
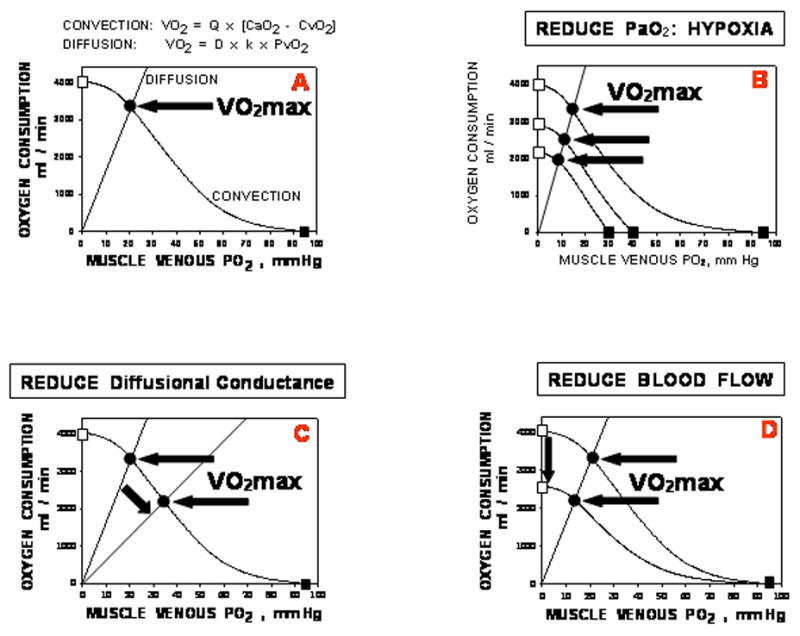
Panel A: Bringing the circulatory convective and muscle diffusive components together on a diagram relating V̇O2 to PvO2. Panel B: Effects of progressive arterial hypoxemia on V̇O2MAX; Panel C: Effects of reduced muscle diffusing capacity on V̇O2MAX; Panel D: Effects of reduced muscle blood flow on V̇O2MAX. See text for details. The key point is that each factor involved in O2 transport plays a role in setting V̇O2MAX.
It can be seen that the only point in the figure where both equations yield the same V̇O2 and PvO2 – requirements of mass conservation – is that point marked by the solid circle. The values for the independent variables (Q̇, D, [Hb]) are those at maximal exercise, with arterial O2 concentration additionally depending on lung diffusing capacity and ventilation at maximal exercise. Thus, the solid circle identifies V̇O2MAX, and shows it to be a function of all of the independent variables listed in Figure 2.
Panels B, C and D indicate how individual changes in key independent variables (inspired PO2, ventilation and lung diffusing capacity and hence arterial PO2 (B); muscle diffusing capacity (C); and blood flow (D)) would affect V̇O2MAX (and PvO2). In particular, changing inspired PO2 is predicted to produce a linear and proportional relationship between V̇O2MAX and PvO2, and this has been found repeatedly [10–11]. Panels C and D contrast the effects of reduced diffusing capacity versus impaired blood flow: the former reduces V̇O2MAX but increases PvO2, while the latter reduces PvO2 as V̇O2MAX is lowered. Thus, different causes of any observed reduction in V̇O2MAX can be analyzed on Figure 5 if the relevant data are available, allowing the separate contributions of any changes in each transport variable to be determined.
Mitochondrial metabolic capacity: interaction with O2 transport in determining V̇O2MAX
To this point, it has been implicitly assumed that O2 transport governs maximal V̇O2. In other words, that the capacity to use O2 for ATP generation exceeds the capacity of the transport system to deliver O2 to the mitochondria. However, it is also possible that the O2 transport system can supply enough O2 to meet the maximal demands of the mitochondria for O2. In this case, it would be maximal mitochondrial oxidative capacity (MMOC) and not transport that limited maximal O2 consumption. Figure 6 explores this possibility, integrating it with O2 transport. In panel A are shown data from Wilson et al showing how isolated mitochondrial V̇O2 depends on ambient PO2. Above a PO2 of about 2 mm Hg, mitochondrial V̇O2 is independent of PO2, and this plateau V̇O2 value constitutes MMOC. This can be added to the diagrams of Figure 5. In panels B and C are shown hypothetical effects of a high (B) and low (C) MMOC. In B, MMOC exceeds O2 transport capacity even at the highest of the three levels of oxygenation shown. In this example, V̇O2MAX falls as FIO2 is reduced, exactly as in Figure 5B. However, in a subject with very low MMOC (Figure 6C), but identical O2 transport capacity as the subject in Figure 6B, a different outcome will be seen. With changes in FIO2, V̇O2MAX will vary in proportion to PvO2 only when FIO2 is low enough that V̇O2 is less than MMOC. At higher FIO2, V̇O2MAX fails to increase linearly, and plateaus at the MMOC value. Figure 6D shows that indeed these two patterns can be seen in healthy subjects [11–12]. By and large, trained athletes emulate Figure 6B while sedentary untrained subjects follow Figure 6C. Thus, this analysis suggests that in fit subjects, O2 transport limits V̇O2MAX, while in unfit subjects, mitochondrial oxidative enzyme capacity sets the limit to V̇O2MAX, until imposed hypoxia becomes severe.
Figure 6.
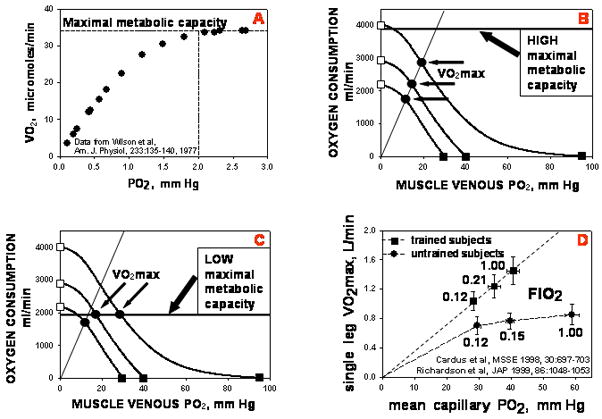
Adding maximal mitochondrial oxidative capacity (MMOC) to the transport diagram of Figure 5. Panel A: MMOC is the highest, plateau value of V̇O2 when PO2 no longer affects V̇O2 [13]. Panel B: When MMOC exceeds maximal O2 transport capacity, the latter determines V̇O2MAX just as in Figure 5. Panel C: When MMOC is less than maximal O2 transport capacity at any FIO2, MMOC and not transport limits V̇O2MAX. Panel D: Experimental data showing that fit subjects are limited by O2 transport while unfit subjects are essentially limited by MMOC (until FIO2 is reduced substantially).
In summary, the O2 transport and utilization system is an in series system in which every component is important to overall system throughput of O2. Bringing together the well-established O2 transport equations for the four main O2 transport processes (ventilation, alveolar-capillary diffusion, circulation and muscle diffusion), analytical solutions for transport can be found if the O2Hb dissociation curve is approximated by a straight line. This shows how every transport component has the power to affect V̇O2MAX – there is no single limiting factor. To account for the non-linearity of the dissociation curve, numerical analysis is required, but a simple diagram plotting V̇O2 against muscle venous PO2 can achieve this and yields great insight into the integrative nature of the O2 transport and utilization process.
Footnotes
Publisher's Disclaimer: This is a PDF file of an unedited manuscript that has been accepted for publication. As a service to our customers we are providing this early version of the manuscript. The manuscript will undergo copyediting, typesetting, and review of the resulting proof before it is published in its final citable form. Please note that during the production process errors may be discovered which could affect the content, and all legal disclaimers that apply to the journal pertain.
References
- 1.Weibel ER. Structure and Function in the Mammalian Respiratory System. Cambridge, MA: Harvard University Press; 1984. The Pathway for Oxygen. [Google Scholar]
- 2.Rahn H, Fenn WO. A Graphical Analysis of the Respiratory Gas Exchange. Washington, D.C: American Physiological Society; 1955. [Google Scholar]
- 3.Riley RL, Cournand A. “Ideal” alveolar air and the analysis of ventilation/perfusion relationships in the lung. J Appl Physiol. 1949;1:825–47. doi: 10.1152/jappl.1949.1.12.825. [DOI] [PubMed] [Google Scholar]
- 4.Kety SS. The theory and applications of the exchange of inert gas at the lungs and tissues. Pharmacol Rev. 1951;3:1–41. [PubMed] [Google Scholar]
- 5.Piiper J, Scheid P. Model for capillary-alveolar equilibration with special reference to O2 uptake in hypoxia. Respir Physiol. 1981;46:193–208. doi: 10.1016/0034-5687(81)90121-3. [DOI] [PubMed] [Google Scholar]
- 6.Wagner PD. Algebraic analysis of the determinants of V̇O2MAX. Respir Physiol. 1993;93:221–237. doi: 10.1016/0034-5687(93)90007-w. [DOI] [PubMed] [Google Scholar]
- 7.Wagner PD. A theoretical analysis of factors determining VO2MAX at sea level and altitude. Resp Physiol. 1996;106:329–343. doi: 10.1016/s0034-5687(96)00086-2. [DOI] [PubMed] [Google Scholar]
- 8.Wagner PD. Determinants of maximal oxygen transport and utilization. Annu Rev Physiol. 1996;58:21–50. doi: 10.1146/annurev.ph.58.030196.000321. [DOI] [PubMed] [Google Scholar]
- 9.Richardson RS, Noyszewski EA, Kendrick KF, Leigh JS, Wagner PD. Myoglobin O2 desaturation during exercise: evidence of limited O2 transport. J Clin Invest. 1995;96:1916–1926. doi: 10.1172/JCI118237. [DOI] [PMC free article] [PubMed] [Google Scholar]
- 10.Roca J, Ramis LI, Rodriguez-Roisin R, Ballester E, Montserrat JM, Wagner PD. Serial relationships between ventilation/perfusion inequality and spirometry in acute severe asthma requiring hospitalization. Am Rev Respir Dis. 1988;137:1055–1061. doi: 10.1164/ajrccm/137.5.1055. [DOI] [PubMed] [Google Scholar]
- 11.Richardson RS, Grassi B, Gavin TP, Haseler LJ, Tagore K, Roca J, Wagner PD. Evidence of O2 supply-dependent V̇O2MAX in the exercise-trained human quadriceps. J Appl Physiol. 1999;86:1048–1053. doi: 10.1152/jappl.1999.86.3.1048. [DOI] [PubMed] [Google Scholar]
- 12.Cardús J, Marrades RM, Roca J, Barberá JA, Diaz O, Masclans JR, Rodriguez-Roisin R, Wagner PD. Effects of FIO2 on leg V̇O2 during cycle ergometry in sedentary subjects. Med Sci Sports Exerc. 1998;30:697–703. doi: 10.1097/00005768-199805000-00009. [DOI] [PubMed] [Google Scholar]
- 13.Wilson DF, Erecinska M, Drown C, Silver IA. Effect of oxygen tension on cellular energetics. Am J Physiol. 1977;2:C135–C140. doi: 10.1152/ajpcell.1977.233.5.C135. [DOI] [PubMed] [Google Scholar]