

Abstract
Intermittent interleukin (IL)-2 administration to human immunodeficiency virus (HIV)-1 infected patients is well documented and generally used, but there is limited information about the changes of acute-phase protein (APP) levels in response to this treatment. Fifteen patients undergoing highly active anti-retroviral therapy (HAART) treatment, with undetectable viral load, but low CD4+ cell count (<300/µl), have been treated with 3·6 M IU Proleukine® administered twice daily by subcutaneous injection over 5 days. C-reactive protein (CRP), d-dimer, C3, C9, C1-inh and alpha-2HS glycoprotein levels were measured immediately before IL-2 administration, as well as on day 5 and 2–3 weeks thereafter. After IL-2 administration, both mean d-dimer and CRP levels increased significantly (P < 0·001), but returned (P < 0·001) to baseline within the subsequent 2–3 weeks. Alpha-2HS glycoprotein decreased immediately after IL-2 administration. No significant differences were detected in the levels of C3, C9 and C1-inh. A significant, positive correlation (r = 0·5178, P = 0·0008) was ascertained between the changes of CRP level, measured immediately before as well as 5 days after IL-2 administration, and changes in CD4 T cell counts measured 2–3 weeks before and after treatment, respectively. IL-2 administration induces rapid elevation of two major APPs (CRP, d-dimer). The positive correlation observed between the changes of CRP levels and CD4+ cell counts after IL-2 administration may indicate that the abrupt, but transitory overproduction of CRP might contribute to the CD4+ cell count-increasing effect of the drug and/ or may be associated with serious side effects.
Keywords: acute-phase protein, HIV infection, interleukin-2
Introduction
Interleukin (IL)-2 is a cytokine secreted by activated T cells in vivo. IL-2 can regulate the proliferation, differentiation and survival of lymphocytes [1]. Exogenous IL-2 has been used as immunotherapy in oncology and in human immunodeficiency virus (HIV)-infected patients. In clinical trials, high-dose recombinant IL-2 is used to stop the decline of CD4+ T cell count in HIV-infected patients [2–6]. According to the latest data, the increase of CD4+ cell count accomplished by combined treatment with IL-2 and highly active anti-retroviral therapy (HAART) does not confer clinical benefit, but may induce grade 4 clinical side effects in patients with advanced, chronic HIV infection [7,8].
Because the causes of these side effects and the exact mechanism whereby treatment with IL-2 increases CD4+ T cell count are both unknown, studies into these questions seem to be warranted.
One of the pathological effects of IL-2 administration could be its action on other cytokines, including the proinflammatory cytokines IL-6, tumour necrosis factor (TNF)-α and IL-1β[9–11]. These cytokines are responsible for enhanced (or diminished) synthesis of acute-phase proteins (APPs) during the acute phase of inflammation and in chronic diseases [12,13].
Acute-phase proteins are a special type of proteins, the serum levels of which change significantly during inflammation, sudden tissue destruction, in acute and chronic infections – this is known as the ‘acute-phase reaction’. The serum concentrations of positive APPs [e.g. C-reactive protein (CRP), fibrinogen] rise, whereas those of negative APPs (e.g. albumin, alpha-2 HS glycoprotein) decrease during the acute-phase reaction [14,15]. Certain complement proteins [e.g. C3, C9, C1-inhibitor (C1-inh)] are regarded as positive APPs. In HIV-1 infected patients undergoing HAART, the concentrations of positive APPs are higher than in uninfected healthy controls, whereas there are no differences in the serum concentrations of negative APPs [16].
The most important APP is CRP. Lower levels of CRP have been shown to predict longer survival in HIV-infected individuals [17,18]. Moreover, as permanent HIV infection is not a highly inflammatory disease, the level of CRP was found to be relatively low (median <4 mg/l) [18]. A significant increase in CRP level may induce cardiovascular complications [19]. Furthermore, CRP levels have been observed to correlate inversely with CD4+ lymphocyte counts and directly with HIV RNA levels [18,20].
When measuring fibrinogen levels, its degradation product d-dimer is often used as a surrogate. There are conflicting literature data on the changes of fibrinogen or d-dimer levels in HIV-infected patients. Wolf et al. [21] found decreased d-dimer levels in HIV+ patients after the initiation of protease inhibitor (PI) or non-nucleoside reverse transcriptase inhibitors (NNRTI) treatment. Madden et al. [22], by contrast, reported that treatment with a PI was associated with elevated fibrinogen levels, whereas NNRTI administration did not result in any increase. An elevated d-dimer concentration identifies HIV-infected patients at a high risk of thrombotic thrombocytopenic purpura, cardiovascular events and death [23–25].
Several APPs (such as C3, C9, C1-inh) belong to the complement system. Measurement of their serum concentrations may provide additional information. For example, Senaldi et al. [26] showed that HIV infection is correlated in vivo with high levels of complement activation, as shown by both a decrease of serum concentration of complement proteins and an increase of activation fragments in the blood. In addition, complement and anti-HIV antibodies increase HIV replication through a mechanism of enhanced entry [27,28].
Although no correlation between increase of alpha-2 HS glycoprotein and HIV infection was observed [29], measuring this negative APP seems to be reasonable due to its increased sensitivity [30]. Until recently, no data have been available on the effect of IL-2 treatment on APPs. Porter et al. [31] were the first to report, in a paper published online in August 2009, the significant increase of CRP and d-dimer levels in two cohorts of HIV patients. Here, we present our investigation into the changes of six important APPs (CRP, d-dimer, C3, C9, C1-inh, alpha-2 HS glycoprotein) following IL-2 treatment of HIV-infected patients.
Methods
Patients and IL-2 treatment
Fifteen patients undergoing HAART, with undetectable viral load and low CD4+ T cell count (fewer than 300/µl blood), were studied. The relevant data of study subjects are summarized in Tables 1 and 2. Patients treated with HAART received recombinant human IL-2 (Proleukine®) 3·6 million international units by subcutaneous injection, twice daily, for 5 days (which is considered one treatment cycle). Six patients underwent several cycles of IL-2 treatment; three of these patients received at least three cycles. The protocol of this study was approved by the local ethics board and all subjects contributed written informed consent.
Table 1.
Characteristics of patients and design of the study.
| Patients' ID | Gender | Age | Other infection | Date of examined IL-2 administration | Number of IL-2 administration before the examined IL-2 administration | Absolute CD4+ T cell numbers (cell/µl) 2–3 weeks before the examined IL-2 administration |
|---|---|---|---|---|---|---|
| VG | Male | 27 | HCV | 19 September 2008 | – | 161 |
| 19 November 2008 | 1 | 180 | ||||
| PT | Male | 36 | – | 01 July 2008 | – | 258 |
| VZ | Male | 39 | CMV | 03 September 2008 | – | 138 |
| MA | Male | 30 | – | 30 April 2008 | – | 157 |
| SK | Female | 56 | Mycobacterium avium | 13 February 2008 | – | 74 |
| 30 April 2008 | 1 | 100 | ||||
| ML | Male | 43 | HBV | 25 January 2008 | – | 78 |
| 21 March 2008 | 1 | 98 | ||||
| 13 June 2008 | 2 | 148 | ||||
| PR | Female | 39 | – | 19 February 2008 | 2 | 136 |
| BP | Male | 42 | Cryptosporidium | 02 January 2008 | 3 | 106 |
| 07 March 2008 | 4 | 114 | ||||
| 30 May 2008 | 5 | 124 | ||||
| 29 August 2008 | 6 | 138 | ||||
| 21 November 2008 | 7 | 185 | ||||
| ON | Male | 35 | – | 04 September 2008 | 5 | 286 |
| KA | Male | 41 | – | 30 November 2007 | 4 | 111 |
| 04 April 2008 | 5 | 105 | ||||
| 12 June 2008 | 6 | 161 | ||||
| FA | Female | 37 | – | 31 March 2008 | 4 | 119 |
| BM | Male | 39 | – | 05 August 2008 | 6 | 299 |
| SS | Male | 40 | Pneumocystis | 11 February 2009 | – | 210 |
| KP | Male | 39 | Mycobacterium tuberculosis | 20 October 2008 | – | 135 |
| 27 December 2008 | 1 | 158 | ||||
| KI | Male | 63 | Mycobacterium tuberculosis | 19 December 2008 | – | 161 |
CMV, cytomegalovirus; HBV, hepatitis B virus; HCV, hepatitis C virus; IL, interleukin.
Table 2.
The total time of follow-up for patients.
| Patients' ID | Date of identification of HIV infection | Date of first HAART | Date of first virological success HAART | Date of IL-2 administration |
|---|---|---|---|---|
| VG | July 1990 | September 1997 | October 1997 | September 2008 |
| November 2008 | ||||
| PT | February 2005 | May 2007 | September 2007 | July 2008 |
| VZ | October 2007 | October 2007 | July 2008 | September 2008 |
| MA | October 2007 | October 2007 | January 2008 | April 2008 |
| SK | October 2007 | October 2007 | February 2008 | February 2008 |
| April 2008 | ||||
| ML | February 2007 | February 2007 | August 2007 | January 2008 |
| March 2008 | ||||
| June 2008 | ||||
| PR | February 2006 | June 2006 | January 2007 | July 2007 |
| September 2007 | ||||
| February 2008 | ||||
| BP | October 2006 | November 2006 | December 2006 | June 2007 |
| October 2007 | ||||
| January 2008 | ||||
| March 2008 | ||||
| May 2008 | ||||
| August 2008 | ||||
| November 2008 | ||||
| ON | December 2002 | December 2002 | January 2003 | February 2003 |
| May 2003 | ||||
| July 2003 | ||||
| November 2003 | ||||
| February 2004 | ||||
| September 2008 | ||||
| KA | June 2006 | June 2006 | July 2006 | August 2006 |
| November 2006 | ||||
| March 2007 | ||||
| June 2007 | ||||
| November 2007 | ||||
| April 2008 | ||||
| June 2008 | ||||
| FA | February 2004 | February 2004 | April 2004 | June 2004 |
| July 2004 | ||||
| October 2004 | ||||
| December 2004 | ||||
| March 2008 | ||||
| BM | February 2001 | February 2001 | April 2001 | October 2003 |
| December 2003 | ||||
| February 2004 | ||||
| April 2004 | ||||
| June 2004 | ||||
| August 2004 | ||||
| December 2004 | ||||
| December 2005 | ||||
| August 2007 | ||||
| August 2008 | ||||
| SS | March 2008 | March 2008 | October 2008 | February 2009 |
| KP | February 1998 | February 1998 | October 1998 | October 2008 |
| December 2008 | ||||
| KI | February 2003 | February 2003 | August 2003 | December 2008 |
HAART, highly active anti-retroviral therapy; HIV, human immunodeficiency virus; IL, interleukin.
Clinical specimens
Blood samples were drawn at three different times: immediately before IL-2 administration (day 0), on day 5 at the end of the cycle and 2–3 weeks thereafter. Blood samples for d-dimer assay were collected in citrate-containing tubes. Blood samples for CRP and complement measurements were allowed to clot and the serum was tested within 2 h or was stored frozen at −20°C until assayed. Blood samples [one tube, anti-coagulated with K3-ethylenediamine tetraacetic acid (EDTA)] were collected 2–3 weeks before and after IL-2 treatment for viral load determination and CD4+ T cell analysis.
Measurement of acute-phase proteins
The CRP and d-dimer concentrations were measured by immunoturbidimetry on an Olympus system. Serum concentrations of C1-inh, C9, C3 and alpha2-HS glycoprotein were measured by the radial immunodiffusion method [32], using anti-human C1-inh, C9 (Quidel, San Diego, CA, USA), C3 and alpha2-HS glycoprotein (Dako, Glostrup, Denmark). Pooled human serum of healthy blood donors was used to establish the reference levels of C1-inh, C3 and alpha2-HS glycoprotein. C9 concentrations were expressed as the percentages of those measured in the above-mentioned standard human serum.
Measurement CD4+ T cell counts and HIV viral load
Determination of CD4+ T cell subsets was performed as described previously [33]. We performed the haematological test with Sysmex XE-2100 (Sysmex Corporation, Kobe, Japan) and immunophenotyping with fluorescence activated cell sorter (FACS) Canto II (BD Immunocytometry Systems, San Jose, CA, USA). Plasma HIV RNA concentrations were determined using Cobas TaqMan® polymerase chain reaction (Roche Magyarország Kft, Diagnosztika Divizió, Budaörs, Hungary).
Statistical analysis
Statistical analysis was performed with Prism for Windows version 5 (GraphPad Software, San Diego, CA, USA) statistical software. We used the Friedman test for repeated measures analysis of variance (using Dunn's paired post-hoc test), Wilcoxon's matched-pairs test to compare paired values into the same group and Spearman's rho to calculate correlations.
Results
The effect of IL-2 therapy on absolute CD4+ T cell numbers
Absolute numbers of CD4+ T cells were determined 2–3 weeks before, and after the IL-2 treatment cycle. On average, the number of CD4+ T cells increased significantly (P = 0·001) from a baseline count of 74-286-90-563 (Fig. 1a). In patients who received more cycles of IL-2 treatment, the elevation of CD4+ T cell numbers persisted for a longer period, during which intense fluctuations (patients KA, ML) or steady but small increases (patients BP, SK, KP, VG) were ascertained (Fig. 1b).
Fig. 1.
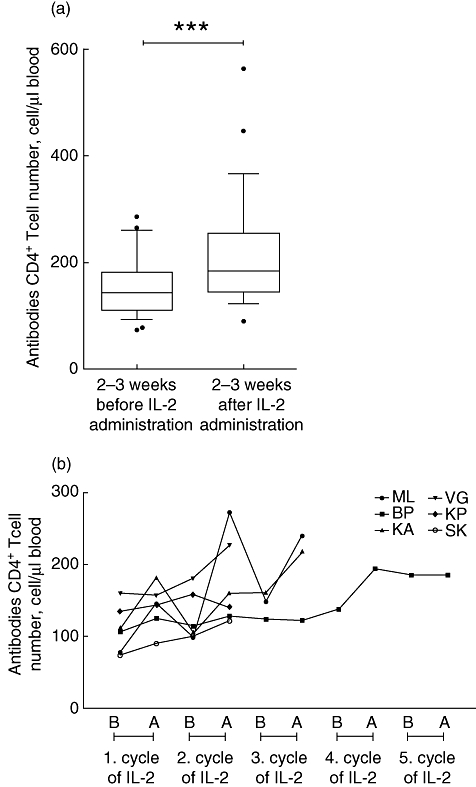
(a) Changes of absolute CD4+ T cell numbers 2–3 weeks before and after treatment. ***P < 0·001. (b) Changes of absolute CD4+ T cell numbers 2–3 weeks before (B) and after (A) treatment, in patients who received more interleukin-2 cycles.
Changes of APPs during IL-2 administration
d-dimer
On day 0, the average d-dimer level of IL-2 treated patients was below 0·5 µg/ml and exceeded 1 µg/ml in just a single patient. There was a significant (P < 0·001) increase after the conclusion of the IL-2 treatment cycle (by day 5). In four cases d-dimer concentration increased more than 10-fold, and reached a level of 3·44–3·97 µg/ml on day 5. There were no differences between these patients and the remaining patients either in the number of IL-2 cycles or the baseline CD4+ cell counts.
A significant (P < 0·001) decrease was observed 2–3 weeks after treatment, and except for three cases d-dimer concentrations returned to baseline level (Fig. 2).
Fig. 2.
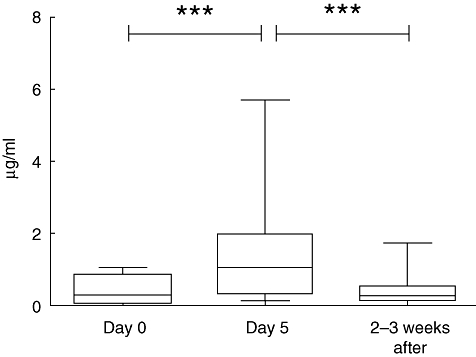
Changes of d-dimer levels following interleukin-2 treatment. d-dimer levels increased sharply from day 0 to day 5 and decreased after the discontinuation treatment. Presented values are means. ***P < 0·001.
CRP
Mean baseline CRP level was 2·5 µg/ml (range: 1–10 µg/ml), except in two patients infected with Mycobacterium avium (78·5 µg/ml) or Cryptosporidium (28·4 µg/ml). After IL-2 administration, a significant elevation of CRP level, by two orders of magnitude, was seen on day 5, although some interindividual differences occurred. A significant decrease (P < 0·001) of CRP level was observed 2–3 weeks after IL-2 administration (Fig. 3). In the two patients infected with M. avium or Cryptosporidium a decline of CRP level was observed following a limited increase (mean change of CRP was 27 µg/ml in the M. avium-infected and 43 µg/ml in the Cryptosporidium-infected patients). In the three patients who had received at least three cycles of IL-2 treatment, the pattern of CRP changes was identical during all cycles (Fig. 3b).
Fig. 3.
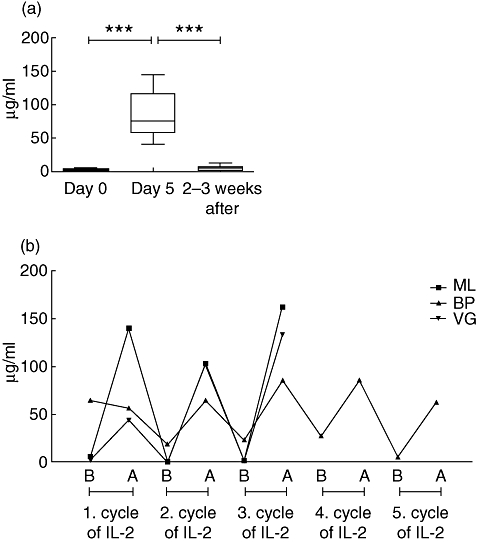
(a) Changes of C-reactive protein (CRP) level during interleukin-2 treatment of human immunodeficiency virus-infected patients (with the exception of patients co-infected by Pneumocystis and Cryptosporidium). Presented values are means. ***P < 0·001. (b) Changes of CRP concentration immediately before (B) and after (A) treatment, in patients who received at least three cycles.
C9, C3, C1-inh
No significant changes in the serum levels of these complement-associated APPs were observed (Fig. 4a–c).
Fig. 4.
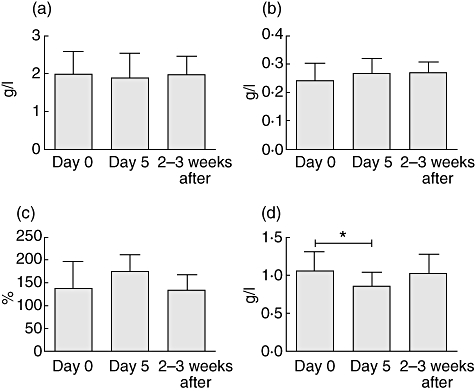
Changes in the levels of (a) C3, (b) C1-inh, (c) C9 and (d) alpha-2HS glycoprotein during follow-up. Presented values are means. *P < 0·05.
Alpha-2-HS
The concentration of this negative APP changed inversely to that of CRP and the d-dimer; it decreased significantly after IL-2 administration and returned to baseline level 2–3 weeks after treatment (Fig. 4d).
Correlation between the changes of CRP level and of absolute CD4+ T cell count
Changes of absolute CD4+ T cell numbers determined 2–3 weeks before and after IL-2 treatment and changes of CRP concentrations between day 0 and day 5 were calculated. A significant, positive correlation was found between the changes of absolute CD4+ T cell counts and CRP levels (r = 0·5178, P = 0·0080; Fig. 5), whereas no significant correlation was detected with the changes of other APPs (data not shown).
Fig. 5.
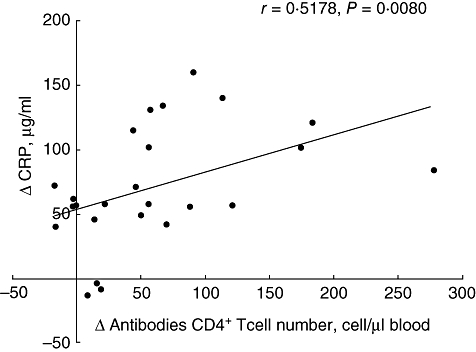
Correlation between the differences in serum C-reactive protein levels and absolute CD4+ T cell numbers measured 2–3 weeks before and after interleukin-2 treatment.
Discussion
The HIV-infected individuals displaying poor immune reconstitution to ongoing long-term HAART, despite full HIV viraemia suppression, might be ideal candidates to adjunct IL-2, and several controlled studies have been conducted to investigate IL-2 in these cohorts, but only one examined the changes of APPs (CRP and d-dimer) in these patients.
Our findings are in complete agreement with the very recently published findings from Porter et al. [31]. However, we have made some novel observations in addition. First, a significant, positive correlation was found between the extent of the elevation in CRP level during the 5 days of IL-2 administration, on one hand, and the changes of CD4+ T cell count occurring after IL-2 treatment on the other hand. Second, investigating the effect of IL-2 on the serum levels of other APPs, we have observed interesting differences. While the levels of a negative APP (alpha2-HS) decreased after IL-2 treatment (similar to the changes of CRP and d-dimer levels), no significant differences occurred in the serum levels of other three APPs (C3, C9 and C1-inh) belonging to the complement system. The failure of IL-2 to increase C1-inh concentration is an apparently important observation, as the administration of C1-inhibitor is known to attenuate the vascular leakage syndrome induced by high doses of IL-2 [34,35].
These findings may have some relevance for the mechanism of action and the effectiveness of IL-2 treatment in patients with HIV infection or cancer. In line with the recent results from Porter et al. [31], our present findings obtained in a large patient population indicate that the levels of the most important APP – CRP – are elevated and reach a concentration about 200 times higher than the baseline value. Elevated serum CRP levels can cause adverse effects. Volanakis [36] reported that high CRP concentration occurring directly after treatment with high doses of IL-2 can lead to the fixation of C1 and C4 complexed to cell surfaces. Complement fragments bound to their cellular receptors may effect the function of these cells and may possibly contribute to the side effects of the IL-2 therapy. The latest data [8] suggest a causal relationship between IL-2 therapy and cardiovascular events. As proposed by Kuller et al. [24], it is possible that these adverse events are associated with the temporary elevation of CRP and other serum proteins. Elevated d-dimer levels predict cardiovascular complications. Interestingly, Baars et al. [13] studied neoplastic patients and their results indicated that IL-2 activates blood coagulation and fibrinolysis, even in doses which do not cause serious side effects.
Conversely, our novel observation on the positive correlation between the extent of IL-2-induced elevation and the changes of CD4+ cell count (if this proves reproducible in a larger cohort of patients) may indicate that the transient, but abrupt, increase in CRP levels may contribute to the IL-2-induced increase of CD4+ cell count.
Our patient's therapy was successful virologically; the plasma HIV RNA level was under detection limit. No significant viral load changes have been observed following IL-2 treatment, in line with more recent studies [37–39].
To conclude, in accord with the recent findings from Porter et al. [31], our results suggest that the administration of high doses of IL-2 to HIV-infected patients induces an acute-phase reaction of rapid onset. These processes can underlie both the mechanism of the IL-2-induced increase of CD4+ cell count and the cardiovascular side effects of IL-2 treatment.
Acknowledgments
The authors thank all subjects for participating in this study; Ms Kornélia Barbai and Mrs Ágnes Kiss-Halász for the immense help they contributed to sample collection; and Ms Márta Kókai for her assistance with Mancini examinations. This study was supported by the ‘Asbóth Oszkár’ Grant from the National Office for Research and Technology; the authors are indebted to Professor Dr Julianna Lisziewicz.
Disclosure
None.
References
- 1.Smith KA. Interleukin-2: inception, impact, and implications. Science. 1988;240:1169–76. doi: 10.1126/science.3131876. [DOI] [PubMed] [Google Scholar]
- 2.Youle M, Emery S, Fisher M, et al. A randomised trial of subcutaneous intermittent interleukin-2 without antiretroviral therapy in HIV-infected patients: the UK-Vanguard Study. PLoS Clin Trials. 2006;1:e3. doi: 10.1371/journal.pctr.0010003. [DOI] [PMC free article] [PubMed] [Google Scholar]
- 3.Vogler MA, Teppler H, Gelman R, et al. Daily low-dose subcutaneous interleukin-2 added to single- or dual-nucleoside therapy in HIV infection does not protect against CD4+ T-cell decline or improve other indices of immune function: results of a randomized controlled clinical trial (ACTG 248) J Acquir Immune Defic Syndr. 2004;36:576–87. doi: 10.1097/00126334-200405010-00005. [DOI] [PubMed] [Google Scholar]
- 4.Emery S, Abrams DI, Cooper DA, et al. The evaluation of subcutaneous proleukin (interleukin-2) in a randomized international trial: rationale, design, and methods of ESPRIT. Control Clin Trials. 2002;23:198–220. doi: 10.1016/s0197-2456(01)00179-9. [DOI] [PubMed] [Google Scholar]
- 5.Durier C, Capitant C, Lascaux AS, et al. Long-term effects of intermittent interleukin-2 therapy in chronic HIV-infected patients (ANRS 048-079 Trials) Aids. 2007;21:1887–97. doi: 10.1097/QAD.0b013e3282703825. [DOI] [PubMed] [Google Scholar]
- 6.Arduino RC, Nannini EC, Rodriguez-Barradas M, et al. CD4 cell response to 3 doses of subcutaneous interleukin 2: meta-analysis of 3 Vanguard studies. Clin Infect Dis. 2004;39:115–22. doi: 10.1086/421775. [DOI] [PubMed] [Google Scholar]
- 7.Levy Y. Effect of interleukin-2 (IL-2) on clinical outcomes in patients with CD4+ cell count 50–299/mm3: primary results of the SILCAAT study. 16th Conference on Retroviruses and Opportunistic Infections. Montreal, Canada, 2009.
- 8.Losso M. Effect of interleukin-2 on clinical outcomes in patients with a CD4+ cell count of 300/mm3: primary results of the ESPRIT study. 16th Conference on Retroviruses and Opportunistic Infection. Montreal, Canada, 2009.
- 9.Fortis C, Soldini L, Ghezzi S, et al. Tumor necrosis factor alpha, interleukin 2, and soluble interleukin 2 receptor levels in human immunodeficiency virus type 1-infected individuals receiving intermittent cycles of interleukin 2. AIDS Res Hum Retroviruses. 2002;18:491–9. doi: 10.1089/088922202317406637. [DOI] [PubMed] [Google Scholar]
- 10.Mier JW, Vachino G, van der Meer JW, et al. Induction of circulating tumor necrosis factor (TNF alpha) as the mechanism for the febrile response to interleukin-2 (IL-2) in cancer patients. J Clin Immunol. 1988;8:426–36. doi: 10.1007/BF00916947. [DOI] [PubMed] [Google Scholar]
- 11.Heaton KM, Ju G, Grimm EA. Human interleukin 2 analogues that preferentially bind the intermediate-affinity interleukin 2 receptor lead to reduced secondary cytokine secretion: implications for the use of these interleukin 2 analogues in cancer immunotherapy. Cancer Res. 1993;53:2597–602. [PubMed] [Google Scholar]
- 12.Deehan DJ, Heys SD, Simpson W, Herriot R, Broom J, Eremin O. Correlation of serum cytokine and acute phase reactant levels with alterations in weight and serum albumin in patients receiving immunotherapy with recombinant IL-2. Clin Exp Immunol. 1994;95:366–72. doi: 10.1111/j.1365-2249.1994.tb07005.x. [DOI] [PMC free article] [PubMed] [Google Scholar]
- 13.Baars JW, de Boer JP, Wagstaff J, et al. Interleukin-2 induces activation of coagulation and fibrinolysis: resemblance to the changes seen during experimental endotoxaemia. Br J Haematol. 1992;82:295–301. doi: 10.1111/j.1365-2141.1992.tb06421.x. [DOI] [PubMed] [Google Scholar]
- 14.Kushner I. The phenomenon of the acute phase response. Ann NY Acad Sci. 1982;389:39–48. doi: 10.1111/j.1749-6632.1982.tb22124.x. [DOI] [PubMed] [Google Scholar]
- 15.Gabay C, Kushner I. Acute-phase proteins and other systemic responses to inflammation. N Engl J Med. 1999;340:448–54. doi: 10.1056/NEJM199902113400607. [DOI] [PubMed] [Google Scholar]
- 16.Jahoor F, Gazzard B, Phillips G, et al. The acute-phase protein response to human immunodeficiency virus infection in human subjects. Am J Physiol. 1999;276:E1092–8. doi: 10.1152/ajpendo.1999.276.6.E1092. [DOI] [PubMed] [Google Scholar]
- 17.Lau B, Sharrett AR, Kingsley LA, et al. C-reactive protein is a marker for human immunodeficiency virus disease progression. Arch Intern Med. 2006;166:64–70. doi: 10.1001/archinte.166.1.64. [DOI] [PubMed] [Google Scholar]
- 18.Feldman JG, Goldwasser P, Holman S, DeHovitz J, Minkoff H. C-reactive protein is an independent predictor of mortality in women with HIV-1 infection. J Acquir Immune Defic Syndr. 2003;32:210–14. doi: 10.1097/00126334-200302010-00014. [DOI] [PubMed] [Google Scholar]
- 19.Henry K, Kitch D, Dube M, et al. C-Reactive protein levels over time and cardiovascular risk in HIV-infected individuals suppressed on an indinavir-based regimen: AIDS Clinical Trials Group 5056s. Aids. 2004;18:2434–7. [PubMed] [Google Scholar]
- 20.Chaudhary M, Kashyap B, Gautam H, Saini S, Bhalla P. Role of C-reactive protein in HIV infection: a pilot study. Viral Immunol. 2008;21:263–6. doi: 10.1089/vim.2007.0083. [DOI] [PubMed] [Google Scholar]
- 21.Wolf K, Tsakiris DA, Weber R, Erb P, Battegay M. Antiretroviral therapy reduces markers of endothelial and coagulation activation in patients infected with human immunodeficiency virus type 1. J Infect Dis. 2002;185:456–62. doi: 10.1086/338572. [DOI] [PubMed] [Google Scholar]
- 22.Madden E, Lee G, Kotler DP, et al. Association of antiretroviral therapy with fibrinogen levels in HIV-infection. Aids. 2008;22:707–15. doi: 10.1097/QAD.0b013e3282f560d9. [DOI] [PMC free article] [PubMed] [Google Scholar]
- 23.Periard D, Telenti A, Sudre P, et al. Atherogenic dyslipidemia in HIV-infected individuals treated with protease inhibitors. The Swiss HIV Cohort Study. Circulation. 1999;100:700–5. doi: 10.1161/01.cir.100.7.700. [DOI] [PubMed] [Google Scholar]
- 24.Kuller LH, Tracy R, Belloso W, et al. Inflammatory and coagulation biomarkers and mortality in patients with HIV infection. PLoS Med. 2008;5:e203. doi: 10.1371/journal.pmed.0050203. [DOI] [PMC free article] [PubMed] [Google Scholar]
- 25.Gunther K, Dhlamini B. d-Dimer levels are markedly raised in HIV-related thrombotic thrombocytopenic purpura. Aids. 2007;21:1063–4. doi: 10.1097/QAD.0b013e328010e276. [DOI] [PubMed] [Google Scholar]
- 26.Senaldi G, Peakman M, McManus T, Davies ET, Tee DE, Vergani D. Activation of the complement system in human immunodeficiency virus infection: relevance of the classical pathway to pathogenesis and disease severity. J Infect Dis. 1990;162:1227–32. doi: 10.1093/infdis/162.6.1227. [DOI] [PubMed] [Google Scholar]
- 27.Robinson WE. Mechanism for complement-mediated, antibody-dependent enhancement of human immunodeficiency virus type 1 infection in MT2 cells is enhanced entry through CD4, CD21, and CXCR4 chemokine receptors. Viral Immunol. 2006;19:434–47. doi: 10.1089/vim.2006.19.434. [DOI] [PubMed] [Google Scholar]
- 28.Prohaszka Z, Nemes J, Hidvegi T, et al. Two parallel routes of the complement-mediated antibody-dependent enhancement of HIV-1 infection. Aids. 1997;11:949–58. doi: 10.1097/00002030-199708000-00002. [DOI] [PubMed] [Google Scholar]
- 29.Cleve H, Weidinger S, Gurtler LG, Deinhardt F. AIDS: no association with the genetic systems GC (d-binding protein), ORM (orosomucoid = alpha-1-acid glycoprotein), and A2HS (alpha-2-HS-glycoprotein) Infection. 1988;16:31–5. doi: 10.1007/BF01646929. [DOI] [PubMed] [Google Scholar]
- 30.Kalabay L, Jakab L, Prohaszka Z, et al. Human fetuin/alpha2HS-glycoprotein level as a novel indicator of liver cell function and short-term mortality in patients with liver cirrhosis and liver cancer. Eur J Gastroenterol Hepatol. 2002;14:389–94. doi: 10.1097/00042737-200204000-00009. [DOI] [PubMed] [Google Scholar]
- 31.Porter BO, Shen J, Kovacs JA, et al. Interleukin-2 cycling causes transient increases in high-sensitivity C-reactive protein and d-dimer that are not associated with plasma HIV-RNA levels. Aids. 2009;23:2015–19. doi: 10.1097/QAD.0b013e32832d72c6. [DOI] [PMC free article] [PubMed] [Google Scholar]
- 32.Mancini G, Carbonara AO, Heremans JF. Immunochemical quantitation of antigens by single radial immunodiffusion. Immunochemistry. 1965;2:235–54. doi: 10.1016/0019-2791(65)90004-2. [DOI] [PubMed] [Google Scholar]
- 33.[Anonymous] 1994 revised guidelines for the performance of CD4+ T-cell determinations in persons with human immunodeficiency virus (HIV) infections. Centers for Disease Control and Prevention. MMWR Recomm Rep. 1994;43:1–21. RR-3. [PubMed] [Google Scholar]
- 34.Hack CE, Ogilvie AC, Eisele B, Eerenberg AJ, Wagstaff J, Thijs LG. C1-inhibitor substitution therapy in septic shock and in the vascular leak syndrome induced by high doses of interleukin-2. Intens Care Med. 1993;19(Suppl. 1):S19–S28. doi: 10.1007/BF01738946. [DOI] [PubMed] [Google Scholar]
- 35.Ogilvie AC, Baars JW, Eerenberg AJ, et al. A pilot study to evaluate the effects of C1 esterase inhibitor on the toxicity of high-dose interleukin 2. Br J Cancer. 1994;69:596–8. doi: 10.1038/bjc.1994.109. [DOI] [PMC free article] [PubMed] [Google Scholar]
- 36.Volanakis JE. Complement activation by C-reactive protein complexes. Ann NY Acad Sci. 1982;389:235–50. doi: 10.1111/j.1749-6632.1982.tb22140.x. [DOI] [PubMed] [Google Scholar]
- 37.Abrams DI, Bebchuk JD, Denning ET, et al. Randomized, open-label study of the impact of two doses of subcutaneous recombinant interleukin-2 on viral burden in patients with HIV-1 infection and CD4+ cell counts of > or = 300/mm3: CPCRA 059. J Acquir Immune Defic Syndr. 2002;29:221–31. doi: 10.1097/00126334-200203010-00002. [DOI] [PubMed] [Google Scholar]
- 38.Davey RT, Jr, Murphy RL, Graziano FM, et al. Immunologic and virologic effects of subcutaneous interleukin 2 in combination with antiretroviral therapy: a randomized controlled trial. JAMA. 2000;284:183–9. doi: 10.1001/jama.284.2.183. [DOI] [PubMed] [Google Scholar]
- 39.Jacobson EL, Pilaro F, Smith KA. Rational interleukin 2 therapy for HIV positive individuals: daily low doses enhance immune function without toxicity. Proc Natl Acad Sci USA. 1996;93:10405–10. doi: 10.1073/pnas.93.19.10405. [DOI] [PMC free article] [PubMed] [Google Scholar]