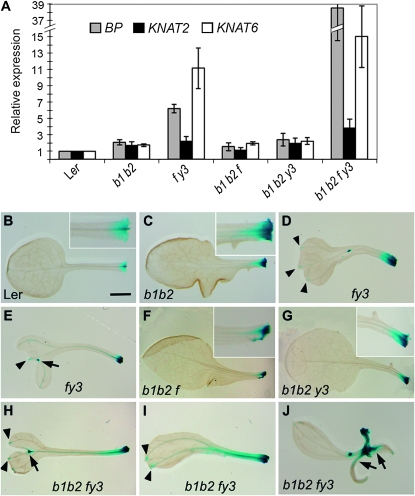
Figure 4.—
Analysis of class 1 KNOX gene expression. (A) BP, KNAT2, and KNAT6 expression in the developing young leaves of 21-day-old seedlings. Mean transcript levels were determined by real-time quantitative PCR analyses and normalized to EF1α. Error bars represent SD. b1 b2, bop1-4 bop2-11; f y3, fil-8 yab3-2. pBP∷GUS activity in (B) Ler, (C) bop1 bop2, (D and E) fil-5 yab3-1, (F) bop1 bop2 fil-5, (G) bop1 bop2 yab3-1, and (H–J) bop1 bop2 fil-8 yab3-2 rosette leaves. Insets in B, C, F, and G are magnified views of the leaf base. Arrowheads indicate BP∷GUS activity in hydathodes. Arrows in E and H indicate BP∷GUS activity in bifurcated leaves. Arrows in J indicate BP∷GUS misexpression in developing ectopic organs.

