Abstract
Since genome size and the number of duplicate genes observed in genomes increase from haploid to diploid organisms, diploidy might provide more evolutionary probabilities through gene duplication. It is still unclear how diploidy promotes genomic evolution in detail. In this study, we explored the evolution of segmental gene duplication in haploid and diploid populations by analytical and simulation approaches. Results show that (1) under the double null recessive (DNR) selective model, given the same recombination rate, the evolutionary trajectories and consequences are very similar between the same-size gene-pool haploid vs. diploid populations; (2) recombination enlarges the probability of preservation of duplicate genes in either haploid or diploid large populations, and haplo-insufficiency reinforces this effect; and (3) the loss of duplicate genes at the ancestor locus is limited under recombination while under complete linkage the loss of duplicate genes is always random at the ancestor and newly duplicated loci. Therefore, we propose a model to explain the advantage of diploidy: diploidy might facilitate the increase of recombination rate, especially under sexual reproduction; more duplicate genes are preserved under more recombination by originalization (by which duplicate genes are preserved intact at a special quasi-mutation-selection balance under the DNR or haplo-insufficient selective model), so genome sizes and the number of duplicate genes in diploid organisms become larger. Additionally, it is suggested that small genomic rearrangements due to the random loss of duplicate genes might be limited under recombination.
USUALLY genome size becomes larger from haploid to diploid organisms (Lynch and Conery 2003), and so does the number of duplicate genes observed in genomes (Zhang 2003). It is extensively hypothesized that diploidy might facilitate the preservation and accumulation of duplicate genes, but it is still unclear how diploidy supports the evolution of duplicate genes in detail. The superiority of diploidy is classically attributed to preventing expression of deleterious mutations (Crow and Kimura 1965), but it is also argued that the sheltering of deleterious mutations cannot adequately explain the advantages of diploidy (Perrot et al. 1991).
Recombination is a common phenomenon in all three kingdoms of life, Bacteria, Eukarya, and Archaea. It has been reported that recombination influences the loss of duplicate genes (Zhang and Kishino 2004; Xue et al. 2010). In diploid organisms, if recombination between the ancestor locus and the newly duplicated locus is free, the rate of recombination is maximally 0.5, which is commonly observed especially when the two loci are located on different chromosomes. Although recombination should not be regarded as an exception in haploid organisms (Fraser et al. 2007), recombination events usually occur more frequently in diploid populations than they do in haploid populations. In other words, diploidy might facilitate the occurrence of recombination. The difference of recombination behaviors between haploid and diploid organisms is an obvious and important feature during genomic evolution.
In our recent studies of genomic duplication, we proposed a new possible way of preserving and accumulating duplicate genes in genomes—originalization (Xue and Fu 2009a). As is well known, for a locus in an infinite diploid population, the frequencies of wild-type and degenerative alleles will move to an equilibrium under purifying selection and mutation, which is known as the mutation–selection balance. After genomic duplication, under two simple selective models, double null recessive (DNR, under which valid individuals require at least one active wild-type allele on the ancestor and newly duplicated loci) and haplo-insufficient (HI or partial dominant, under which valid individuals require at least two active wild-type alleles on both loci) models, a special equilibrium of allele frequencies at the ancestor and newly duplicated loci will be reached under recombination, in which the frequency of wild-type allele is kept high at both loci. Under the HI selective model this balance becomes so stable and flexible that the fixation of a degenerative allele at one of these two loci (or the balance being broken) becomes very difficult even in a modest population (Xue and Fu 2009a,b). However, if the two loci are tightly linked (recombination rate r = 0), this balance of allele frequencies does not appear. As r increases, the balance becomes more stable and the frequency of the wild-type allele at two loci becomes higher. High frequency of the wild-type allele at both loci means that duplicate genes are preserved intact in genomes, so this phenomenon was named originalization.
Although many duplicate genes originated from genomic duplications in some species, such as yeast, maize, and fish (Li et al. 2005), those from segmental duplications are also very popular (Zhang et al. 2000; Leister 2004). In haploid populations, most duplication events are small segmental duplications. Therefore, to understand genomic evolution comprehensively, it is necessary to explore the evolution of segmental genomic duplication.
Lynch et al. (2001) and Tanaka et al. (2009) have studied the evolution of segmental gene duplication in diploid populations theoretically. However, in this study, we further compared the evolution of segmental gene duplication in haploid vs. diploid populations by numerical and simulation approaches under the DNR and HI selective models. We observed that haploid and diploid populations with the same-size gene pool are very similar under the DNR model and the same recombination rate. Recombination enlarges the probability of preservation of duplicate genes in either haploid or diploid populations via originalization, and haplo-insufficiency reinforces this effect. The loss of duplicate genes at the ancestor locus might be limited under recombination, while under complete linkage, the loss of duplicate genes is random at the ancestor and newly duplicated loci. According to these results, we propose a model with which to explain the revolutionary genomic transition from haploidy to diploidy.
ASSUMPTIONS AND METHODS
Consider a newly arisen locus after a small segmental duplication in haploid and diploid populations. Under the Wright–Fisher model, initially only one or a few gametes with the newly arisen duplicated locus (also called chromosomal haplotype containing duplicated locus, CHDL) appear in the gene pool. Only considering the silencing of duplicate genes, there are several outcomes for the genome: (1) the CHDL is lost by genetic drift in the population, and the genome remains unchanged; (2) the CHDL is fixed by genetic drift, but eventually the function of the gene at the newly duplicated locus is lost and the newly duplicated locus is removed from genomes, which also does not result in genome change; and (3) the CHDL is fixed by genetic drift, but eventually the function of the gene at the ancestor locus is completely lost, which might result in genome changes. To explore the evolutionary trajectory and consequence of the CHDL, some parameters, such as the probability of the CHDL being lost (Plost) by genetic drift, the probabilities of nonfunctionalization at the ancestor locus (Pnon1) and the newly duplicated locus (Pnon2), and the probability of preservation by originalization (Pori), etc., are the main focus of this study.
As described in our previous studies (Xue and Fu 2009a,b), chromosomal haplotype frequency is employed to present various genotypes. According to the above assumptions, there are six possible types of chromosomal haplotypes in the gene pool, namely, 00, 01, 10, 11, 0N, 1N, respectively, in which 0, 1, and N denote the wild-type allele, mutant (lost function) allele, and no duplicate gene, respectively; the first letter denotes the allele at the ancestor locus (locus 1), and the latter denotes the allele at the newly duplicated locus (locus 2). In haploid populations, let x0, x1, x2, x3, x4, x5 be the frequencies of chromosomal haplotypes, 00, 01, 10, 11, 0N, and 1N, respectively; in diploid populations, let y0, y1, y2, y3, y4, y5 be the frequencies of these chromosomal haplotypes. The chromosome haplotype is the genotype in haploid populations but not in diploid. Thus, at every generation, Plost denotes the probability of the CHDL being lost by genetic drift and is equal to x4 + x5 in haploid populations or y4 + y5 in diploid populations; Pnon1 denotes the probability of nonfunctionalization at the ancestor locus and is equal to x2 + x3 in haploid populations or y2 + y3 in diploid populations; Pnon2 denotes the probability of nonfunctionalization at the newly duplicated locus and is equal to x1 + x3 in haploid populations or y1 + y3 in diploid populations; Pori denotes the probability of nonfunctionalization not occurring at both the ancestor and newly duplicated loci (or called the probability of preservation by originalization); and we select x0 in haploid populations and y0 in diploid populations as the proxy as previously described (Xue and Fu 2009a,b). In finite populations, at the fixation of the CHDL, Plost must be 0; at nonfunctionalization on the ancestor locus or the newly duplicated locus, Pori must be 0, and one of Pnon1 and Pnon2 must be 1.
In haploid populations, the purifying selective model is the double null recessive or haplo-sufficient. Assume the relative fitness of genotypes 00, 01, 10, 11, 0N, and 1N, are assigned to be 1, 1, 1, 0, 1, and 0, respectively. Differential changes of frequencies of various chromosomal haplotypes over a generation without considering genetic drift is given by a a group of ordinary differential equations (ODEs),
 |
(1) |
where μ is the degenerative mutation rate for both loci, and r is the homologous recombination rate between the duplicated loci.
In diploid populations, the purifying selection models are DNR and HI as used in our previous studies (Xue and Fu 2009a,b). The fitness of individuals with different genotypes is shown in Table 1. The mean population fitness (w) and differential changes of chromosomal haplotypes over one generation are given by
 |
(2) |
where s1 = 0 under the DNR selective model and s1 = 1 under the HI selective model.
TABLE 1.
Fitnesses of individual genotypes in diploid populations
| Chromosomal haplotypes | 00 | 01 | 10 | 11 | 0N | 1N |
|---|---|---|---|---|---|---|
| 00 | 1 | 1 | 1 | 1 | 1 | 1 |
| 01 | 1 | 1 | 1 | 1 − s1 | 1 | 1 − s1 |
| 10 | 1 | 1 | 1 | 1 − s1 | 1 | 1 − s1 |
| 11 | 1 | 1 − s1 | 1 − s1 | 0 | 1 − s1 | 0 |
| 0N | 1 | 1 | 1 | 1 − s1 | 1 | 1 − s1 |
| 1N | 1 | 1 − s1 | 1 − s1 | 0 | 1 − s1 | 0 |
Under the DNR selective model, s1 = 0, while under the HI selective model, s1 = 1.
In numerical analysis, assuming population size is infinite, initially let x0 = 0.01, x4 = 0.99 in haploid populations, and y0 = 0.01, y4 = 0.99 in diploid populations; in simulation, assuming population size is finite, initially let x0 = 1/N, x4 = 1 − 1/N in haploid populations, and y0 = 1/(2N), y4 = 1 − 1/(2N) in diploid populations. Numerical and simulation methods have been described in detail in our previous studies (Xue and Fu 2009a,b). In simulation, if the newly arisen CHDL is lost by genetic drift, this gene duplication does not result in genome changes. So only those cases in which a CHDL is successfully fixed are recorded and counted in simulation. On the basis of Equations 1 and 2, numerical and simulation results are obtained with μ = 10−5.
Assuming infinite population sizes we use analytical methods to explore the dynamic changes of chromosome haplotype frequencies, and for finite populations we use simulation methods to determine the impact of stochastic processes such as genetic drift.
NUMERICAL RESULTS
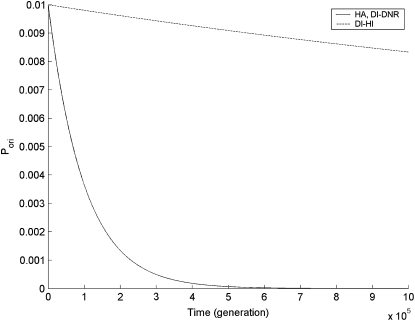
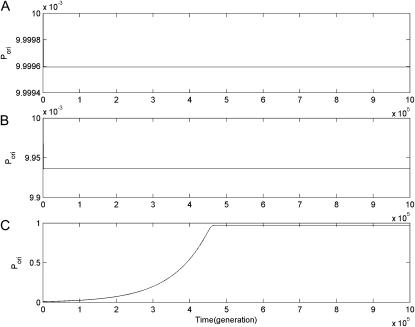
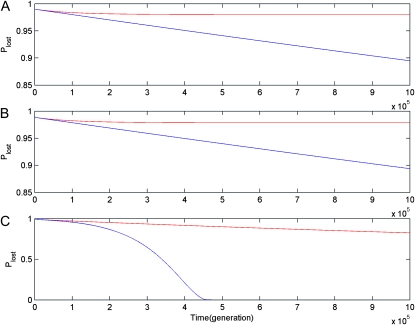
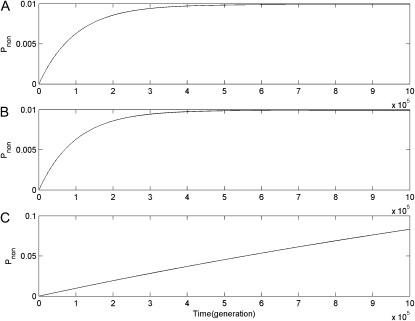
Several features about the evolution of segmental gene duplication in infinite haploid and diploid populations can be obtained from the numerical results. First, given completely linked (r = 0) or unlinked (r = 0.5) duplicate genes, under the DNR selective model, dynamic changes of chromosomal haplotype frequencies in haploid and diploid populations are very similar, for example, the behaviors of Pori in haploid and diploid populations (see Figure 1 and 2), Plost (see Figure 3), Pnon1 and Pnon2 (see Figure 4 and 5). These observations indicate that under the DNR selective model, given the recombination rate between the ancestor and newly duplicated loci (r = 0 or 0.5), the evolutionary trajectories and fate of segmental gene duplications in haploid and diploid populations are very similar.
Figure 1.—
Dynamic changes of the probability of preservation of duplicate genes by originalization (Pori) in infinite haploid vs. diploid populations, under complete linkage (r = 0) and μ = 10−5. Numerical results of Pori under the DNR selective model in a haploid population (HA) and under the DNR selective model in a diploid population (DI_DNR) share the solid curve, while the dashed curve shows numerical results under the HI selective model in a diploid population (DI_HI).
Figure 2.—
Dynamic changes of the probability of preservation of duplicate genes by originalization (Pori) in infinite haploid vs. diploid populations, under free recombination (r = 0.5) and μ = 10−5. Numerical results of Pori in subplot A, B, and C are obtained under the DNR selective model in a haploid population, under the DNR selective model in a diploid population, and under the HI selective model in a diploid population, respectively.
Figure 3.—
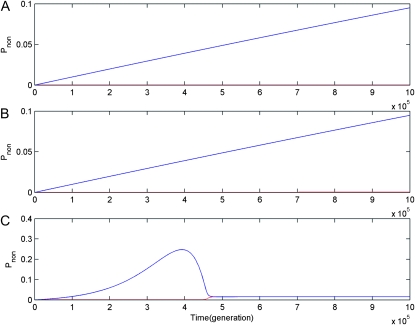
Dynamic changes of the probability of the CHDL being lost (Plost) with μ = 10−5. Numerical results in subplot A, B, and C are obtained under the DNR selective model in a haploid population, under the DNR selective model in a diploid population, and under the HI selective model in a diploid population, respectively. Blue and red curves are results for linked (r = 0) and unlinked (r = 0.5) gene duplications, respectively.
Figure 4.—
Dynamic changes of the probabilities of nonfunctionalization at the ancestor (Pnon1) and newly duplicated (Pnon2) loci in infinite haploid vs. diploid populations under complete linkage (r = 0) and μ = 10−5. Numerical results in subplot A, B, and C are obtained under the DNR selective model in a haploid population, under the DNR selective model in a diploid population, and under the HI selective model in a diploid population, respectively. In each subplot, solid and dashed curves are of Pnon1 and Pnon2, but they are completely coincident.
Figure 5.—
Dynamic changes of the probabilities of nonfunctionalization at the ancestor (Pnon1) and newly duplicated (Pnon2) loci in infinite haploid vs. diploid populations under free recombination (r = 0.5) and μ = 10−5. Numerical results in subplot A, B, and C are obtained under the DNR selective model in a haploid population, under the DNR selective model in a diploid population, and under the HI selective model in a diploid population, respectively. Red and blue curves are of Pnon1 and Pnon2, respectively.
Second, for a completely linked (r = 0) gene duplication, under either the DNR or HI selective models, Pori decreases exponentially and continually (see Figure 1). However, for unlinked (r = 0.5), under the DNR selective model it decreases down to equilibrium and this equilibrium is maintained in either haploid or diploid infinite populations (see Figure 2, A and B); in a diploid population, under the HI selective model Pori quickly increases from very low to very high, and then maintains a high level (∼1) (Figure 2C). Within increased recombination, higher Pori in the population has been observed in our previous studies on genomic duplication and named originalization (Xue and Fu 2009a). Obviously, this phenomenon also appears in the evolution of segmental gene duplication. Originalization is an effective and temporary way of preserving duplicate genes on the road to neofunctionalization (Xue and Fu 2009a). It is not a final evolutionary fate—ultimate preservation—but a mediated process of preservation on the road to final preservation—neofunctionalization. Because the transition from wild-type to advantageous allele occurs more frequently than that from degenerative (or mutant) to advantageous, higher Pori (x0 or y0) might increase the probability of neofunctionalization (Xue and Fu 2009a). Additionally, because of higher Pori the probability of preservation of CHDL for unlinked gene duplication might be larger than for linked in finite populations, and mean time to nonfunctionalization may also be prolonged as observed in our previous studies on genomic duplication (Xue and Fu 2009a,b), especially in diploid populations under the HI selective model.
Third, results for dynamic changes of Plost show that Plost decreases more slowly for linked gene duplication than it does for unlinked, and for unlinked gene duplication Plost decreases to nearly 0 in diploid populations under the HI selective model (see Figure 3). These observations indicate that the probability of the CHDL being lost for unlinked gene duplication is much smaller than for linked, or the probability of the CHDL being preserved is much larger with increased recombination.
Fourth, for linked gene duplication, dynamic changes of Pnon1 and Pnon2 at the ancestor and newly duplicated loci are coincident (see Figure 4), which indicates that if the ancestor locus and the newly duplicated locus originated from segmental gene duplication are completely linked, the loss of duplicate genes due to gene silencing is random at these two loci. However, for unlinked gene duplication, observations are quite different. In haploid and diploid populations, under the DNR selective model Pnon2 increases while Pnon1 is kept very low all the time (see Figure 6, A and B); under the HI selective model, in diploid populations, Pnon2 increases first, and then it drops down while Pnon1 is small all the time. These indicate that under recombination the final loss of duplicate genes might preferentially occur at the newly duplicated locus and not at random.
Figure 6.—
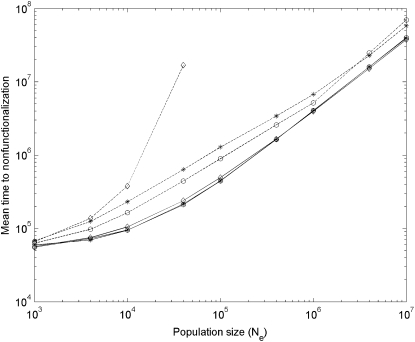
Simulation results of mean time to nonfunctionalization after segmental gene duplication in haploid vs. diploid populations with μ = 10−5. Solid and dashed curves are results for linked (r = 0) and unlinked (r = 0.5) gene duplication, respectively; asterisks, circles, and diamonds are results under the DNR selective model in haploid populations, under the DNR selective model in diploid populations, and under the HI selective model in diploid populations, respectively. When N > 40000 (or Nμ > 0.4), nonfunctionalization for unlinked gene duplication is difficult to reach under the HI selective model. Simulation repeats 2000 times.
SIMULATION RESULTS
On the basis of the above predictions from numerical results obtained in infinite populations, corresponding observations in finite populations are focused in simulation. When we compare same-size gene pools in haploid vs. diploid populations, the number of individuals in the haploid population is actually twice that of the diploid population.
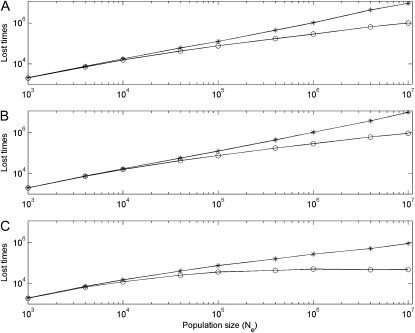
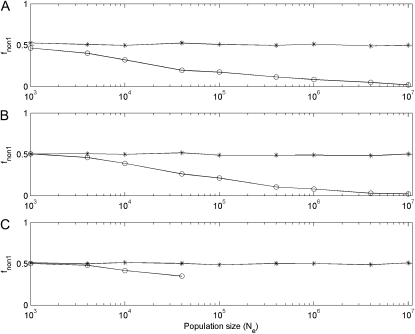
First, from the numerical results, it is expected that under the DNR selective model, given the same recombination rate, the evolutionary fates of duplicate genes are very similar in finite haploid vs. diploid populations. Simulation results show that in the same-size gene-pool (population size 2N in a haploid population vs. population size N in a diploid population) haploid and diploid populations, mean times to nonfunctionalization are close (see Figure 6). The trial times of the CHDL being lost by genetic drift before successful fixation in the population (LOST_TIMES) (see Figure 7) and the proportion of nonfunctionalization finally occurring at the ancestor locus (fnon1) (see Figure 8) are also similar. These results indicate that under the DNR selective model and given the same recombination rate the evolution of gene duplication is similar in haploid and diploid populations.
Figure 7.—
Simulation results of the lost times of the CHDL in haploid vs. diploid populations with μ = 10−5 before it is successfully fixed in the population. Asterisks and circles are simulation results for linked and unlinked gene duplication, respectively. Simulation results in subplot A are obtained under the DNR selective model in haploid populations with population sizes 2N; in subplot B simulation results are obtained in diploid populations under the DNR selective model with population sizes N; in subplot C results are obtained in diploid populations under the HI selective model with population sizes N. Simulation repeats 2000 times.
Figure 8.—
Simulation results of the proportion of nonfunctionalization finally occurring at the ancestor locus (fnon1) after segmental gene duplication in haploid vs. diploid populations with μ = 10−5. Asterisks and circles are simulation results for linked and unlinked gene duplication, respectively. Simulation results in subplot A are obtained under the DNR selective model in haploid populations with population sizes 2N; in subplot B results are obtained in diploid populations under the DNR selective model with population sizes N; in subplot C results are obtained in diploid populations under the HI selective model with population sizes N. In subplot C, when N > 40000 (or Nμ > 0.4), under the HI selective model nonfunctionalization for unlinked gene duplication is difficult to reach because of much prolonged time to nonfunctionalization. Simulation repeats 2000 times.
Second, the numerical results predicted that in large haploid and diploid populations the probability of preservation of duplicate genes for unlinked gene duplication is larger than for linked, and mean time to nonfunctionalization (Tnon) is prolonged. The simulations assume that a CDHL appears in the gene pool. If this CHDL is lost by genetic drift, the simulation will restart and a new CHDL appears again, while this failed trial is recorded and counted. LOST_TIMES is the trial time until the CHDL is successfully fixed in the population. We record LOST_TIMES as a proxy of the probability of CHDL preservation. If this parameter is small, it is more likely that the CHDL is fixed in the population. Simulation results show that in haploid and diploid populations when the population size is not small (roughly Nμ > 0.1), LOST_TIMES for unlinked gene duplication is smaller than that for linked (see Figure 7), indicating that the probability of fixation of the CHDL is larger under recombination. To observe the probability of preservation of duplicate genes more clearly, we also observed another parameter—mean time to nonfunctionalization (Tnon). Results show that when Nμ > 0.1, Tnon for unlinked gene duplication is usually larger than for linked (see Figure 6), suggesting that the probability of preservation of duplicate genes is larger under recombination.
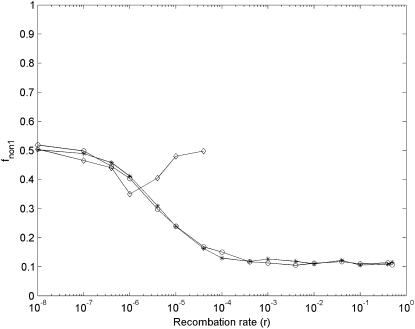
Third, the last feature from the numerical results suggests that for unlinked segmental gene duplication the proportion of nonfunctionalization finally occurring at the ancestor locus (fnon1) might be larger than at the newly duplicated locus (fnon2) in large finite haploid and diploid populations, and for linked segmental gene duplication, fnon1 is always ∼0.5. There are only two outcomes for nonfunctionalization: occurrence at the ancestor locus or at the newly duplicated locus. In simulation results, for linked gene duplication (r = 0), fnon1 ≈ 0.5 (see Figure 8). However, for unlinked (r = 0.5), when N is larger, fnon1 becomes smaller and smaller (see Figure 9). These simulation results are quite consistent with the prediction from the numerical results, but different from those of Lynch et al. (2001). They observed in simulation that for unlinked segmental gene duplication when Nμ < 10, fnon1 is ∼0.5, and when Nμ > 10, fnon1 suddenly drops down; for linked, when Nμ > 0.1, fnon1 continually increases (see Figure 3 in Lynch et al. 2001). Using another algorithm—individual-based simulation algorithm—we obtained the same results as with our gamete-based algorithm.
Figure 9.—
Simulation results of the proportion of nonfunctionalization finally occurring at the ancestor locus (fnon1) after segmental gene duplication in haploid vs. diploid populations as a function of recombination rates with μ = 10−5. Asterisks, circles, and diamonds are simulation results under the DNR selective model in a haploid population (N = 800000), under the DNR selective population in a diploid population (N = 400000), and under the HI selective model in a diploid population (N = 400000), respectively. When r > 4 × 10⁻⁵, under the HI selective model, nonfunctionalization for unlinked gene duplication is difficult to reach because of much prolonged time to nonfunctionalization. Simulation repeats 2000 times.
Additionally, the above simulation results were obtained under two extreme conditions—completely linked (r = 0) and unlinked (r = 0.5) gene duplication. For most loci, recombination rates range between 0 and 0.5, so we performed simulations with 0 < r < 1 (Figure 9). Simulation results clearly indicate that under the DNR selective model, fnon1 decreases as r becomes larger even in a modest (Nμ = 0.4) population. Tnon and LOST_TIMES also support that as r is larger the probability of preservation of duplicate genes becomes larger (data not shown).
DISCUSSION
This study makes several noteworthy conclusions for segmental gene duplication: (1) Under the DNR selective model, given the same recombination rate, the evolutionary trajectories and consequences are very similar between the same-size gene-pool haploid vs. diploid populations; (2) recombination increases the probability of preservation of duplicate genes in either large haploid or diploid populations, and haplo-insufficiency reinforces this effect; and (3) the loss of duplicate genes at the ancestor locus is limited under recombination (however, under complete linkage the loss of duplicate genes is always random at the ancestor and newly duplicated loci). These conclusions advance our understanding of genomic evolution after gene duplication.
As is well known and documented, gene duplication provides fundamental materials for genomic evolution. There are haploid and diploid populations in the world, and usually genome size in diploid populations is larger than in haploid. Our study attempts to address some basic questions about genomic evolution. What is the merit of the transition from haploid organisms to diploid organism? Are there any advantages in a diploid population to preserving duplicate genes or evolving new genes? Our results show that the fate of duplicate genes is similar for haploid and diploid populations under the DNR selective model when they share the same recombination rate and same gene-pool size. In diploid populations with sexual reproduction, recombination rates between two considered loci can be as high as 0.5, which is nearly inaccessible in haploid populations. Therefore, combining this suggestion with our results obtained above, we propose a theoretical framework (or model) to explain a merit of diploidy: (1) The transition from haploid to diploid might facilitate the increase of recombination rate; (2) higher recombination rates cause the preservation of more duplicate genes in genomes; and (3) the retention of more duplicate genes provides more opportunities for genetic novelty, and finally results in the increase of genome size in diploid organisms.
It has been reported that the difference between DNA sequences becomes larger as the rate of homologous recombination is smaller in bacteria (Fraser et al. 2007). Thus, Fraser et al. (2007) proposed that speciation in bacteria might not result from fundamental ecological constraints or geographic separation, but the decreasing rate of homologous recombination. Our theoretical results in this study also support their observations and proposition. After segmental DNA duplication, because population sizes in bacterial populations are usually large, higher recombination rates will result in the higher frequency of wild-type alleles at both duplicated loci, in which functional genes on the ancestor and newly duplicated loci seem unchanged. Thus, the diversity between DNA sequences of genes in a family looks very small, which might be observed as homogenization.
Another interesting observation in this study is that recombination limits the loss of duplicate genes at the ancestor locus, which means that genomic rearrangement due to the random loss of duplicate genes after gene duplication is inhibited under recombination. Under conventional understanding of the relationship between gene duplication and speciation, the random loss of duplicate genes is an important trigger for some types of speciation (Li 1980; Lynch and Force 2000; Lynch 2002), so our results obtained in this study are helpful in understanding the relationship between recombination and speciation more clearly.
Acknowledgments
We thank anonymous reviewers for many valuable comments. The publication of this paper is financially supported by Guangdong Natural Science Foundation 9151026005000002.
References
- Crow, J., and M. Kimura, 1965. Evolution in sexual and asexual populations. Am. Nat. 99 439–450. [Google Scholar]
- Fraser, C., W. Hanage and B. Spratt, 2007. Recombination and the nature of bacterial speciation. Science 315(5811): 476–480. [DOI] [PMC free article] [PubMed] [Google Scholar]
- Leister, D., 2004. Tandem and segmental gene duplication and recombination in the evolution of plant disease resistance genes. Trends Genet. 20 116–122. [DOI] [PubMed] [Google Scholar]
- Li, W-H, 1980. Rate of gene silencing at duplicate loci: a theoretical study and interpretation of data from tetraploid fishes. Genetics 95 237–258. [DOI] [PMC free article] [PubMed] [Google Scholar]
- Li, W-H, J. Yang and X. Gu, 2005. Expression divergence between duplicate genes. Trends Genet. 21 602–607. [DOI] [PubMed] [Google Scholar]
- Lynch, M., 2002. Gene duplication and evolution. Science 297 945–947. [DOI] [PubMed] [Google Scholar]
- Lynch, M., and J. S. Conery, 2003. The origins of genome complexity. Science 302 1401–1404. [DOI] [PubMed] [Google Scholar]
- Lynch, M., and A. Force, 2000. The probability of duplicate gene preservation by subfunctionalization. Genetics 154 459–473. [DOI] [PMC free article] [PubMed] [Google Scholar]
- Lynch, M., M. O'Hely, B. Walsh and A. Force, 2001. The probability of preservation of a newly arisen gene duplicate. Genetics 159 1789–1804. [DOI] [PMC free article] [PubMed] [Google Scholar]
- Perrot, V., S. Richerd and M. Valero, 1991. Transition from haploidy to diploidy. Nature 351 315–317. [DOI] [PubMed] [Google Scholar]
- Tanaka, K. M., K. R. Takahasi and T. Takano-shimizu, 2009. Enhanced fixation and preservation of a newly arisen duplicate gene by masking deleterious loss-of-function mutations. Genet. Res. 91 267–280. [DOI] [PubMed] [Google Scholar]
- Xue, C., and Y. Fu, 2009. a Preservation of duplicate genes by originalization. Genetica 136 69–78. [DOI] [PubMed] [Google Scholar]
- Xue, C., and Y. Fu, 2009. b Mean time to resolution of gene duplication. Genetica 136 119–126. [DOI] [PubMed] [Google Scholar]
- Xue, C., R. Huang, S-Q Liu and Y-X Fu, 2010. Recombination facilitates neofunctionalization of duplicate genes via originalization. BMC Genet. 11 46. [DOI] [PMC free article] [PubMed] [Google Scholar]
- Zhang, J., 2003. Evolution by gene duplication: an update. Trends Ecol. Evol. 18 292–298. [Google Scholar]
- Zhang, P., S. Chopra and T. Peterson, 2000. A segmental gene duplication generated differentially expressed myb-homologous genes in maize. Plant Cell 12 2311–2322. [DOI] [PMC free article] [PubMed] [Google Scholar]
- Zhang, Z., and H. Kishino, 2004. Genomic background predicts the fate of duplicated genes: evidence from the yeast genome. Genetics 166 1995–1999. [DOI] [PMC free article] [PubMed] [Google Scholar]


