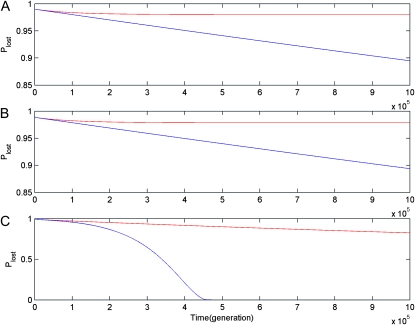
Figure 3.—
Dynamic changes of the probability of the CHDL being lost (Plost) with μ = 10−5. Numerical results in subplot A, B, and C are obtained under the DNR selective model in a haploid population, under the DNR selective model in a diploid population, and under the HI selective model in a diploid population, respectively. Blue and red curves are results for linked (r = 0) and unlinked (r = 0.5) gene duplications, respectively.

