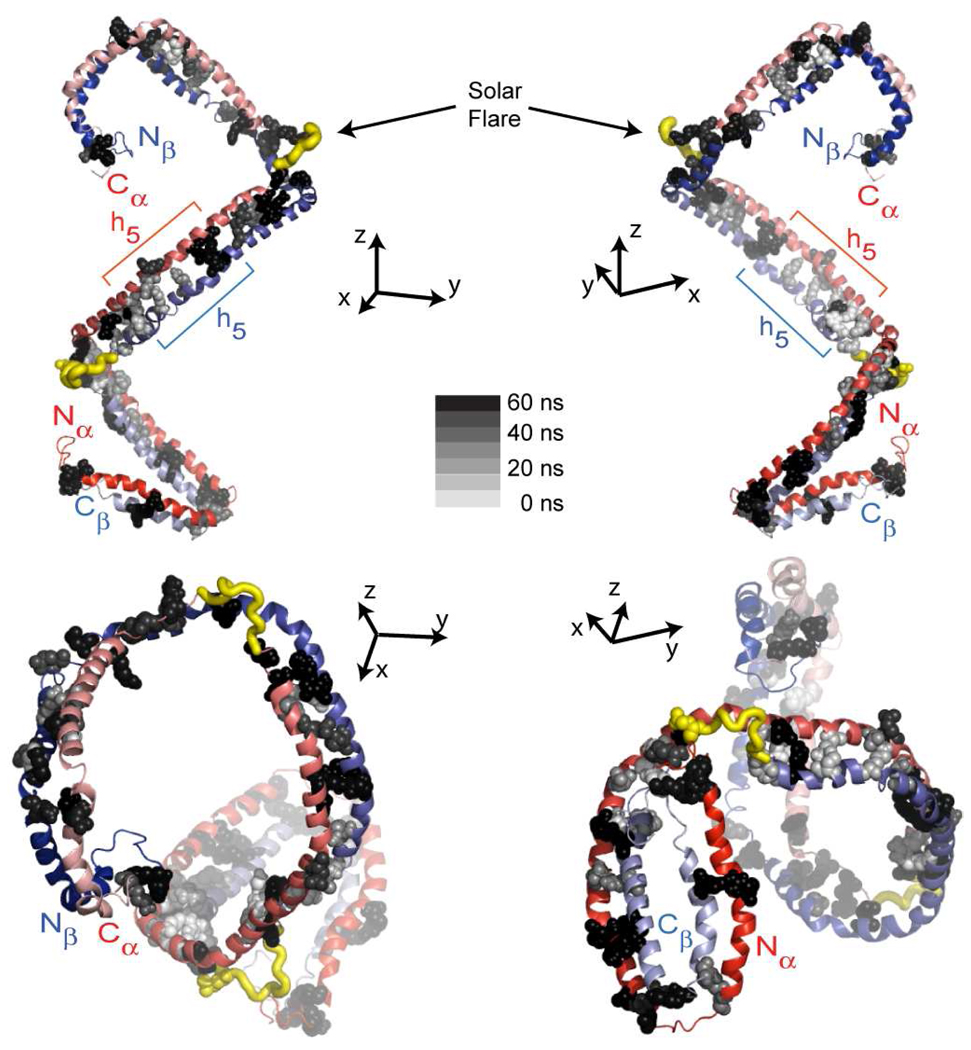
FIGURE 11.
Predicted salt bridge distribution in apoA1 during 60 ns of molecular dynamics simulation. The conformation of apoA1 shown from a different vantage point with the N/C-termini pointing toward/away from the reader. The figure shows that the salt bridges located toward N/C-termini are more persistent (colored black or dark grey) during simulation while those located at the middle region of apoA1 are less persistent (colored light grey).

