Abstract
Across the eukaryotic tree of life, genomes vary within populations and within individuals during their life cycle. Understanding intraspecific genome variation in diverse eukaryotes is key to elucidating the factors that underlie this variation. Here, we characterize genome dynamics during the life cycle of Allogromia laticollaris strain CSH, a member of the Foraminifera, using fluorescence microscopy and reveal extensive variation in nuclear size and DNA content. Both nuclear size and DNA content are tightly correlated across a 700-fold range in cell volume. In contrast to models in yeast where nuclear size is determined solely by cell size, the relationship in A. laticollaris CSH differs according to both life cycle stage and food source. Feeding A. laticollaris CSH a diet that includes algae results in a 2-fold increase in DNA content in reproductive cells compared with a diet of bacteria alone. This difference in DNA content likely corresponds to increased fecundity, as reproduction occurs through segregation of the polyploid nucleus into numerous daughter nuclei. Environmentally mediated variation in DNA content may be a widespread phenomenon, as it has been previously reported in the plant flax and the flagellate Euglena. We hypothesize that DNA content is influenced by food in other single-celled eukaryotes with ploidy cycles and that this genome flexibility may enable these eukaryotes to maximize fitness across changing environmental conditions.
Keywords: fitness, microbial eukaryotes, intraspecific genome variation, ploidy cycle, genome size, nuclear size regulation
Introduction
Emerging data on intraspecific genome variation challenge the traditional view that genomes are stable within species. Across the eukaryotic tree of life, genomic DNA content varies among individuals in populations (Redon et al. 2006; Parfrey et al. 2008; Cheeseman et al. 2009) and even within individuals over the course of the life cycle (Kondrashov 1997; Parfrey et al. 2008; Cohen and Segal 2009). The most common changes in genome content within the life cycle are elevated ploidy level and differential amplification or elimination of portions of the genome (Raikov 1982; Parfrey et al. 2008). The recognition that genome content varies widely over the course of life cycles poses new challenges as we seek to elucidate the factors that regulate genome content within individuals.
Foraminifera present a unique system for studying nuclear dynamics because these single-celled organisms undergo large changes in nuclear and cell size during their life cycle. For example, some Foraminifera grow from 5 μm gametes to adults several centimeters in diameter (Goldstein 1999). Foraminifera are a diverse lineage of eukaryotes with ∼10,000 extant species and a fossil record that dates back to the Cambrian (Sen Gupta 1999). They are defined by their dynamic network of pseudopodia (Bowser and Travis 2002) and are placed within the major eukaryotic clade Rhizaria (Pawlowski and Burki 2009). Additionally, Foraminifera have a range of nuclear features that enable the study of genome dynamics, such as genome processing, polyploidy, and multinuclearity (Arnold 1984; Goldstein 1999).
The life cycles of Foraminifera vary widely among species but generally alternate between uninucleate and multinucleate life cycle phases. These stages are classically thought to be haploid and diploid but polyploidy is reported in some species (Arnold 1955, 1984; Raikov 1982; Goldstein 1999). All Foraminifera that have been studied, including Allogromia laticollaris CSH, go through Zerfall (German for decay), a process of DNA elimination and degradation in the uninucleate cell prior to reproduction (Føyn 1936; Goldstein 1997). The elimination of DNA during Zerfall is evidence of genome processing—portions of the genome are likely differentially amplified during the development of the nucleus prior to being eliminated (Parfrey and Katz 2010).
Here, we assess the nature of variation in genome content in a clonal line of A. laticollaris CSH throughout its life cycle. We measure changes in two nuclear metrics, nuclear size and DNA content, to elucidate genome dynamics. Cultures were grown on two food sources, enabling assessment of the impact of environmental factors on genome variation within a constant genetic background. Allogromia laticollaris CSH is a model system for investigating genome dynamics because its complex life cycle has been described (Lee and McEnery 1970; McEnery and Lee 1976), and this description hints at variation beyond haploidy and diploidy. We use measurements of cell size, nuclear size, and DNA content to address the following hypotheses: 1) genome content remains constant throughout the life cycle and 2) variation in nuclear size and genome content are independent of food source.
Materials and Methods
Cultures
Allogromia laticollaris CSH was originally isolated as a clonal culture from Cold Spring Harbor in 1960 (Lee et al. 1969). Allogromia laticollaris CSH has a much different life cycle than A. laticollaris described and studied by Arnold (1955), and these isolates almost certainly represent different species. Our culture was obtained from Jeffrey Travis (University at Albany) and was grown in 75 cm2 tissue culture flasks in Erdschrieber media and transferred monthly (modified from Travis and Allen 1981). Cultures were propagated with their native bacterial flora and the alga Isochrysis sp. on the bench top. Five bacteria-only cultures were derived from the algal-fed population by isolating and washing 1–50 cells and growing them in 6-well dishes. Cultures could not be successfully grown on bacteria in the absence of flocculent material. Thus, bacteria-only cultures were supplemented with 0.5% wheat extract (wheat grains autoclaved in water) to facilitate bacterial growth and to provide flocculent material for A. laticollaris CSH. Once cultures were established, they were transferred to 75-cm2 tissue culture flasks and propagated under the same conditions as algae-fed cultures.
Fixation and DAPI Staining
Cells were fixed in four batches from 2008 to 2009 from a total of six bacteria-fed populations and four algae-fed populations. Cells were fixed in 1.5-ml microcentrifuge tubes on ice for 30 min in 0.5% Triton X 100 and 3% formaldehyde in PHEM buffer (10 mM EGTA, 2 mM MgCI2, 60 mM Pipes, 25 mM Hepes, pH 6.9). The cells were concentrated by centrifuging for 5 min at 3,000 rpm then washed once with phosphate-buffered saline (PBS) and once with PBS with 1% bovine serum albumin (BSA). Staining was done at 37 °C for 1 h in the dark in hybridization buffer (5 μg/ml 4′,6-diamidino-2-phenylindole [DAPI], 10% dextran sulfate, 0.2% BSA, 0.01% polyadenylic acid in 10xSET) according to a protocol from Joan Bernhard (Woods Hole Oceanographic Institute). Subsequently, cells were washed twice in PBS and affixed to Superfrost (Fisher) microscope slides with 1–2 drops of SlowFade Gold (Invitrogen) to minimize loss of fluorescent signal.
Imaging and Measurement
Organisms were photomicrographed under UV light (excitation filter BP330–385 and barrier filter BA420) and transmitted light with an Olympus BX70 epifluorescent microscope and Olympus DP70 digital camera. We are mindful of the caveats introduced by measuring DNA content by DAPI staining (e.g., Kapuscinski 1995) and made every effort to standardize the staining and photodocumentation protocols. Photographs were taken with a 0.091 second exposure time one day after staining with all procedures standardized to allow comparison between experimental batches. Cross-sectional area of cells and nuclei, which both approximate spheres, were measured from images by outlining the perimeter in the freely available ImageJ64 (http://rsbweb.nih.gov/ij/). Multiple images were taken per cell as necessary so that each nucleus and the cell body were in focus for all measurements. Measurements of the cell were of the cell body not of the outer thecate test (shell) of A. laticollaris CSH. In pilot experiments, both the cell body and the test were measured. The relationship between cell body and nuclei was the same as the relationship between test and nuclei, thus only the cell body was analyzed. In instances where juvenile cells were within the parental test, the cell body of the juvenile was measured and analyzed. Gametic and zygotic nuclei do not have distinct cell bodies, thus they were excluded from further analyses. DNA content was measured as the fluorescence intensity integrated across the area of the nucleus with background fluorescence of the cell subtracted out. DAPI intensity is not correlated with batch (analysis of variance [ANOVA]: algae P = 0.34 and bacteria P = 0.44).
Allogromia laticollaris CSH cells are all roughly spherical, and life cycle stages are indistinguishable with light microscopy. Life cycle stages are differentiated by nuclear number: one in Agamont I and multiple in Agamont II (Lee and McEnery 1970; McEnery and Lee 1976; fig. 1). There were roughly 20 cells that could not be confidently assigned as either Agamont I or II because they either had two nuclei, appeared to be post Zerfall Agamont I cells or cells with later stage zygotic nuclei. These were excluded from further analyses. Microscope slides were also surveyed for cells in rare life cycle stages. Nuclear size and cell size were log-transformed as they did not conform to the assumptions of normality or homogeneity of variance. Statistics were calculated in Jmp7 (SAS corporation), including regressions, ANOVA, analysis of covariance, and summary statistics. Graphs were made in Excel (Microsoft).
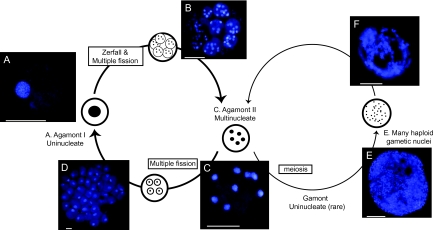
FIG. 1.—
Nuclear dynamics during the life cycle of Allogromia laticollaris CSH. DAPI-stained individuals representing all life cycle stages observed. (A) Agamont I, (B) Juvenile Agamont II within parental test, (C) Agamont II, (D) Many juvenile Agamont I cells within parental test, (E) cell filled with gametic nuclei, and (F) Cell filled with zygotic nuclei. All scale bars 50 μm. Redrawn from McEnery and Lee (1976).
Genome Size Estimate
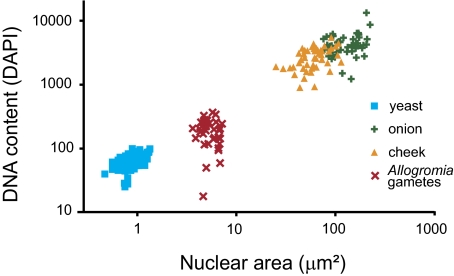
Thirty-three nuclei from four cells that could confidently be identified as gametic were used to calculate haploid genome size. The timing of nuclear fusion and development are staggered and occur earlier on the periphery of the organism. Thus, nuclei in the interior of cells undergoing sexual reproduction that could confidently be identified as gametes were used to generate a measure of haploid nuclei. Three cell types of known genome size, Saccharomyces cerivisiae, the author’s cheek cells, and Allium cepa, were used to calculate genome size (regression of genome size [MB] by mean DNA content: y = 10.44 ×1.69, R2 = 0.99; fig. 2). Data from these standards of known genome size were also used to assess the variability in the intensity of DAPI staining (DNA content) introduced by our DAPI staining method. The coefficient of variation for measured DNA content ranged from 0.19 for S. cerivisiae to 0.35 for cheek cells. This uncertainty was taken into account when calculating genome size. Variance around our estimate of genome size for A. laticollaris CSH was estabished by multiplying the estimated genome size by 0.35.
FIG. 2.—
Genome size in Allogromia laticollaris CSH is estimated to be 83 ± 29 MB. This was calculated from a regression of cell types with known genome size, Saccharomyces ceriviseae, Allium cepa, and human cells, along the A. laticollaris CSH gametes. This figure demonstrates the linear relationship between genome size and intensity of DAPI staining.
Results
Nuclear Dynamics during the Life Cycle
Several thousand A. laticollaris CSH cells were examined by fluorescence microscopy. From this sample, 610 that captured the breadth of life cycle stages were photodocumented and measured (fig. 1). Our results are consistent with the life cycle outlined in McEnery and Lee (1976). The most common life cycle phase is an asexual alternation between uninucleate (Agamont I) and multinucleate adults (Agamont II; fig. 1A and C). Division occurs through multiple fissions such that one parental cell gives rise to multiple daughter cells (fig. 1B and D). A new test forms around each daughter cell and juvenile cells emerge from the empty parental test shortly after division. In addition, gametic nuclei can be produced during a rare sexual phase (fig. 1E and F; McEnery and Lee 1976). Sexual reproduction in A. laticollaris CSH is apogamic and karyogamy occurs within the parental test to form zygotic nuclei. These zygotic nuclei are subsequently partitioned into Agamont II daughter cells.
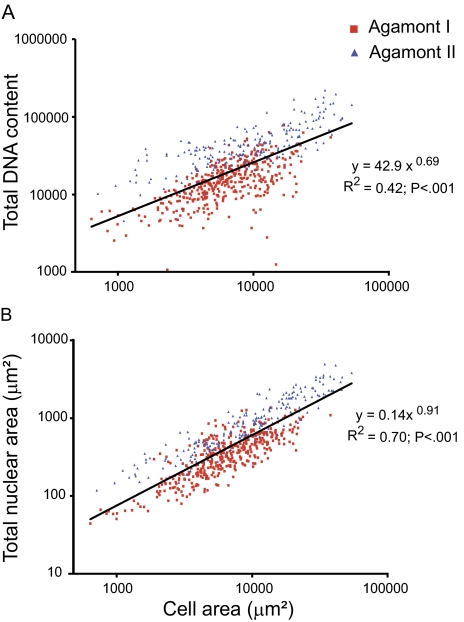
Our data indicate that both Agamont I and II become polyploid during cell growth, in contrast to the original description of both of these life cycle stages as diploid (McEnery and Lee 1976). We infer polyploidy because DNA content, as measured by the intensity of DAPI staining, is positively correlated with cell size for both life cycle stages (fig. 3A). This suggests that DNA content increases continuously with cell growth for all cell types. Nuclear and cell size are positively correlated throughout the life cycle as well (fig. 3B), demonstrating that nuclei grow continually as cells grow. This is an allometric power relationship with an exponent of 0.91 (regression: P < 0.001; fig. 3B), thus the nucleus is growing at a slightly lower rate than the cell. The ratio of nuclear to cell area (N/C ratio) differs according to life cycle stage, such that the multiple nuclei of Agamont II take up a proportionally greater amount of cell space (N/C ratio = 0.031 ± 0.019) than does the single Agamont I nucleus (N/C ratio = 0.014 ± 0.011, ANOVA comparing Agamont I and II: f = 193, P < 0.001; fig. 4A and B).
FIG. 3.—
Significant positive correlation between nuclear size and DNA content with cell size throughout life cycle. N = 610; includes all cells. (A) DNA content, as measured by intensity of DNA staining across the entire nucleus, is tightly correlated with cell area. (B) Nuclear and cell area are related by a power function. There is no difference in this relationship between Agamont I and II (analysis of covariance for difference in slope: P = 0.37).
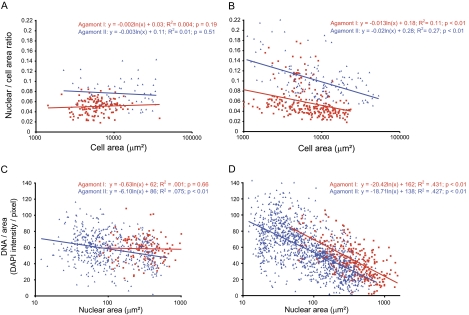
FIG. 4.—
Food source has a significant impact on nuclear dynamics and DNA content in Allogromia laticollaris CSH. (A and B) Scatter plots of N/C ratio versus cell area demonstrate that N/C ratio is negatively correlated with cell size in A. laticollaris CSH-fed bacteria, whereas there is a constant relationship for cells fed algae. (A) Algae-fed cells: N/C ratio remains constant as cell size increases. (B) Bacteria-fed cells: N/C ratio decreases significantly with increasing cell size. (C and D) Scatter plots of DNA content per unit area (as measured by DAPI intensity per pixel) versus nuclear size of individual nuclei reveals that A. laticollaris CSH feeding on algae produce more DNA than cells grown on bacteria. The regression slopes of C are significantly different than D (analysis of covariance [ANCOVA] difference in slope P < 0.001). (C) There is a constant relationship between DNA per area and nuclear size in Agamont I grown on algae (N = 628). (D) DNA per unit area decreases significantly with nuclear size in bacteria-fed cells (N = 1,581). The slopes for Agamont I and II are not statistically different (ANCOVA difference in slope P = 0.36).
Impact of Food Source
Surprisingly, food source has a significant impact on both nuclear size and DNA content in A. laticollaris CSH. In cultures growing with algae, the nuclear to cell area relationship is nearly isometric (power exponent of 1.09 for Agamont I and 0.95 for Agamont II), and the N/C ratio remains constant across the entire range of cell area (fig. 4A). In contrast, the N/C ratio in A. laticollaris CSH-fed bacteria alone is negatively correlated with cell size (P < 0.001; fig. 4B). This negative trend corresponds to slower nuclear growth relative to cell size in bacteria-fed cells (power exponent = 0.75 for Agamont I and 0.82 for Agamont II).
Food source also impacts the amount of nuclear DNA in A. laticollaris CSH. Cultures growing on algae maintain the same amount of DNA per unit area (DNA/area), as measured by intensity of DAPI staining, across the range of nuclear area (e.g., regression Agamont I, P = 0.66; fig. 4C). Conversely, bacteria-fed cultures show a significant decrease in the relationship between DNA/area and nuclear size (fig. 4D). The shift in this relationship is observed for both Agamont I and II cells but is more pronounced among Agamont I cells (fig. 4C and D). These results suggest that DNA is continuously synthesized under all conditions but that the rate of DNA synthesis is much higher when A. laticollaris CSH is fed algae.
Ploidy Levels and Genome Size of A. laticollaris CSH
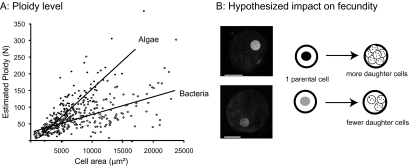
We use gametic nuclei to calculate the haploid genome complement of A. laticollaris CSH and then estimate ploidy levels across the life cycle to reveal that ploidy extends well beyond diploid in both asexual life cycle phases. Assuming that DNA is added only through polyploidization, ploidy levels reach 300 ± 105 N in Agamont I cells and 100 ± 35 N in Agamont II cells (fig. 5A). The impact of food source on DNA content is clear when estimated ploidy levels are compared (fig. 5A). Estimated ploidy levels increase at a faster rate in algae-fed cells, such that total nuclear DNA content is 2-fold higher in the largest size class of Agamont I cells (fig. 5A). Gametic nuclei were also compared with other cells of known genome size, suggesting that the haploid genome size of A. laticollaris CSH is 83 ± 29 MB (fig. 2).
FIG. 5.—
Food source impacts ploidy levels and presumably fecundity of Allogromia laticollaris CSH. (A) Estimates of ploidy are much greater for A. laticollaris CSH growing on algae (N = 197, R2 = 0.63, P < 0.001) than cultures growing bacteria (N = 404, R2 = 0.44, P < 0.001) (analysis of covariance, R2 = 0.55, P < 0.001). Ploidy calculated using gametes as a haploid baseline. (B) Cartoon depicting the hypothesis that differences in DNA content will lead to differences in number of offspring produced. Images are representative cells from algae and bacteria-fed cultures that are DAPI stained, scale bar = 50 μm.
Discussion
Our analysis of genome dynamics in A. laticollaris CSH reveals extensive variation in nuclear size and content both during the life cycle and in response to changing food source. Given these data, we reject the hypotheses that 1) genome content and nuclear size are constant throughout the life cycle (figs. 3 and 4) and 2) that nuclear and genome dynamics are independent of food source (fig. 4). The impact of food source is striking and leads to differences in the relationship between nuclear size, DNA content, and cell growth (fig. 4). This shift is likely to be biologically significant, as it results in a significant reduction in DNA content and N/C ratio in bacteria-fed cells when compared with their algae-fed counterparts for the largest size class where reproduction occurs (figs. 4 and 5).
Our findings on the nuclear dynamics in A. laticollaris CSH call into question the generality of the model of nuclear size regulation developed in fission and budding yeast. In Schizosaccharomyces pombe and Saccharomyces cerevisiae, nuclear size is regulated exclusively by cell size and not by DNA content as demonstrated by measurements during the cell cycle and across numerous mutant lines (Jorgensen et al. 2007; Neumann and Nurse 2007). The ratio of nuclear to cell volume remains constant across all conditions, including in multinucleate mutants (Jorgensen et al. 2007; Neumann and Nurse 2007). The nuclear dynamics of A. laticollaris CSH depart from the yeast model in two ways. First, the cell to nucleus ratio differs according to life cycle stage, with the combined nuclei of the multinucleate Agamont II cells taking up a significantly larger proportion of the cell area (fig. 4A and B). Second, nuclear size can depend in part on DNA content in A. laticollaris CSH as seen in the concomitant decrease of both DNA content and N/C ratio with increasing cell size in bacteria-fed cells (fig. 4B and D).
Our results also enable us to reinterpret the nuclear cycle of A. laticollaris CSH. We show that DNA content increases continuously during cell growth in both life cycle stages (fig. 3), and this increase is expected to be primarily due to polyploidization. The argument for polyploidy is strongest for Agamont I cells. Here, the numerous daughter nuclei generated from a single nucleus without detected DNA synthesis (McEnery and Lee 1976) imply that the Agamont I nucleus already contained many genome copies. A portion of the elevated DNA content in Agamont I nuclei may be due to differential amplification, with amplified loci subsequently eliminated during Zerfall. Zerfall reportedly occurs just at one stage in the life cycle of A. laticollaris CSH (Agamont I: McEnery and Lee 1976) and in other Foraminifera (Gamont: Føyn 1936; Goldstein 1997), implying that differential amplification occurs only in the uninucleate stage. Consistent with this hypothesis, we see a slight, but significant, decrease in DNA/area as nuclei grow in Agamont II nuclei but not in Agamont I. It is also possible that differential amplification of specific loci occurs at multiple points in the life cycle, a hypothesis that will be tested in future studies using methods such as quantitative polymerase chain reaction.
The disparity in the intensity of DAPI staining according to food source is probably due to varying levels of polyploidization, differential amplification, or both. Alternatively, it is possible that the observed shift in DAPI intensity reflects changes in genome architecture rather than DNA amount as DAPI binds preferentially to AT-rich regions of heterochromatin. In our view, it is unlikely that all the variation observed is due to changes in genome architecture given the magnitude of change in DAPI (110-fold range in DNA content across nuclei), and its specific association with changing diet. Furthermore, changing food source in A. laticollaris CSH changes the nature of the relationship between DNA/area and nuclear size rather than simply shifting the curve to a higher intercept (fig. 4C and D). In algae-fed cells, overall DNA content increases isometrically to maintain constant DNA/area (fig. 4C), where as DNA content increases at a lower rate in bacteria-fed cells, resulting in a negative relationship between DNA/area and nuclear size (fig. 4D). This difference can be visualized in the comparison of estimated ploidy levels for Agamont I cells (fig. 5A). Thus, different food sources appear to alter the rate of DNA synthesis over the course of cell growth.
We predict that A. laticollaris CSH cultures growing on algae reach a higher ploidy level, which will in turn lead to higher fecundity compared with bacterial-fed cells. McEnery and Lee (1976) previously demonstrated that bacteria alone are a poor food source for A. laticollaris CSH as cultures fed only bacteria either died or grew more slowly than algae-fed cultures. We were able to grow cultures on bacteria only after the addition of flocculent material in the form of wheat extract. The reduction in DNA synthesis observed here in bacteria-fed cultures suggests that bacteria alone are a poor food source. In large cells, where reproduction occurs (McEnery and Lee 1976), algal-fed Agamont I cells have twice as much DNA as their counterparts fed bacteria (fig. 5A). We hypothesize that this difference results in twice as many offspring produced by multiple fission (fig. 5B) and that the ability to alter ploidy levels in response to food quality may enable A. laticollaris CSH to maximize its fitness across a range of environmental conditions.
Alternatively, the observed difference in nuclear dynamics may signify increased physiological demands associated with preying upon algae as phagocytosis of algae require the construction of complex vacuolar system (Bowser et al. 1985). The differences in the relationship between DNA/area and nuclear size in algae-fed versus bacteria-fed cells may result from changes in the pattern of differential amplification.
Varying DNA content in response to environmental conditions may be a widespread mechanism for maximizing fitness in a changing landscape. Numerous lineages across the eukaryotic tree of life go through ploidy cycles, during which they can reach 1,000 genome copies or higher (Raikov 1982; Parfrey et al. 2008; Parfrey and Katz 2010). These genome copies are then segregated into haploid or diploid daughter cells, gametes and spores, respectively. It is plausible that the degree of polyploidy varies with environmental factors, such that when food is plentiful organisms attain a higher ploidy level and subsequently produce more offspring. This may be analogous to animals and plants allocating more resources toward reproduction in favorable conditions (e.g., Eldridge and Krapu 1988; Vanni and Lampert 1992; Stutzman 1995; Jorgensen et al. 2008; van Huis et al. 2008).
The unexpected influence of food source on nuclear size and DNA content in A. laticollaris CSH may foreshadow additional complexity yet to be uncovered in the nuclear dynamics of diverse eukaryotes. Changes in DNA content in response to the environment are well established in the plant flax (Linum usitatissimum) and distantly related unicellular alga Euglena. Flax loses 15% of its DNA repeatably when grown under stressful conditions and then maintains this lower genomic content during subsequent generations (Cullis 2005). In Euglena gracilis, pH differences in culturing media cause DNA content to vary by 50% (Cook 1981). This variation may be due to changes in ploidy level (Raikov 1982). Furthermore, in several clades of ciliates, starvation causes a reduction in macronuclear DNA amounts (Cullis 1973; Raikov 1982; Adl and Berger 1997). These examples demonstrate that DNA content can change in response to the environment, and the repeatability of these changes suggests that the ability to shift genome content is heritable. The broad distribution of dynamic genome processes suggests that mechanisms enabling genome plasticity arose in the ancestor of eukaryotes (Parfrey et al. 2008; Parfrey and Katz 2010).
Acknowledgments
We gratefully acknowledge the assistance of Richard Briggs and Judith Wopereis in the microscopy facility at Smith College. This manuscript has been improved following the suggestions of two anonymous reviewers. Thanks to Ben Normark, Sam Bowser, Sue Goldstein, and Dan Lahr for comments. This work is supported by National Institutes of Health AREA award (1R15GM081865-01 to L.A.K.), the National Science Foundation (AToL award 043115 to L.A.K.), Sigma Xi (GIAR to L.W.P.), and a Cushman Foundation for Foraminiferal Research grant (to L.W.P).
References
- Adl SM, Berger JD. Timing of life cycle morphogenesis in synchronous samples of Sterkiella histriomuscorum. 1. The vegetative cell cycle. Eur J Protistol. 1997;33:99–109. [Google Scholar]
- Arnold ZM. Life history and cytology of the foraminiferan Allogromia laticollaris. Univ Calif Publ Zool. 1955;61:167–252. [Google Scholar]
- Arnold ZM. The gamontic karyology of the saccamminid foraminifer Psammophaga simplora Arnold. J Foramin Res. 1984;14:171–186. [Google Scholar]
- Bowser SS, McGee-Russell SM, Rieder CL. Digestion of prey in Foraminifera is not anomalous: a correlation of light microscopic, cytochemical, and HVEM techniques to study phagotrophy in two allogromiids. Tissue Cell. 1985;17:823–839. doi: 10.1016/0040-8166(85)90039-4. [DOI] [PubMed] [Google Scholar]
- Bowser SS, Travis JL. Reticulopodia: structural and behavioral basis for the suprageneric placement of the Granuloreticulosan protists. J Foramin Res. 2002;32:440–447. [Google Scholar]
- Cheeseman IH, et al. Gene copy number variation throughout the Plasmodium falciparum genome. BMC Genomics. 2009;10:353. doi: 10.1186/1471-2164-10-353. [DOI] [PMC free article] [PubMed] [Google Scholar]
- Cohen S, Segal D. Extrachromosomal circular DNA in eukaryotes: possible involvement in the plasticity of tandem repeats. Cytogenet Genome Res. 2009;124:327–338. doi: 10.1159/000218136. [DOI] [PubMed] [Google Scholar]
- Cook JR. Variation of DNA levels in Euglena related to pH of culture-medium. J Protozool. 1981;28:148–150. [Google Scholar]
- Cullis CA. DNA amounts in nuclei of Paramecium bursaria. Chromosoma. 1973;40:127–133. doi: 10.1007/BF00321458. [DOI] [PubMed] [Google Scholar]
- Cullis CA. Mechanisms and control of rapid genomic changes in flax. Ann Bot. 2005;95:201–206. doi: 10.1093/aob/mci013. [DOI] [PMC free article] [PubMed] [Google Scholar]
- Eldridge JL, Krapu GL. The influence of diet quality on clutch size and laying pattern in mallards. Auk. 1988;105:102–110. [Google Scholar]
- Føyn B. Über die kernverhaltnisse der foraminifere Myxotheca arenilega Schaudinn. Arch Protistenkd. 1936;87:272–295. [Google Scholar]
- Goldstein ST. Gametogenesis and the antiquity of reproductive pattern in the Foraminiferida. J Foramin Res. 1997;27:319–328. [Google Scholar]
- Goldstein ST. Foraminifera: a biological overview. In: Sen Gupta BK, editor. Modern foraminifera. Dordrecht (The Netherlands): Kluwer; 1999. pp. 37–56. [Google Scholar]
- Jorgensen HB, Hedlund K, Axelsen JA. Life-history traits of soil collembolans in relation to food quality. Appl Soil Ecol. 2008;38:146–151. [Google Scholar]
- Jorgensen P, et al. The size of the nucleus increases as yeast cells grow. Mol Biol Cell. 2007;18:3523–3532. doi: 10.1091/mbc.E06-10-0973. [DOI] [PMC free article] [PubMed] [Google Scholar]
- Kapuscinski J. DAPI: a DNA-specific fluorescent probe. Biotech Histochem. 1995;70:220–233. doi: 10.3109/10520299509108199. [DOI] [PubMed] [Google Scholar]
- Kondrashov AS. Evolutionary genetics of life cycles. Annu Rev Ecol Syst. 1997;28:391–435. [Google Scholar]
- Lee JJ, McEnery ME. Autogamy in Allogromia laticollaris (Foraminifera) J Protozool. 1970;17:184–195. [Google Scholar]
- Lee JJ, McEnery ME, Rubin H. Quantitative studies on growth of Allogromia laticollaris (Foraminifera) J Protozool. 1969;16:377–395. [Google Scholar]
- McEnery ME, Lee JJ. Allogromia laticollaris: a foraminiferan with an unusual apogamic metagenic life cycle. J Protozool. 1976;23:94–108. [Google Scholar]
- Neumann FR, Nurse P. Nuclear size control in fission yeast. J Cell Biol. 2007;179:593–600. doi: 10.1083/jcb.200708054. [DOI] [PMC free article] [PubMed] [Google Scholar]
- Parfrey LW, Katz LA. Dynamic genomes of eukaryotes and the maintenance of genomic integrity. Microbe Magazine. 2010;5:156–163. [Google Scholar]
- Parfrey LW, Lahr DJG, Katz LA. The dynamic nature of eukaryotic genomes. Mol Biol Evol. 2008;25:787–794. doi: 10.1093/molbev/msn032. [DOI] [PMC free article] [PubMed] [Google Scholar]
- Pawlowski J, Burki F. Untangling the phylogeny of amoeboid protists. J Eukaryot Microbiol. 2009;56:16–25. doi: 10.1111/j.1550-7408.2008.00379.x. [DOI] [PubMed] [Google Scholar]
- Raikov IB. The protozoan nucleus: morphology and evolution. Wien (Austria): Springer-Verlag; 1982. pp. 1–474. [Google Scholar]
- Redon R, et al. Global variation in copy number in the human genome. Nature. 2006;444:444–454. doi: 10.1038/nature05329. [DOI] [PMC free article] [PubMed] [Google Scholar]
- Sen Gupta BK. Introduction to modern foraminifera. In: Sen Gupta BK, editor. Modern foraminifera. Dordrecht (The Netherlands): Kluwer; 1999. pp. 1–6. [Google Scholar]
- Stutzman P. Food quality of gelatinous colonial chlorophytes to the fresh-water zooplankters Daphina pulicariaand Diaptomus oregonensis. Freshwater Biol. 1995;34:149–153. [Google Scholar]
- Travis JL, Allen RD. Studies on the motility of the Foraminifera: 1. Ultrastructure of the reticulopodial network of Allogromia laticollaris (Arnold) J Cell Biol. 1981;90:211–221. doi: 10.1083/jcb.90.1.211. [DOI] [PMC free article] [PubMed] [Google Scholar]
- van Huis A, Woldewahid G, Toleubayev K, van der Werf W. Relationships between food quality and fitness in the desert locust, Schistocerca gregaria, and its distribution over habitats on the red sea coastal plain of Sudan. Entomol Exp Appl. 2008;127:144–156. [Google Scholar]
- Vanni MJ, Lampert W. Food quality effects on life-history traits and fitness in the generalist herbivore Daphnia. Oecologia. 1992;92:48–57. doi: 10.1007/BF00317261. [DOI] [PubMed] [Google Scholar]


