Abstract
Germ cell apoptosis directly induced by x-radiation (x-ray) exposure is stage specific, with a higher incidence in stage II/III seminiferous tubules. A priming exposure to the Sertoli cell toxicant 2,5-hexanedione (HD) results in a marked reduction in x-ray–induced germ cell apoptosis in these affected stages. Because of the stage specificity of these responses, examination of associated gene expression in whole testis tissue has clear limitations. Laser capture microdissection (LCM) of specific cell populations in the testis is a valuable technique for investigating the responses of different cell types following toxicant exposure. LCM coupled with quantitative real-time PCR was performed to examine the expression of apoptosis-related genes at both early (3 h) and later (12 h) time points after x-ray exposure, with or without the priming exposure to HD. The mRNAs examined include Fas, FasL, caspase 3, bcl-2, p53, PUMA, and AEN, which were identified either by literature searches or microarray analysis. Group 1 seminiferous tubules (stages I–VI) exhibited the greatest changes in gene expression. Further analysis of this stage group (SG) revealed that Fas induction by x-ray is significantly attenuated by HD co-exposure. Selecting only for germ cells from seminiferous tubules of the most sensitive SG has provided further insight into the mechanisms involved in the co-exposure response. It is hypothesized that following co-exposure, germ cells adapt to the lack of Sertoli cell support by reducing the Fas response to normal FasL signals. These findings provide a better understanding and appreciation of the tissue complexity and technical difficulties associated with examining gene expression in the testis.
Keywords: testis; x-radiation; 2,5-hexanedione; Fas; laser capture microdissection
Apoptosis is an essential process by which the number of germ cells in the testis is controlled during normal spermatogenesis. Exposure to testicular toxicants may result in an increased incidence of germ cell apoptosis, disrupting spermatogenesis. Toxicants such as x-radiation (x-ray) directly induce germ cell apoptosis, whereas toxicants like 2,5-hexanedione (HD) indirectly induce germ cell apoptosis by disrupting the support and/or paracrine signaling provided by Sertoli cells. Given the supportive role of Sertoli cells in germ cell development, it was surprising to find that pretreatment of adult male rats with the Sertoli cell toxicant HD resulted in an attenuation of x-ray–induced germ cell apoptosis when compared with x-ray exposure alone (Yamasaki et al., 2010). Full characterization of this co-exposure response revealed that this attenuated apoptosis is stage specific, occurring in the stages containing the cells most susceptible to x-ray, the rapidly dividing germ cells. A significant reduction in the degree of germ cell apoptosis between x-ray alone and HD + x-ray–exposed rats was observed for stages II/III seminiferous tubules (Yamasaki et al., 2010). This indicates a reduction in apoptosis and not a change in the stage-specific distribution of apoptosis in the testis.
Alterations in apoptotic signaling pathways may be responsible for this response. Toxicant-induced apoptosis of male germ cells can result from various extrinsic or intrinsic signals. The intrinsic pathway involves the action of Bcl-2 family members and p53. X-ray–induced apoptosis in germ cells is largely p53 dependent (Hasegawa et al., 1998). Downstream of p53 is transcriptional activation or repression of multiple genes whose products are involved in apoptosis, including Bcl-2 family members. p53 is able to downregulate the antiapoptotic family member Bcl-2 (Miyashita et al., 1994). Overexpression of Bcl-2 results in resistance to radiation-induced apoptosis (Van Houten et al., 1997). The extrinsic pathway involves the activation of death receptors including the Fas receptor, which is implicated in the x-ray–induced apoptotic response in the testis (Embree-Ku et al., 2002; Lee et al., 1999). Both pathways ultimately trigger the effector caspases, including caspase 3. In addition to information from the literature, clues regarding the genes and/or proteins involved in the HD and x-ray co-exposure response can also be derived from microarray analysis. Gene array analysis performed with testis tissue obtained from rats co-exposed to HD and x-ray revealed several candidate genes involved in the attenuated apoptotic response (Campion et al., 2010). In particular, p53 upregulated modulator of apoptosis (PUMA) and apoptosis-enhancing nuclease (AEN) appear likely to play a role in the x-ray–damaged testis. PUMA is activated by p53 in response to DNA damage and has been shown to act through interactions with antiapoptotic Bcl-2 family members, which in turn activates Bax (Ming et al., 2006). PUMA has also been suggested to trigger apoptosis through direct interactions with Bax or cytoplasmic p53 (Yu and Zhang, 2008). AEN enhances apoptosis following ionizing radiation through its DNase activity (Lee et al., 2005).
The information derived from this gene array analysis study only provides a starting point for hypothesis generation. A major limitation is that it was performed using RNA isolated from whole testis tissue. As observed in our histopathological analysis, the effects of x-ray exposure in the testis are stage and cell type specific (Yamasaki et al., 2010); therefore, a more focused and specific approach to analyzing the responses at the gene level was pursued. Laser capture microdissection (LCM) of individual cells or specific cell populations in the testis is a useful and valuable technique for investigating the responses of different cell types following toxicant exposure. LCM coupled with quantitative real-time PCR (qRT-PCR) allows for the cell- and stage-specific analysis of gene expression levels in the testis, providing a better understanding of the responses in the testis following toxicant exposure.
In the current study, the expression of apoptosis-related genes at both early (3 h) and later (12 h) time points after x-ray exposure, with or without the priming exposure to HD, was further investigated. qRT-PCR was used to examine gene expression in both whole testis tissue and LCM-captured cell populations of specific stage groups (SGs). Differences in gene expression between these two methods of tissue analysis and between different SGs of tissue obtained by LCM that exhibit differential susceptibility to x-ray damage were observed. These findings provide a better understanding and appreciation of the tissue complexity and technical difficulties associated with examining gene expression in the testis. In addition, these findings support a hypothesis of an altered germ cell response as the underlying mechanism of HD-mediated attenuation of x-ray–induced apoptosis.
MATERIALS AND METHODS
Animal care and treatment.
Adult male Fischer 344 rats weighing 200–250 g were purchased from Charles River Laboratories (Wilmington, MA). Upon arrival, rats were acclimated for 1 week prior to use and maintained in a temperature- and humidity-controlled environment, with a 12-h alternating dark-light cycle. All rats were housed in community cages with free access to water and Purina Rodent Chow 5001 (Farmer's Exchange, Framingham, MA). The Brown University Institutional Animal Care and Use Committee approved all experimental animal protocols in compliance with National Institutes of Health guidelines.
Using a previously established treatment protocol (Markelewicz et al., 2004; Yamasaki et al., 2010), HD was administered in drinking water ad libitum for 18 days as a 1% solution. On day 17, animals were exposed to caudal half-body radiation at a single dose of 2 or 5 Gy by a dose rate of 0.31 Gy/min using a RT 250 Philips kVp x-ray machine (Philips, Hamburg, Germany) as described previously (Yamasaki et al., 2010). This resulted in a total of six different treatment groups: control, 1% HD, 2 Gy x-ray, 5 Gy x-ray, HD/2 Gy x-ray, and HD/5 Gy x-ray. At 3 or 12 h after treatment with x-ray, following continued HD exposure, rats were euthanized by CO2 asphyxiation and testes were removed. Half of the right testis was homogenized in Tri Reagent (Sigma-Aldrich, St Louis, MO), snap-frozen in liquid nitrogen, and stored at −80°C. The other half was immersed in optimal cutting temperature compound and snap-frozen by immersion in liquid nitrogen for preparation of frozen sections for LCM. The left testis was fixed in neutral buffered formalin for histological examination. In initial studies, three rats per group were analyzed, and a larger study with seven to nine rats per treatment group was performed at the 12-h time point to increase the sample size used for LCM.
LCM and RNA isolation.
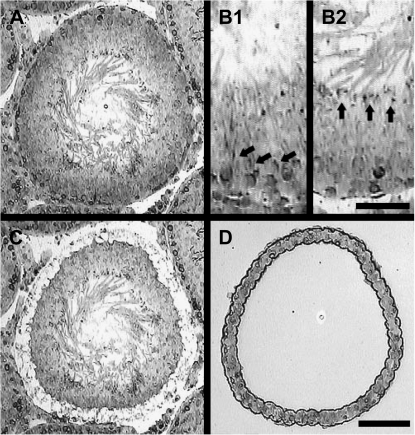
To determine stage specificity of gene expression, the seminiferous tubules were divided into four groups according to the SGs: SG1 (stages I–VI), SG2 (VII–VIII), SG3 (IX–XI), and SG4 (XII–XIV), according to the position and shape of the elongated spermatid nuclei, according to the standards described by Leblond and Clermont (1952), and as previously described (Yamasaki et al., 2010). Seminiferous tubules for microdissection were selected from SG1 (stages I–VI) or SG2 (stages VII–VIII), respectively, because the incidence of apoptosis is different between these SGs (Yamasaki et al., 2010). Stage-specific seminiferous tubules were harvested from frozen sections from animals in each treatment group (n = 3–9). Briefly, 7-μm frozen sections were cut on a standard cryostat with a fresh blade and stored at −80°C for up to 3 days. The frozen sections were thawed at room temperature without drying, then stained using Histogene LCM Frozen Section Staining Kit (Arcturus Bioscience, Inc., Mountain View, CA) according to the manufacturer's protocol. After staining, sections were dried at room temperature and a few cell layers of the basement membrane, which mainly included Sertoli cells, spermatogonia, and/or early stage of spermatocytes, were microdissected from 15 to 20 seminiferous tubules using the PIxCell IIe Laser Microdissection System (Arcturus Bioscience, Inc.) (Fig. 2). Sections were visualized using a 10× objective, and capture was performed using a 15-μm-diameter laser spot size set at 20–40 mW, with a pulse duration of 2–5 ms. Cells were captured using Capsure Macro LCM Caps (Arcturus Bioscience, Inc.). In addition to the samples collected from SGs 1 and 2, samples from frozen sections were acquired by manual dissection using a 22 G needle, with no consideration of stage or cell populations. Total RNA was extracted from LCM-captured tissue and manually dissected tissue using the PicoPure RNA Isolation Kit (Arcturus Bioscience, Inc.) according to the manufacturer's protocols, including DNase treatment, and stored at −80°C. RNA concentrations were determined using the NanoDrop ND-1000 spectrophotometer (NanoDrop Technologies, Wilmington, DE).
FIG. 2.
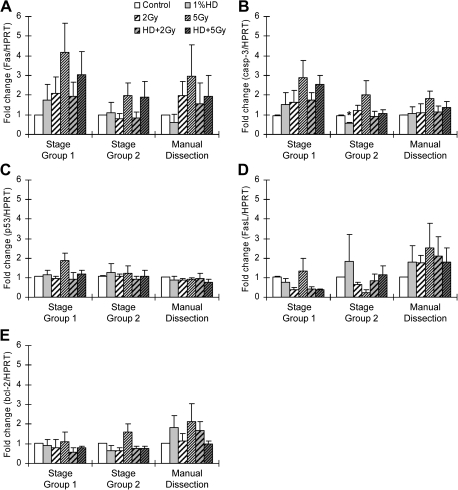
SG-specific expression of apoptosis-related genes. mRNA was isolated from the basal compartment of seminiferous tubule cross-sections of SG1 (stages I–VI) and SG2 (stages VII–VIII) tissue obtained by LCM as well as from tissue obtained by manual dissection (all testis cell types and stages) at 12 h after x-ray exposure. Gene expression of Fas (A), caspase 3 (B), p53 (C), FasL (D), and bcl-2 (E) was assessed by quantitative RT-PCR and expressed as the mean relative expression ± SEM (n = 3). Asterisk indicates significant differences relative to the control group (p < 0.05).
RNA isolation from whole testis tissue.
TRI Reagent (Sigma-Aldrich) was used to extract total RNA from whole testis tissue according to the manufacturer's protocol. RNA concentrations were determined using the NanoDrop ND-1000 spectrophotometer (NanoDrop Technologies).
Quantitative real-time PCR (qRT-PCR) analysis.
Complementary DNA (cDNA) was synthesized from total RNA isolated from each sample using the iScript cDNA Synthesis Kit (Bio-Rad, Hercules, CA) according to the manufacturer's protocol. For Fas, caspase 3, p53, FasL, and bcl-2, the cDNA templates were amplified with each of the primer pairs listed in Table 1 by PCR using iQ SYBR Green Supermix (Bio-Rad) on an iCycler iQ Multicolor Real-time PCR Detection System (Bio-Rad). The concentration of Mg2+ and the linear range of amplification of cDNAs with each primer pair were optimized using cDNA that was reverse transcribed from RNA samples isolated by the same procedure. In initial experiments, a melting curve analysis was performed to monitor PCR product purity, and PCR product identities were verified by agarose gel electrophoresis in initial experiments. Each sample was run in triplicate in 25 μl reactions. Relative messenger RNA (mRNA) levels of each target gene were normalized to the housekeeping gene hypoxanthine guanine phosphoribosyl transferase (HPRT) that was not altered by treatment with HD, x-ray, or both using manual dissected sample (data not shown). Log2-transformed relative expression ratios were calculated as described using the equation set forth by Pfaffl (2001), in which efficiencies for both the gene of interest and the calibrator HPRT were used. For the detection of PUMA and AEN, the cDNA templates were amplified using QuantiTect Primer Assays (Qiagen, Valencia, CA). These primers are pre-optimized and bioinformatically validated. Each sample was run in triplicate in 25 μl reactions. Relative mRNA levels of each target gene were normalized to the housekeeping gene HPRT. Log2-transformed relative expression ratios were calculated using the ddCt method.
TABLE 1.
Sequences of Primers Sets Used for the Analysis of Gene Expression
| Gene | Sense sequence (5′–3′) | Antisense sequence (5′–3′) | Product length (bp) |
| HPRT | TACAGGCCAGACTTTGTTGG | TCCACTTTCGCTGATGACAC | s |
| Fas | CGTGAAACCGACAACAACTG | TTTTCGTTCACCAGGCTGAC | 84 |
| Caspase-3 | CCATGTGTGAACTTGGTTGG | AAATGCTGGTGGATCGTAGC | 86 |
| p53 | AAGGCAACTATGGCTTCCAC | GCTGGCAGAACAGCTTATTG | 99 |
| FasL | TCTGGTTGGAATGGGGTTAG | TAAGGCTGTGGTTGGTGAAC | 89 |
| bcl-2 | TGTGGCCTTCTTTGAGTTCG | ATCCACAGAGCGATGTTGTC | 90 |
Note. Analysis of Gene Expression Was Conducted on a Bio-Rad iCycler iQ Multicolor Real-Time PCR Detection System.
Immunohistochemistry.
A cross-section taken from the middle of formalin-fixed testes was embedded in paraffin for immunochemical detection of PUMA protein. Briefly, heat-induced epitope retrieval was performed by incubating slides in citrate buffer at 95°C for 20 min. Following blocking of endogenous peroxidase activity with 3% H2O2 in methanol, and blocking endogenous biotin with an Avidin/Biotin blocking kit (Vector Laboratories, Burlingame, CA), sections were incubated with 10% goat serum in PBS. Sections were then incubated with rabbit polyclonal anti-PUMA antibody (#4976; Cell Signaling Technology, Danvers, MA) diluted 1:100 overnight at 4°C. A goat anti-rabbit biotinylated secondary antibody was applied for 60 min, followed by incubation with Vector ABC reagent (Vector Laboratories). Protein-antibody complexes were visualized and developed with diaminobenzidine (Vector Laboratories) according to the manufacturer's instructions. Tissues were counterstained with hematoxylin.
Statistical analysis.
Data were analyzed using a one-way ANOVA with Bonferroni's post hoc analysis. The analyses were performed separately for each gene, comparing the expression data among all three treatment groups (control, x-ray, HD + x-ray) for each individual gene. The p values < 0.05 were considered significant.
RESULTS
SG-Specific Expression of Apoptotic Genes
To address the difference in incidence of apoptotic germ cells in seminiferous tubules among SGs, the expression levels of genes known from the literature to be implicated in germ cell apoptosis (Fas, FasL, caspase 3, p53, and bcl-2) were examined by qRT-PCR at 12 h after x-ray exposure. The characterization of SGs and the localization of cell populations collected by LCM are demonstrated in Figure 1. SG1, which showed dose-related sensitivity, and SG2, which did not, were examined using LCM (Fig. 2). Manual dissection of whole testis sections, in which tissues underwent the same processing conditions, except for the laser capture, was used as a control. SG1 was expected to exhibit the greatest upregulation of apoptotic gene expression based on histological evidence.
FIG. 1.
LCM of rat seminiferous tubules. Rat testis were cut on a cryostat at 8 μm thickness and processed for LCM. (A) Micrograph of intact testis section prior to LCM. (B1) Group 1 (stages I–VI): arrows indicate elongated spermatid heads embedded within the seminiferous epitheliums. (B2) Group 2 (stages VII–VIII): arrows indicate elongated spermatid heads adjacent to the tubular lumen. (C) Remaining tissue section after LCM. (D) Isolated tissue on the LCM cap. The scale bar is 100 um in A, C, and D, and the scale bar is 50 um in B1 and B2.
As anticipated, the greatest change in gene expression was observed in SG1 after 5 Gy x-ray treatment as can be observed in the nonsignificant increases in Fas and caspase 3. These trends toward increased expression were reduced with combined exposure to HD and 5 Gy x-ray (Fig. 2). A significant decrease in caspase 3 expression was observed with HD treatment alone in SG2; however, the x-ray effect on gene expression was not as notable for this group or the manual dissection group. Similarly, the alterations in gene expression were less pronounced for Fas in SG2 and with manual dissection. While less pronounced, the same trend toward attenuation of Fas was observed in manual dissection samples. In SG2, which was expected to have a smaller change of apoptosis-related gene expression, there were no strong trends in enhanced apoptotic gene expression. There were no remarkable changes in p53 or FasL expression. No significant or notable changes were observed for bcl-2 expression levels in the specific SGs, but a slight trend toward an increase was seen in manual dissection samples with 5 Gy x-ray treatment (Fig. 2).
In-Depth Analysis of Apoptotic Genes of Interest
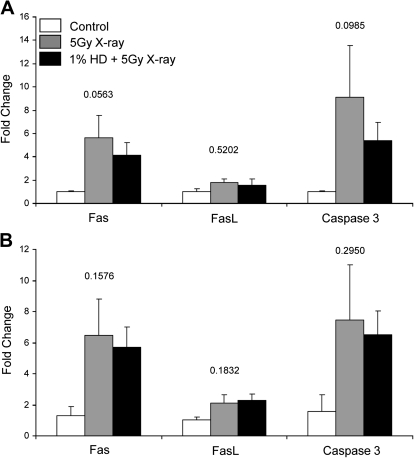
Focusing specifically on the treatment groups that exhibited the greatest changes in gene expression (5 Gy and HD/5 Gy) and on the genes that exhibited the greatest degree of expression alteration (Fas and caspase 3), we extended our analysis to both 3- and 12-h time points after x-ray exposure to examine time points both before and during the appearance of apoptotic germ cells. FasL was also investigated because of its association with Fas. Because of the differences in degree of expression observed between SG-specific and manual dissection samples, and to further explore these differences, a more detailed expression analysis was performed using RNA extracted from both whole testis tissue and stage-specific tissue obtained by LCM. Looking at expression levels at 3 h in whole testis tissue, there was a nonsignificant increase (5.6-fold) in Fas expression with x-ray treatment (Fig. 3A). Caspase 3 exhibited a large trend toward increased expression, changing 9.1-fold with x-ray treatment, and only 5.4-fold after co-exposure (Fig. 3A). The trends in gene expression in whole testis tissue at 12 h after x-ray exposure were very similar to the expression patterns at 3 h. Nonsignificant increases in Fas (6.5-fold), FasL (2.1-fold), and caspase 3 (7.5-fold) were detected at 12 h in whole testis tissue of x-ray–exposed rats, with similar trends in the co-exposed group (Fig. 3B).
FIG. 3.
Fas, FasL, and caspase 3 expression in whole testis tissue. (A) 3 h or (B) 12 h after x-ray exposure, mRNA was isolated from whole testis samples, and Fas, FasL, and caspase 3 expression was measured by qRT-PCR. Gene expression values are expressed as mean relative expression ± SEM (n = 3–4). Values above the results for each gene indicate the p value for the within-gene ANOVAs that were performed.
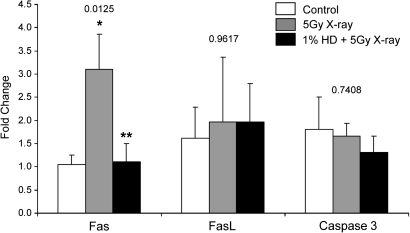
The trends in gene expression, as well as the relative expression levels, were very similar for both 3 and 12 h after x-ray exposure; therefore, a more focused LCM experiment, which can be quite labor intensive and time consuming, was limited to the 12-h time point. The investigation of stage specificity of gene expression in the preliminary exploratory studies (Fig. 2) was performed with only three animals from each group. A more in-depth analysis focusing only on the differences between treatment groups within SG1 seminiferous tubules, which were most affected by x-ray, was expanded to include samples collected from a greater number of animals (n = 7–9). A significant x-ray–induced increase in Fas (3.1-fold) was detected, with co-exposure significantly attenuating Fas expression to control levels (Fig. 4). No significant change in FasL or caspase 3 expression was observed (Fig. 4).
FIG. 4.
SG1-specific expression of Fas, FasL, and caspase 3. mRNA was obtained from the basal compartment of seminiferous tubule cross-sections of SG1 (stages I–VI) by LCM at 12 h after x-ray exposure. Gene expression was measured by qRT-PCR, and expression values are expressed as mean fold change normalized to control values ± SEM (n = 7–9). Values above the results for each gene indicate the p value for the within-gene ANOVAs that were performed. Single asterisk indicates significant differences relative to control (p < 0.05), and double asterisks indicate significant differences relative to x-ray alone (p < 0.05), as determined by post hoc analysis.
RT-PCR of Candidate Genes Identified by Microarray Analysis
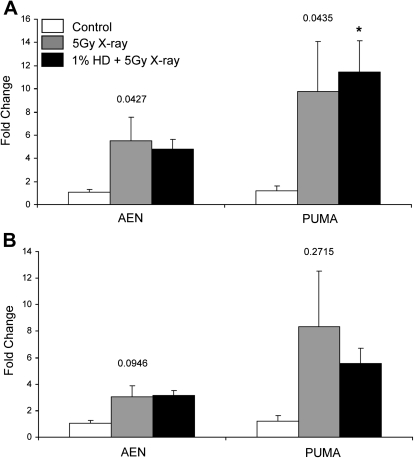
All the apoptotic genes analyzed thus far were studied because of evidence from previous studies implicating their role in testicular germ cell apoptosis. Gene array analysis is another valuable approach for identifying potential gene candidates involved in toxicological responses. In a companion study, microarray analysis was performed using RNA isolated from whole testis obtained at 3 h after x-ray exposure from rats subjected to the HD and x-ray co-exposure paradigm (Campion et al., 2010). Using a novel approach to examine co-exposure effects on gene expression, the results of this study revealed significant alterations in genes involved in cell cycle and cell death pathways. Two apoptosis-related genes, AEN and PUMA, were identified as candidates for further analysis because their significant induction by x-ray (2.1- and 1.7-fold, respectively) was reduced to control levels by HD co-exposure. Examining AEN and PUMA expression by qRT-PCR in whole testis tissue at 3 h, it was determined that there were significant differences between the three treatment groups for each gene, as indicated by the overall ANOVA p values (p = 0.0427 for AEN and p = 0.0435 for PUMA); however, statistical significance after Bonferroni's post hoc analysis was only reached for one value. A trend toward an x-ray–induced increase in AEN (5.5-fold) and PUMA (9.7-fold) was detected (Fig. 5A). A nonsignificant increase of 4.8-fold for AEN was observed after co-exposure, with a significant increase to 11.5-fold detected for PUMA with HD and x-ray co-exposure (Fig. 5A). At 12 h, whole testis tissue exhibits a similar trend for AEN (Fig. 5B). A trend toward HD-mediated attenuation of PUMA at 12 h in whole testis is revealed, with co-exposure reducing the x-ray–induced increase of 8.3- to 5.6-fold (Fig. 5B).
FIG. 5.
AEN and PUMA expression in whole testis tissue. (A) 3 h or (B) 12 h after x-ray exposure, mRNA was isolated from whole testis samples, and AEN and PUMA expression was measured by qRT-PCR. Gene expression values are expressed as mean relative expression ± SEM (n = 3–4). Values above the results for each gene indicate the p value for the within-gene ANOVAs that were performed. Asterisk indicates significant differences relative to the control group (p < 0.05), as determined by post hoc analysis.
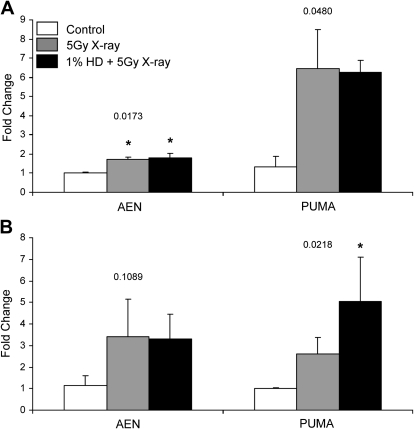
Using the LCM technique to examine the expression of these genes in the basal compartment of SG1 seminiferous tubules, containing the germ cells most susceptible to x-ray, we observed similar trends in AEN and PUMA expression for 3 h LCM-captured tissue as compared with 3 h whole testis tissue. AEN was significantly increased in both the x-ray (1.7-fold) and co-exposure (1.8-fold) groups (Fig. 6A). The same trend was observed for PUMA with increases for both x-ray (6.5-fold) and co-exposure (6.3-fold), with a significant overall p value indicating a difference between the mean PUMA expression for the three different treatment groups. A comparison of whole testis and LCM-captured group 1 tissue at the 12-h time point revealed large differences in PUMA expression. Whereas x-ray–induced PUMA expression appeared to be attenuated by HD co-exposure in whole testis at 12 h, HD co-exposure enhanced the x-ray–induced increase (2.6-fold) to 5-fold, which is significantly different from control (Fig. 6B). There was a nonsignificant increase in AEN in 12 h LCM-captured tissue to 3.4- and 3.3-fold for x-ray and co-exposure, respectively, which mirrors the 12 h whole testis expression levels.
FIG. 6.
SG1-specific expression of AEN and PUMA. mRNA was obtained from the basal compartment of seminiferous tubule cross-sections of SG1 (stages I–VI) by LCM at 3 h (A) and 12 h (B) after x-ray exposure. Gene expression was measured by qRT-PCR, and expression values are expressed as mean fold change normalized to control values ± SEM (n = 3). Values above the results for each gene indicate the p value for the within-gene ANOVAs that were performed. Asterisks indicate significant differences relative to the control group (p < 0.05), as determined by post hoc analysis.
Localization of PUMA Protein
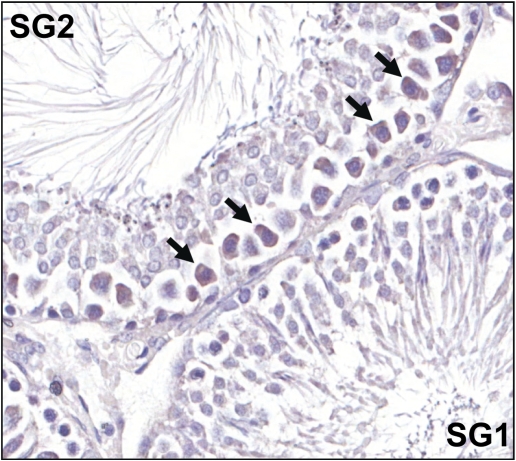
To further explore this discrepancy in the effect of HD pretreatment on x-ray–induced PUMA expression between whole testis tissue and LCM-captured SG1 tissue at 12 h, tissue localization of PUMA was investigated. Immunostaining revealed that PUMA protein is localized to spermatocytes primarily in SG2 seminiferous tubules, the stages just before spermiation (Fig. 7). Figure 7 demonstrates a representative SG2 tubule with positive PUMA staining, adjacent to a SG1 tubule with no PUMA-positive cells. No differences in PUMA levels or localization between control, x-ray alone, and co-exposure treatment groups were readily apparent.
FIG. 7.
Localization of PUMA protein. Twelve hours after x-ray exposure, testis tissue was formalin fixed and paraffin embedded. Tissue sections were prepared and immunostained to detect PUMA protein. PUMA-positive cells are indicated by arrows. SG1 indicates a stage group 1 tubule (stages I–VI) and SG2 indicates a stage group 2 tubule (stages VII–VIII).
DISCUSSION
The complexity of the testis, including different interacting cell types as well as different stages of the cycle of the seminiferous epithelium, often proves to be a major hurdle when trying to understand toxicant responses and underlying mechanisms. In the current study, several different approaches are combined to dissect the structural complexity of the testis to examine gene expression patterns associated with germ cell apoptosis. Germ cell apoptosis induced by x-ray exposure is stage specific, with a higher incidence in stage II/III seminiferous tubules (Yamasaki et al., 2010). A priming exposure to 2,5-hexanedione results in a marked reduction in x-ray–induced germ cell apoptosis in these affected stages (Yamasaki et al., 2010). Because of the difficulty of physically separating seminiferous tubules by stage, the study of associated gene expression changes is often performed using RNA isolated from whole testis. However, examination of associated gene and/or protein expression in whole testis tissue is limited in its ability to distinguish responses at specific stages, revealing a muted picture of what is actually occurring. LCM is a novel technique for evaluating stage-specific gene expression in the testis, allowing for the assessment of gene expression from individual cells or cell groups when coupled with qRT-PCR (Espina et al., 2006; Sluka et al., 2002; Suarez-Quian et al., 2000). In the present study, qRT-PCR of candidate genes hypothesized to be involved in the attenuated apoptotic response was conducted using RNA isolated from tissue captured from the basal compartment of SG1 and SG2 seminiferous tubules and whole testis tissue. The results reveal a role for Fas in HD-mediated attenuation of x-ray–induced germ cell apoptosis.
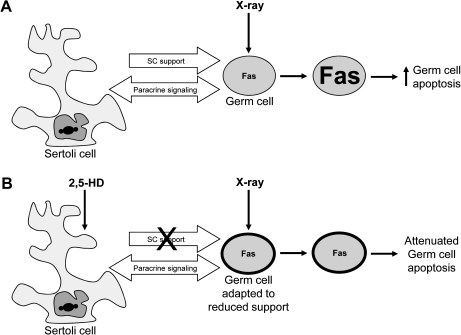
Fas, FasL, caspase 3, bcl-2, and p53 were investigated as candidate genes because previous studies have implicated them in the germ cell apoptotic response (Embree-Ku et al., 2002; Hasegawa et al., 1997; Van Houten et al., 1997). Preliminary analyses revealed that the greatest changes in apoptotic gene expression occurred in seminiferous tubules of SG1, consistent with histological findings. These studies also confirmed the increased sensitivity of measuring stage-specific gene expression over whole testis (manual dissection). The results of Bcl-2 mRNA expression underscore the success of the LCM approach—Bcl-2, an intracellular antiapoptotic protein, is induced in late spermatocytes and spermatids following x-ray exposure (Beumer et al., 2000; Van Houten et al., 1997). The data showed that Bcl-2 mRNA expression from SGs 1 and 2, which did not include that of late spermatocytes or spermatids, was not changed in any group, whereas expression of manually dissected samples, which included all testicular epithelium, was slightly increased. These results suggest that the apoptosis-related genes were successfully quantified by the LCM approach. Follow-up studies focusing only on gene expression across the different treatment groups within SG1 seminiferous tubules collected by LCM revealed significant differences in Fas expression but no change in FasL or caspase 3. Fas expression was significantly increased with x-ray exposure and significantly attenuated with HD/5 Gy co-exposure. Extrinsic Fas/FasL-mediated signaling between Sertoli cells and germ cells plays a key role in mediating germ cell apoptosis (Richburg, 2000). However, x-ray–induced apoptosis involves the upregulation of Fas, but not FasL, as seen here and in previous studies (Embree-Ku et al., 2002). This may be because of direct activation of Fas, which has been demonstrated with ultraviolet radiation, or because of activation of Fas by tumor necrosis factor α in the absence of FasL (Aragane et al., 1998; Suzuki et al., 1999). Additional studies investigating these possible mechanisms of HD-mediated attenuated germ cell apoptosis during co-exposure are warranted. We originally hypothesized that the reduced apoptosis caused by HD pretreatment was a result of either decreased apoptotic signals (e.g., FasL) from the damaged Sertoli cells or decreased response of the germ cells because of an adaptation to the reduced Sertoli cell support. The results of the current study suggest that following co-exposure, the germ cells adapt to the lack of Sertoli cell support by reducing the Fas response to normal FasL signals (Fig. 8).
FIG. 8.
Proposed mechanism of HD-mediated attenuation of germ cell apoptosis. (A) Testis after x-ray exposure; (B) testis after combined HD and x-ray exposure. Sertoli cells normally support and nurture the developing germ cells. After a direct toxic insult to germ cells by x-ray exposure, the affected germ cells increase expression of Fas and subsequently undergo apoptosis (A). Disruption of Sertoli cell support by HD pretreatment results in an adaptive response of the germ cells, indicated by the thicker black outline around the germ cell, so that upon x-ray exposure they fail to upregulate Fas and are less sensitive to x-ray effects (B).
These findings also demonstrate the utility of performing cell population and stage-specific analysis of gene expression in the testis. Although only a trend toward Fas induction with x-ray treatment, and slight attenuation with HD co-exposure, was observed in whole testis, more pronounced and statistically significant changes were observed for SG1 tissue. Selecting only for the targeted germ cells eliminated the noise produced by including somatic and unaffected germ cells. LCM extraction revealed an enhancement of the traces of signal that were buried in the noise of the whole testis samples. The only drawbacks to this technique are the technical difficulties—the required expertise to identify stages, the time and expense, and the low mRNA yields.
As another approach to identify potential mechanisms underlying the co-exposure response, microarray analysis performed in a separate study identified AEN and PUMA as genes whose protein products are potentially involved in the attenuated apoptotic response (Campion et al., 2010). Microarray analysis proved to be challenging because of the large amounts of data generated and the lack of well-established methods for analyzing the gene-level effects of more than one chemical. Prior work by our laboratory has established an effective method for studying gene alterations in response to chemical mixtures (Campion et al., 2010). Regardless of these advances, microarray data still have limitations; the expense often limits the number of samples analyzed, which may result in noisy variable data, and the dynamic range is relatively narrow, resulting in reduced sensitivity. Our microarray analysis revealed that Fas was significantly altered by x-ray exposure; however, the fold change detected by microarray was negligible, and it would not have been pursued had it not been for previous research implicating Fas in germ cell apoptosis. Fas is not a very abundant transcript in the testis, and it is likely that any changes in expression may have been lost in the limited dynamic range of the technology, as well as in the use of RNA extracted from whole testis.
The first step taken to pursue genes identified by the microarray analysis was to perform qRT-PCR with RNA isolated from whole testis. This analysis confirmed the x-ray–induced increases in both AEN and PUMA but did not confirm the HD-mediated attenuation of gene induction. Only a trend toward attenuated PUMA induction was observed at the 12-h time point. The greater fold change values detected by qRT-PCR as compared with the values detected by gene array demonstrate the increased sensitivity of qRT-PCR over array technology. These genes and their products are likely involved in x-ray–induced germ cell apoptosis but do not appear to be involved in the attenuated apoptosis effect seen with HD pretreatment.
To enhance the sensitivity of detection for AEN and PUMA, LCM was used to select out the sensitive populations. Although the AEN data obtained from analyzing whole testis versus LCM-collected tissue was very similar, we observed a discrepancy between the whole testis and LCM gene expression levels of PUMA. Localization of PUMA following x-ray exposure clarifies the reason for the discrepancy between whole testis and LCM. PUMA protein was found to be localized primarily to SG2 seminiferous tubules and not in the SG1 tissue collected by LCM. The trend toward attenuated PUMA in whole testis corresponded with the results of the microarray, which was also performed with whole testis. In contrast, SG1 tissue exhibited enhanced PUMA gene expression with co-exposure, which is likely different from the whole testis findings because of the localization of PUMA mainly to SG2. Large differences in PUMA staining between control, x-ray alone, and co-exposure treatment groups were not readily apparent, which may be because of the timing of analysis. The detected alterations at the gene level at 12 h may not manifest at the protein level until later time points. Additional studies are warranted to investigate the time-dependent changes and localization of PUMA protein following co-exposure. In light of these findings, microarray analysis might be best utilized in conjunction with LCM-captured, stage or cell-type specific tissue to better guide hypothesis generation in future studies.
Through our detailed analysis of apoptosis-related gene expression in the testis, Fas has emerged as a major factor in the attenuation of x-ray–induced apoptosis by HD co-exposure. These studies have also explored the differences and utility of using whole testis versus LCM-captured specific cell and stage populations, as well as comparing qRT-PCR to microarray results. These findings underscore the challenges of measuring gene expression in the testis and the importance of considering differences in specific cell populations and stages. Examination of gene expression in whole testis, which is technically easier and much faster, may be a good starting point for exploratory studies; however, the diluting effects of other cell types and stages in the testis that are unaffected by toxicant treatment could mask significant changes that may be physiologically relevant. These studies have shown that important considerations must be made to balance the technical difficulties with the sensitivity of the approach when investigating gene expression in the testis.
FUNDING
National Institute of Environmental Health Sciences at the National Institutes of Health (P42 ES013660 and T32 ES07272).
References
- Aragane Y, Kulms D, Metze D, Wilkes G, Poppelmann B, Luger TA, Schwarz T. Ultraviolet light induces apoptosis via direct activation of CD95 (Fas/APO-1) independently of its ligand CD95L. J. Cell Biol. 1998;140:171–182. doi: 10.1083/jcb.140.1.171. [DOI] [PMC free article] [PubMed] [Google Scholar]
- Beumer TL, Roepers-Gajadien HL, Gademan IS, Lock TM, Kal HB, De Rooij DG. Apoptosis regulation in the testis: involvement of Bcl-2 family members. Mol. Reprod. Dev. 2000;56:353–359. doi: 10.1002/1098-2795(200007)56:3<353::AID-MRD4>3.0.CO;2-3. [DOI] [PubMed] [Google Scholar]
- Campion SN, Houseman EA, Sandrof MA, Hensley J, Sui Y, Gaido KW, Wu Z, Boekelheide K. Suppression of radiation-induced testicular germ cell apoptosis by 2,5-hexanedione pretreatment. II. Gene array analysis reveals adaptive changes in cell cycle and cell death pathways. Toxicol. Sci. 2010 doi: 10.1093/toxsci/kfq204. Advance Access published on July 8, 2010; doi: 10.1093/toxsci/kfq204. [DOI] [PMC free article] [PubMed] [Google Scholar]
- Embree-Ku M, Venturini D, Boekelheide K. Fas is involved in the p53-dependent apoptotic response to ionizing radiation in mouse testis. Biol. Reprod. 2002;66:1456–1461. doi: 10.1095/biolreprod66.5.1456. [DOI] [PubMed] [Google Scholar]
- Espina V, Wulfkuhle JD, Calvert VS, VanMeter A, Zhou W, Coukos G, Geho DH, Petricoin EF, III, Liotta LA. Laser-capture microdissection. Nat. Protoc. 2006;1:586–603. doi: 10.1038/nprot.2006.85. [DOI] [PubMed] [Google Scholar]
- Hasegawa M, Wilson G, Russell LD, Meistrich ML. Radiation-induced cell death in the mouse testis: relationship to apoptosis. Radiat. Res. 1997;147:457–467. [PubMed] [Google Scholar]
- Hasegawa M, Zhang Y, Niibe H, Terry NH, Meistrich ML. Resistance of differentiating spermatogonia to radiation-induced apoptosis and loss in p53-deficient mice. Radiat. Res. 1998;149:263–270. [PubMed] [Google Scholar]
- Leblond CP, Clermont Y. Definition of the stages of the cycle of the seminiferous epithelium in the rat. Ann. N. Y. Acad. Sci. 1952;55:548–573. doi: 10.1111/j.1749-6632.1952.tb26576.x. [DOI] [PubMed] [Google Scholar]
- Lee J, Richburg JH, Shipp EB, Meistrich ML, Boekelheide K. The Fas system, a regulator of testicular germ cell apoptosis, is differentially up-regulated in Sertoli cell versus germ cell injury of the testis. Endocrinology. 1999;140:852–858. doi: 10.1210/endo.140.2.6479. [DOI] [PubMed] [Google Scholar]
- Lee JH, Koh YA, Cho CK, Lee SJ, Lee YS, Bae S. Identification of a novel ionizing radiation-induced nuclease, AEN, and its functional characterization in apoptosis. Biochem. Biophys. Res. Commun. 2005;337:39–47. doi: 10.1016/j.bbrc.2005.08.264. [DOI] [PubMed] [Google Scholar]
- Markelewicz RJ, Jr, Hall SJ, Boekelheide K. 2,5-hexanedione and carbendazim coexposure synergistically disrupts rat spermatogenesis despite opposing molecular effects on microtubules. Toxicol. Sci. 2004;80:92–100. doi: 10.1093/toxsci/kfh140. [DOI] [PubMed] [Google Scholar]
- Ming L, Wang P, Bank A, Yu J, Zhang L. PUMA dissociates Bax and Bcl-X(L) to induce apoptosis in colon cancer cells. J. Biol. Chem. 2006;281:16034–16042. doi: 10.1074/jbc.M513587200. [DOI] [PubMed] [Google Scholar]
- Miyashita T, Krajewski S, Krajewska M, Wang HG, Lin HK, Liebermann DA, Hoffman B, Reed JC. Tumor suppressor p53 is a regulator of bcl-2 and bax gene expression in vitro and in vivo. Oncogene. 1994;9:1799–1805. [PubMed] [Google Scholar]
- Pfaffl MW. A new mathematical model for relative quantification in real-time RT-PCR. Nucleic Acids Res. 2001;29:e45. doi: 10.1093/nar/29.9.e45. [DOI] [PMC free article] [PubMed] [Google Scholar]
- Richburg JH. The relevance of spontaneous- and chemically-induced alterations in testicular germ cell apoptosis to toxicology. Toxicol. Lett. 2000;112–113:79–86. doi: 10.1016/s0378-4274(99)00253-2. [DOI] [PubMed] [Google Scholar]
- Sluka P, O'Donnell L, Stanton PG. Stage-specific expression of genes associated with rat spermatogenesis: characterization by laser-capture microdissection and real-time polymerase chain reaction. Biol. Reprod. 2002;67:820–828. doi: 10.1095/biolreprod.102.004879. [DOI] [PubMed] [Google Scholar]
- Suarez-Quian CA, Goldstein SR, Bonner RF. Laser capture microdissection: a new tool for the study of spermatogenesis. J Androl. 2000;21:601–608. [PubMed] [Google Scholar]
- Suzuki A, Tsutomi Y, Shimizu M, Matsuzawa A. Another cell death induction system: TNF-alpha acts as a ligand for Fas in vaginal cells. Cell Death Differ. 1999;6:638–643. doi: 10.1038/sj.cdd.4400532. [DOI] [PubMed] [Google Scholar]
- Van Houten N, Blake SF, Li EJ, Hallam TA, Chilton DG, Gourley WK, Boise LH, Thompson CB, Thompson EB. Elevated expression of Bcl-2 and Bcl-x by intestinal intraepithelial lymphocytes: resistance to apoptosis by glucocorticoids and irradiation. Int Immunol. 1997;9:945–953. doi: 10.1093/intimm/9.7.945. [DOI] [PubMed] [Google Scholar]
- Yamasaki H, Sandrof MA, Boekelheide K. Suppression of radiation-induced testicular germ cell apoptosis by 2,5-hexanedione pretreatment. I. Histopathological analysis reveals stage-dependence of attenuated apoptosis. Toxicol. Sci. 2010 doi: 10.1093/toxsci/kfq203. Advance Access published on July 8, 2010; doi: 10.1093/toxsci/kfq203. [DOI] [PMC free article] [PubMed] [Google Scholar]
- Yu J, Zhang L. PUMA, a potent killer with or without p53. Oncogene. 2008;27(Suppl. 1):S71–S83. doi: 10.1038/onc.2009.45. [DOI] [PMC free article] [PubMed] [Google Scholar]


