Abstract
Oxidative stress and mitochondrial dysfunction play an important role in acetaminophen (APAP)-induced hepatocyte cell death. However, exact mechanisms involved in the process are controversial, in part, because of the disparity in findings between in vitro and in vivo studies. A major difference in this context is the oxygen tension, with cells in culture being exposed to 21% oxygen, whereas those in the liver experience a gradient from 3 to 9% oxygen. To determine if oxygen tensions could modulate hepatocyte responses to APAP, primary mouse hepatocytes were treated with 5mM APAP for up to 15 h under various oxygen tensions and mitochondrial dysfunction (2,3-bis[2-methoxy-4-nitro-5-sulfophenyl]-2H-tetrazolium-5-carboxyanilide inner salt assay, 5,5′,6,6′-tetrachloro-1,1,3,3-tetraethylbenzimidazolylcarbocyanine iodide [JC-1] fluorescence ratio) and cell death (lactate dehydrogenase release) was evaluated. Mitochondrial reactive oxygen and reactive nitrogen species were measured using Mitosox Red or dihydrorhodamine fluorescence and nitrotyrosine staining, respectively. Exposure of hepatocytes to 5mM APAP at 21% O2 resulted in mitochondrial oxidant stress formation, deterioration of mitochondrial function, and loss of membrane potential as early as 6 h and massive cell death at 15 h. Culture of cells at 10% O2 resulted in no increase in mitochondrial oxidant stress and better preserved mitochondrial function at 6 h and significant protection against cell death at 15 h. Furthermore, dihydrorhodamine fluorescence was significantly attenuated at 10% oxygen. Cells cultured at 5% oxygen were also protected but showed evidence of hypoxia (accumulation of lactate and nuclear translocation of hypoxia-inducing factor-1α). These results suggest that oxygen tension can modulate hepatocyte responses to APAP, with low physiological levels (10%) decreasing mitochondrial oxidant stress and delaying hepatocyte cell death.
Keywords: acetaminophen, hepatotoxicity, oxidant stress, oxygen tension, cultured hepatocytes
Acetaminophen (APAP), a safe drug at therapeutic doses, causes severe hepatotoxicity and liver failure after overdosing. Currently, APAP-induced liver failure is the most frequent cause of acute liver failure in the Untied States (Larson et al., 2005). The mechanism of toxicity includes the metabolic activation of APAP by cytochrome P450 enzymes, depletion of hepatic glutathione (GSH) levels by the reactive metabolite N-acetyl-p-benzoquinone imine (NAPQI), and subsequently the covalent binding of NAPQI to cellular proteins (Nelson 1990). Although NAPQI can bind to many cellular proteins, mitochondrial proteins appear to be most critical for the toxicity (Qiu et al., 2001; Tirmenstein and Nelson, 1989). This effect leads to inhibition of the mitochondrial respiration (Meyers et al., 1988), depletion of ATP levels (Jaeschke, 1990; Tirmenstein and Nelson, 1990), and formation of reactive oxygen species (ROS) and peroxynitrite inside mitochondria (Cover et al., 2005; Jaeschke, 1990). This mitochondrial oxidant stress precedes cell death (Bajt et al., 2004) and is critically involved in the injury process (Knight et al., 2002). A consequence of the persistent oxidant stress in mitochondria is the opening of the mitochondrial membrane permeability transition (MPT) pore, which causes the collapse of the mitochondrial membrane potential and mitochondrial uncoupling (Kon et al., 2004). The MPT pore opening is known to cause matrix expansion and mitochondrial swelling resulting in rupture of the outer mitochondrial membrane (Feldmann et al., 2000), which can trigger release of endonucleases of the intermembrane space, their translocation to the nucleus, and nuclear DNA degradation (Bajt et al., 2006, 2008). Together these effects lead to oncotic necrotic cell death of hepatocytes (Gujral et al., 2002). In general, it is assumed that the basic mechanisms of cell death after APAP exposure in vivo are very similar to the mechanisms observed in primary cultured hepatocytes (Jaeschke and Bajt, 2006).
Despite the many similarities between in vivo and in vitro mechanisms, there are several important differences. For example, lipid peroxidation appears to be a critical event for toxicity in cell culture (Albano et al., 1983; Nagai et al., 2002) but not in vivo (Knight et al., 2003). In addition, the chain-breaking antioxidant vitamin E is protective in cell culture (Albano et al., 1983; Nagai et al., 2002) but not in vivo (Knight et al., 2003). Based on these findings, we hypothesized that the toxicity in primary cultured mouse hepatocytes is more critically dependent on reactive oxygen, Fenton chemistry, and potentially lipid peroxidation than in hepatocytes in the intact liver, where peroxynitrite is more important (Knight et al., 2002). A potential reason for the higher oxidant stress in vitro could be caused by the cell culture conditions (Halliwell, 2003). The vast majority of investigators culture hepatocytes in room air, that is, in the presence of 21% oxygen. In contrast, the oxygen levels in the liver range from 8 to 9% in the periportal areas to 3 to 5% in the centrilobular areas (Kietzmann and Jungermann, 1997). A recent study reported that the viability of sinusoidal endothelial cells is substantially enhanced when cultured under 5% oxygen compared with 21% (Martinez et al., 2008). Therefore, we investigated if there is a difference in the mechanism of APAP toxicity when primary hepatocytes were cultured under hyperoxic conditions (21% oxygen) versus more physiological oxygen concentrations (10 and 5% oxygen).
MATERIALS AND METHODS
Animals.
Male C57BL/6 mice with an average weight of 18–20 g were purchased from Jackson Laboratory (Bar Harbor, ME). All animals were housed in an environmentally controlled room with 12 h light/dark cycle and allowed free access to food (certified rodent diet no. 8640, Harlan Teklad, Indianapolis, IN) and water. The experimental protocols were approved by the Institutional Animal Care and Use Committee of University of Kansas Medical Center and followed the criteria of the National Research Council for the care and use of laboratory animals in research. All chemicals were purchased from Sigma Chemical Co. (St Louis, MO) unless stated otherwise.
Mouse hepatocyte isolation.
Primary hepatocytes were isolated from overnight fasted mice with a standard collagenase procedure as previously described in detail (Bajt et al., 2004). From the isolation of one mouse liver, a typical yield was about 50–60 × 106 hepatocytes. Cell viability, as determined by trypan blue exclusion, was generally > 90%, and cell purity was > 95% hepatocytes. Cells were plated in six-well plates (6 × 10⁵ cells per well) (Biocoat collagen I cellware plates; Becton Dickinson) in Williams’ Medium E (Gibco, Grand Island, NY) containing 10% fetal bovine serum (Gibco), 100 U/ml penicillin/streptomycin, and 1 × 10⁻⁷M insulin and cultured at 37°C in 21, 10, 5, or 1% oxygen with 5% CO2 (Napco 8000 Water-Jacketed CO2 Incubator, Thermo Fisher Scientific, Waltham, MA). All percentages of oxygen concentrations refer to vol/vol. After an initial 3-h attachment period, cultures were washed with PBS and then plain culture medium (controls) or media containing 5mM APAP were added for either 6 or 15 h. For experiments with lipid-soluble antioxidants, cells were pretreated for 1 h with α-tocopheryl succinate (50μM) and butylated hydroxytoluene (BHT, 20μM) before exposure to APAP (Nagai et al., 2002).
Cell viability by lactate dehydrogenase release.
For lactate dehydrogenase (LDH) release measurements, medium was removed from cells and lysis buffer containing 25mM 4-(2-hydroxyethyl)-1-piperazineethanesulfonic acid (HEPES); 5mM EDTA; 0.1% 3-[(3-cholamidopropyl)dimethylammonio]-1-propanesulfonate; and 1 mg/ml each of pepstatin, leupeptin, and aprotinin; pH 7.5; was added to the hepatocytes for 5 min. Cells were removed from wells with a cell scraper and placed into a test tube. After sonication, cells were centrifuged for 20 min at 15,000 revolutions per minute at 4°C. Aliquots of the cell lysate or medium are added to a reaction mixture in potassium phosphate buffer (60mM, pH 7.5) containing 0.72mM pyruvate and 216mM NADH. The kinetics of absorbance decrease at 340 nm was measured with a spectrophotometer (UV-1601PC, Shimadzu Scientific Instruments, Columbia, MD).
GSH and lactate concentrations.
For cell GSH measurements, media were removed and 0.5 ml of 3% sulfosalicylic acid was added to the cells. Each well was scraped with a cell scraper and the precipitated proteins centrifuged for 5 min. The acidic supernatant was diluted either in 100mM potassium phosphate buffer, pH 7.4, for measurement of total GSH (GSH + glutathione disulfide [GSSG]) or in 10mM N-ethyl maleimide in phosphate buffer for measurement of GSSG and assayed with a modified Tietze assay as described (Jaeschke and Mitchell, 1990). A 10% SDS solution was added to the pellet to solubilize the proteins. Protein concentrations were assayed using the bicinchoninic acid kit (Pierce, Rockford, IL). Lactate levels in the cell culture supernatant were determined according to standard enzymatic tests (Bergmeyer, 1974).
2,3-Bis[2-methoxy-4-nitro-5-sulfophenyl]-2H-tetrazolium-5-carboxyanilide inner salt assay.
The 2,3-bis[2-methoxy-4-nitro-5-sulfophenyl]-2H-tetrazolium-5-carboxyanilide inner salt (XTT) system was used according to the manufacturer's instructions (Sigma). The XTT assay measures the activity of mitochondrial and extramitochondrial dehydrogenases (Bernas and Dobrucki, 2002). The tetrazolium ring of XTT is cleaved by dehydrogenases of viable cells to produce soluble orange formazan, which can be detected spectrophotometrically. After adding XTT, the cells were incubated for 2 h and the increase in formazan absorbance was read at a wavelength of 450 nm on a microplate reader (SpectraMax 190, Molecular Devices, Corp., Sunnyvale, CA).
Mitochondrial membrane potential.
The mitochondrial membrane potential was assayed with the cationic dye 5,5′,6,6′-tetrachloro-1,1′,3,3′-tetraethylbenzimidazolylcarbocyanine iodine using the JC-1 Mitochondrial Membrane Potential Kit (Cell Technology, Mountain View, CA) according to the manufacturer's directions. Briefly, hepatocytes were washed once and then incubated with the JC-1 reagent for 25 min at 37°C. Cells were washed with 1 ml assay buffer and then resuspended in 400 μl assay buffer. Cells were removed from wells with a cell scraper, and 100 μl of the cell suspension was placed into each of three wells of a black 96-well plate. The dye, which exists as green fluorescing monomer (excitation 485 nm and emission 535 nm) in the cytosol, is taken up into healthy mitochondria and forms a red fluorescing aggregate (excitation 550 nm and emission 600 nm). Red and green fluorescence were measured using the Spectramax Gemini fluorescence plate reader (Molecular Devices). Loss of the mitochondrial membrane potential is indicated by the loss of red fluorescence and the increase of green fluorescence.
Immunocytochemistry.
For hypoxia-inducing factor-1α (HIF-1α) or nitrotyrosine staining, hepatocytes were grown on collagen-coated coverslips under varying oxygen concentrations for 1 h (HIF-1α) or treated with APAP for 15 h at 21% oxygen (nitrotyrosine). Following this, cells were washed with PBS and fixed with 1% (wt/vol) paraformaldehyde. After permeabilization, coverslips were blocked with 1% bovine serum albumin followed by incubation with the rabbit anti-HIF-1α antibody (1:100 dilution) (Novus Biologicals, Littleton, CO) or a rabbit anti-nitrotyrosine antibody (Invitrogen, Carlsbad, CA) for 1 h. The secondary antibody was Alexa Fluor 594–conjugated goat anti-rabbit antibody (Invitrogen). Nuclei were stained with 4′,6-diaminidino-2-phenyl-indole, dihydrochloride (DAPI), and images were obtained using a Zeiss Axiovert inverted fluorescence microscope (Carl Zeiss AG, Jena, Germany).
Measurement of mitochondrial ROS and reactive nitrogen species generation in hepatocytes.
For live cell imaging, hepatocytes were allowed to adhere on glass bottom dishes for 3 h after isolation, following which cells were treated with APAP for either 6 or 15 h. After treatment, media were removed and cells were loaded with Mitosox Red (Invitrogen) (2.5μM) or dihydrorhodamine (Fisher Scientific) (10μM) in Hanks' Balanced Salt Solution for 20 min. Cells were then washed and imaged on a Zeiss Axiovert inverted fluorescence microscope using a Texas Red filter.
Quantitation of ROS and reactive nitrogen species generation by spectrofluorimetry.
For quantitation of mitochondrial reactive oxygen generation, cells were loaded with Mitosox Red (Mukhopadhyay et al., 2007) and for reactive nitrogen species (RNS) (peroxynitrite) cells were loaded with dihydrorhodamine (Crow, 1997; Radi et al., 2001) as for imaging experiments, following which cells were washed, lysed with lysis buffer (100mM KCl, 10mM HEPES, 1.5mM MgCl2, 0.1mM ethylene glycol tetraacetic acid, 0.5mM dichlorodiphenyltrichloroethane, 0.5% NP40), and cell lysates prepared. Fluorescence intensity was then measured at 510/580 and 500/536 nm (excitation/emission) for Mitosox Red and rhodamine 123, respectively. The measured fluorescence value was expressed as a fold change compared with that of untreated control at 21% oxygen.
Statistics.
All results were expressed as mean ± SE. Comparisons between multiple groups were performed with one-way ANOVA or, where appropriate, by two-way ANOVA followed by a post hoc Bonferroni test. If the data were not normally distributed, we used the Kruskal-Wallis test (nonparametric ANOVA) followed by Dunn's Multiple Comparisons test; p < 0.05 was considered significant.
RESULTS
Improved Mitochondrial Function and Cell Injury under Reduced Oxygen Concentrations
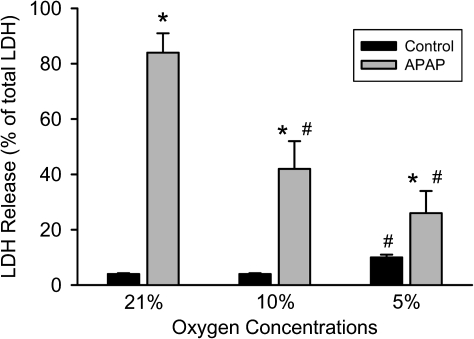
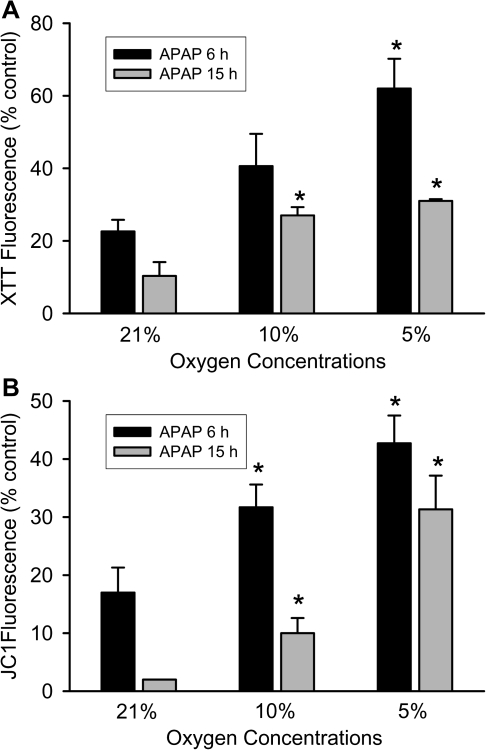
Based on previous time course experiments of APAP toxicity in primary cultured mouse hepatocytes (Bajt et al., 2004), we selected for our studies an early time point (6 h) with limited cell death and a late time point (15 h) with maximal cell necrosis. Consistent with previous findings, treatment of hepatocytes with 5mM APAP under standard cell culture conditions (21% oxygen) induced extensive cell necrosis as indicated by the 84% loss of LDH at 15 h (Fig. 1). Time-matched control cells lost only 4% of their LDH activity. When the oxygen concentration in the incubator was lowered to 10 or 5%, LDH release was attenuated by 50 and 70%, respectively (Fig. 1). However, at 5% oxygen, the time-matched control cells showed a slightly higher loss of viability compared with the higher oxygen concentrations (Fig. 1). Because previous in vitro studies demonstrated a progressive loss of mitochondrial function after exposure to APAP (Bajt et al., 2004; Kon et al., 2004), the XTT and the JC-1 assay were used to evaluate mitochondrial dehydrogenase activity and the mitochondrial membrane potential, respectively, at 6 and 15 h after 5mM APAP. Hepatocytes exposed to APAP while cultured under 21% oxygen showed a severe loss of both the XTT fluorescence (78%) and a decline of the JC-1 fluorescence ratio (83%) at 6 h compared with time-matched control cells (Fig. 2). Because LDH release is less than 20% at 6 h (Bajt et al., 2004), these findings indicate a substantial loss of mitochondrial function before the onset of massive cell necrosis. Both parameters showed further deterioration of mitochondrial function at 15 h (Fig. 2). Consistent with the LDH release data (Fig. 1), mitochondrial dysfunction was delayed at lower oxygen concentrations and was not quite as severe as observed under 21% oxygen (Fig. 2). Together these data clearly demonstrate less APAP-induced cell injury in primary cultured mouse hepatocytes when oxygen concentrations are more close to the physiological oxygen levels observed in sinusoids.
FIG. 1.
Necrotic cell death measured by LDH release in primary mouse hepatocytes treated with 5mM APAP after 15 h at various oxygen concentrations. Experiments were carried out as described in the Materials and Methods section. Values represent mean ± SE of n = 3 independent experiments. *p < 0.05 (when compared with respective control) and #p < 0.05 (compared with APAP-treated samples at 21% oxygen).
FIG. 2.
Mitochondrial function in primary hepatocytes after treatment with 5mM APAP for 6 or 15 h at various oxygen concentrations. Mitochondrial function (A) and membrane potential (B) were determined by reduction of XTT and JC-1 fluorescence, respectively. Data are given as percentage compared with untreated control at each oxygen concentration and time point. Values represent mean ± SE of n = 3 independent experiments. *p < 0.05 (compared with APAP-treated samples at 21% oxygen).
Do Lower Oxygen Concentrations Cause Hypoxia?
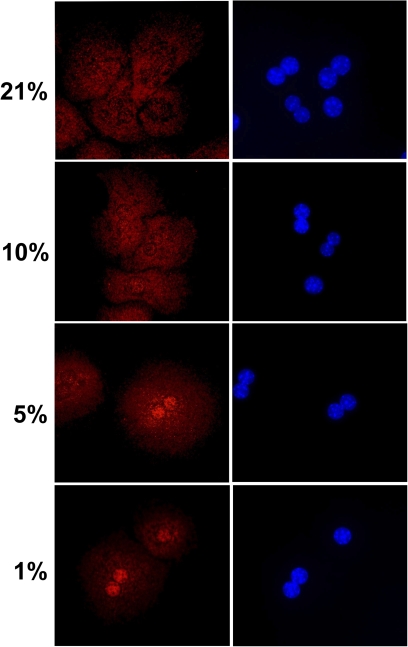
A critical question related to these experiments is whether these lower oxygen concentrations in the incubator can deliver sufficient oxygen for aerobic metabolism or can induce hypoxia. One of the most sensitive indicators of cellular hypoxia is the translocation of HIF-1α from the cytosol to the nucleus (Moon et al., 2009). Immunostaining of cultured mouse hepatocytes for HIF-1α showed the selective cytosolic locations and the absence of nuclear staining in hepatocytes cultured under 21 and 10% oxygen (Fig. 3). In contrast, cells exposed to 5 and 1% oxygen had nuclear staining for HIF-1α (Fig. 3). In support of these data, lactate concentrations in the cell culture supernatant were measured. Lactate was only detectable in culture medium of cells exposed to either 5 or 1% oxygen but not of cells exposed to 21 or 10% oxygen (Table 1). Overall, these data indicate that oxygen concentrations of 10% or higher are sufficient to sustain aerobic metabolism in cultured hepatocytes.
FIG. 3.
HIF-1α localization in primary hepatocytes exposed to various oxygen concentrations. Cells were isolated as described in the Materials and Methods section and cultured on glass coverslips at 21, 10, 5, or 1% oxygen for 1 h. Cells were then fixed and stained for HIF-1α. Panels on the left show HIF-1α, and the panels on the right show nuclear staining with DAPI.
TABLE 1.
Lactate Concentrations in Cell Culture Supernatant
| Lactate (mM) |
||
| 6 h | 20 h | |
| 21% Oxygen | n.d. | n.d. |
| 10% Oxygen | n.d. | n.d. |
| 5% Oxygen | 3.10 ± 0.03 | 1.78 ± 0.02 |
| 1% Oxygen | 3.06 ± 0.10 | 3.87 ± 0.60 |
Note. Lactate concentrations were measured in the cell culture supernatant of untreated mouse hepatocytes exposed to various oxygen concentrations (vol/vol) at 6 and 20 h after isolation of the cells. n.d., not detectable.
Is the Metabolic Activation of APAP Affected by Oxygen?
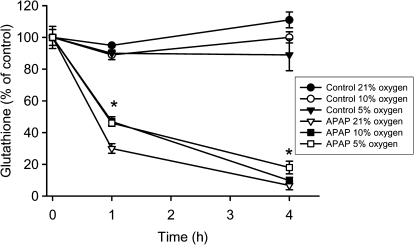
Because APAP toxicity involves reactive metabolite formation, cellular GSH depletion, and protein binding as the initiating events, cellular GSH levels were measured. The early GSH depletion rate after APAP exposure is generally considered a measure of NAPQI formation (Jaeschke, 1990; Saito et al., 2010). Control cells at 21, 10, or 5% oxygen did not show relevant changes of hepatocellular GSH levels (48.5 ± 2.4 nmol/mg protein at t = 0 h) over the 4-h observation period (Fig. 4). The levels of GSSG in these cells at t = 0 h were measured as 0.17 ± 0.2 nmol GSH equivalents/mg protein (0.36 ± 0.04% of total GSH) with no significant difference between cells at different oxygen concentrations. Cells exposed to 5mM APAP under 21% oxygen lost 70 and 93% of their GSH at 1 and 4 h, respectively (Fig. 4). At 10% oxygen, cellular GSH levels were 54 (1 h) and 90% (4 h) lower compared with time-matched control cells (Fig. 4). Thus, the early minor delay in GSH depletion indicates that there was a slightly reduced rate of reactive metabolite formation under 10% oxygen compared with 21%. However, by 4 h, GSH was more than 90% depleted under both conditions with no significant difference between the two oxygen levels. Under 5% oxygen, GSH depletion was similar to 10% oxygen at 1 h but remained significantly higher than both 10 and 21% oxygen at 4 h (Fig. 4). GSSG levels became undetectable in all APAP-exposed cells independent of the oxygen levels. Because an oxidant stress is not detectable before 3–4 h after APAP exposure (Bajt et al., 2004), the initial GSH depletion is unlikely because of oxidation but reflects conjugation with NAPQI.
FIG. 4.
GSH levels in untreated primary mouse hepatocytes or after treatment with 5mM APAP at 21, 10, or 5% oxygen. Experiments were carried out as described in the Materials and Methods section. Values represent mean ± SE of n = 3 independent experiments.
APAP-Induced Mitochondrial Oxidant Stress at Reduced Oxygen Concentrations
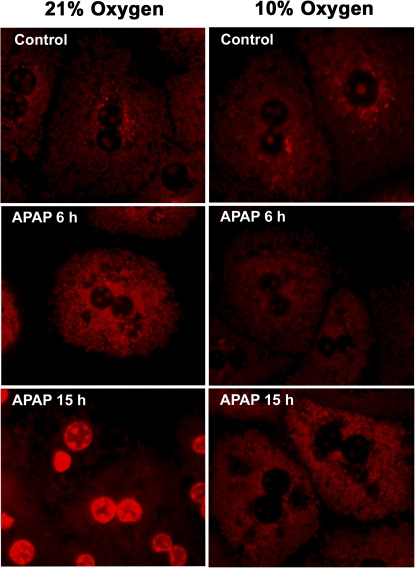
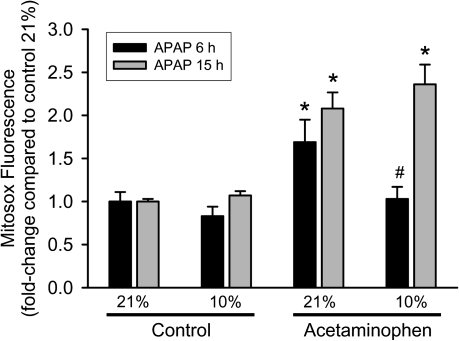
Previous studies showed the presence and the importance of mitochondrial oxidant stress for APAP-induced liver injury in vivo (Jaeschke, 1990; Jaeschke et al., 2003; Tirmenstein and Nelson, 1990). Because mitochondrial formation of ROS can be affected by the cellular oxygen concentrations (Kowaltowski et al., 2009), we tested if a reduction in mitochondrial oxidant stress could play a role in the protection against APAP toxicity at 10% oxygen. First, mitochondrial ROS production was evaluated in hepatocytes after exposure to APAP. The fluorescent dye Mitosox Red, which has been suggested to detect mainly mitochondrial superoxide (Mukhopadhyay et al., 2007), was used for these experiments. Although the specificity of Mitosox Red for superoxide has been controversially discussed (Robinson et al., 2006), its use in this context was to evaluate the impact of various oxygen tensions on mitochondrial oxidative stress. APAP-treated hepatocytes as well as control cells at both oxygen concentrations (except those treated with APAP at 21% oxygen for 15 h) showed punctate fluorescence characteristic of mitochondrial staining (Fig. 5). This suggested that the dye was measuring mitochondrial radical generation in all groups except one. Quantitation of Mitosox Red fluorescence indicated that culturing cells under 10% oxygen does not significantly affect mitochondrial ROS production compared with 21% (Fig. 6). However, treatment with APAP under 21% oxygen resulted in a significant increase in mitochondrial reactive oxygen formation at 6 h; a mitochondrial oxidant stress was only observed at 15 h but not at 6 h after APAP exposure when cells were cultured under 10% oxygen (Fig. 6). APAP-treated cells kept under 21% oxygen still showed substantially increased Mitosox Red fluorescence (Fig. 6). However, a significant number of cells were necrotic at this time point (Fig. 1), and it has been demonstrated that in dead cells, the oxidized Mitosox gives very strong fluorescence because of the release of the fluorophore from the mitochondria and binding to nuclear DNA (Mukhopadhyay et al., 2007). This effect could be confirmed in our study (Fig. 5).
FIG. 5.
Mitosox fluorescence in mitochondria after treatment with 5mM APAP for 6 or 15 h at 21 or 10% oxygen. Primary mouse hepatocytes were isolated and treated with APAP; cells were loaded with Mitosox after 6 or 15 h and subjected to live cell imaging.
FIG. 6.
Mitochondrial reactive oxygen production after treatment with APAP for 6 or 15 h at 21 or 10% oxygen. Primary mouse hepatocytes were isolated and treated with APAP; cells were loaded with Mitosox after 6 or 15 h, lysed, and fluorescence measured on a spectrofluorometer. Data are expressed as mean ± SE of three independent experiments. *p < 0.05 (compared with respective control) and #p < 0.05 (compared with 21% oxygen).
APAP-Induced Reactive Nitrogen Formation at Reduced Oxygen Concentrations
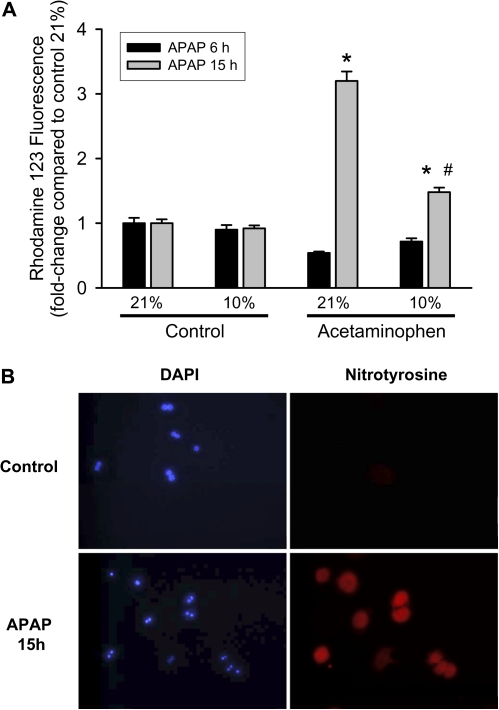
Formation of RNS such as peroxynitrite because of reaction of superoxide and nitric oxide has been shown to be involved in APAP-induced hepatotoxicity (Knight et al., 2001, 2002). To investigate whether the protection against mitochondrial superoxide generation at 10% oxygen could influence APAP-induced generation of RNS, dihydrorhodamine, which can measure peroxynitrite in biological systems (Crow, 1997; Radi et al., 2001), was used. Similar to Mitosox Red, dihydrorhodamine staining revealed punctate mitochondrial staining in all cells, confirming that the dye was reporting mitochondrial signals in all groups (data not shown). Quantitation of rhodamine fluorescence indicated that cultured hepatocytes exposed to 21 or 10% oxygen for up to 15 h did not show differences in RNS formation (Fig. 7A). However, cells showed a significant increase in rhodamine fluorescence under 21% oxygen when treated with 5mM APAP for 15 h (Fig. 7A). This increase in rhodamine fluorescence was significantly blunted when cells were cultured under 10% oxygen (Fig. 7A). To verify that the rhodamine fluorescence represents an increase in RNS, cells were stained for nitrotyrosine protein adducts, which is a footprint of peroxynitrite. At 15 h, substantial nitrotyrosine staining was detectable in cells exposed to APAP at 21% oxygen but not in untreated control cells (Fig. 7B).
FIG. 7.
Nitrotyrosine staining and rhodamine fluorescence as indicators of reactive nitrogen formation. (A) Rhodamine 123 fluorescence (reflecting RNS) in mitochondria after treatment with 5mM APAP for 6 or 15 h at 21 or 10% oxygen. Primary mouse hepatocytes were isolated and treated with APAP; cells were loaded with dihydrorhodamine after 6 or 15 h, lysed, and fluorescence measured on a spectrofluorometer. Data are expressed as mean ± SE of three independent experiments. *p < 0.05 (compared with respective control) and #p < 0.05 (compared with 21% oxygen). (B) Cells were isolated as described in the Materials and Methods section and cultured on glass coverslips at 21% oxygen for 15 h. Cells were then fixed and stained for nitrotyrosine protein adducts as indicator for peroxynitrite formation. Panels on the left show staining of nuclei with DAPI, and on the right panels, nitrotyrosine protein adducts are visualized.
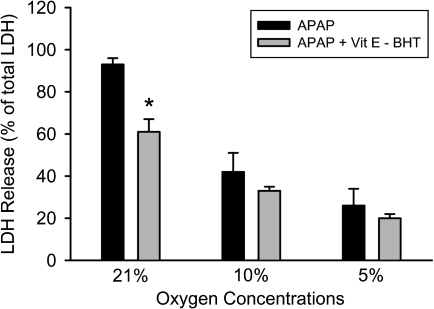
Because a mixture of the lipid-soluble antioxidants vitamin E and BHT protected against APAP-induced liver cell injury in vitro under 21% oxygen (Nagai et al., 2002) but not in vivo (Knight et al., 2003), it was tested whether vitamin E and BHT are equally effective under all oxygen concentrations. Consistent with previous data (Nagai et al., 2002), vitamin E and BHT partially protected against APAP-induced cell death (Fig. 8). However, the same pretreatment had no significant effect at lower oxygen concentrations (Fig. 8). These data are consistent with the hypothesis that higher oxygen levels promote reactive oxygen formation and consequently favor more a free radical–based injury mechanism to a greater extent than culture conditions with lower oxygen levels.
FIG. 8.
Necrotic cell death measured by LDH release in primary mouse hepatocytes treated with 5mM APAP after 15 h at various oxygen concentrations. Some of the cells were pretreated for 1 h with 50μM α-tocopheryl succinate (Vit E) and 20μM BHT. Values represent mean ± SE of n = 3 independent experiments. *p < 0.05 (when compared with respective APAP control).
DISCUSSION
The objective of this study was to evaluate if the oxygen tensions used to study APAP hepatotoxicity in cell culture may affect the mechanisms of cell death. This is a critical question because the vast majority of cells are being cultured under 5% CO2/air (i.e., 21% oxygen, vol/vol), which is more than twice the highest oxygen levels hepatocytes in the periportal area are exposed to in vivo (Kietzmann and Jungermann, 1997).
Oxygen Tension and APAP-Induced Cell Death
Our data clearly indicate that lower oxygen tensions correlate with reduced cell injury during APAP hepatotoxicity (Fig. 1). We chose to study 5 and 10% oxygen because these levels represent the range of physiological oxygen tensions in hepatic sinusoids (Kietzmann and Jungermann, 1997). However, accumulation of lactate in the cell culture supernatant and the nuclear translocation of HIF-1α at 5% oxygen suggest that these hepatocytes are at least in part hypoxic (Fig. 3). Because oxygen has to diffuse from the gas phase through the cell culture medium to the cells and the mitochondria, these findings indicate that the oxygen gradient under these conditions (5% oxygen) is insufficient to provide enough oxygen to mitochondria for aerobic metabolism of cultured hepatocytes. Thus, the protective effect observed under 5% oxygen may be more likely caused by hypoxic preconditioning (Bernhardt et al., 2007). Consequently, 10% oxygen is a more relevant oxygen tension for cultured murine hepatocytes. Although hepatocytes in the centrilobular area of an intact liver in vivo are exposed to even lower oxygen levels without being hypoxic, this may reflect the more efficient oxygen delivery in vivo in the presence of hemoglobin compared with a static cell culture system. This suggests that the optimal oxygen concentrations for cell culture should be determined based on the aerobic function of the cell rather than only the in vivo oxygen levels. In either case, the widely used 21% oxygen levels are generally too high for most primary cells. In support of this conclusion, cultured sinusoidal endothelial cells appear to be more viable under 5% oxygen compared with 21% oxygen (Martinez et al., 2008). This suggests that the optimal oxygen tension for cell culture may be cell type dependent. Nevertheless, both studies consistently showed higher cell viability under baseline and stress conditions when cells were cultured under lower oxygen tension than room air (21%).
Metabolic Activation of APAP under Various Oxygen Levels
A potential mechanism for the lower injury in cells cultured under 10 or 5% oxygen could be reduced metabolic activation of APAP. Formation of the reactive metabolite NAPQI, which is initially detoxified by conjugation with GSH, is a critical initiating event for the toxicity (Nelson, 1990). Thus, the early depletion rate of GSH before loss of cell viability is a sensitive indicator for NAPQI formation in vivo (Jaeschke, 1990; Saito et al., 2010) and in cell culture (Bajt et al., 2004). Our data showed that APAP exposure caused GSH depletion of > 90% at 4 h under 10 or 21% oxygen tension (Fig. 4). However, there was a small but significant difference at 1 h, suggesting that there was a modest reduction of NAPQI formation under 10% oxygen tensions. Given the fact that this effect on metabolic activation was only temporary and did not prevent the almost complete depletion of cellular GSH, it appears unlikely that this minor decrease in the rate of NAPQI formation could explain the protective effect observed in cells cultured under lower oxygen tensions. However, based on the consistently higher GSH levels under 5% oxygen, these moderately hypoxic conditions attenuated metabolic activation, which may have a greater impact on the injury.
Mitochondrial Oxidant Stress under 10% Oxygen
It is generally assumed that cells exposed to higher oxygen concentrations generate more ROS by mitochondria (Kowaltowski et al., 2009). In fact, cultured sinusoidal endothelial cells produced substantially more ROS at 21% oxygen compared with 5% (Martinez et al., 2008). However, our data using the specific and sensitive fluorescence detector for mitochondrial ROS (Mitosox) did not show a significant difference between baseline mitochondrial ROS formation in cultured hepatocytes under different oxygen concentrations. This is consistent with no additional loss in cell viability under 21% oxygen compared with the lower oxygen levels. In contrast, there was a significant difference in mitochondrial oxidant stress at 6 h after APAP when cells were cultured under 10% oxygen (Fig. 5). Furthermore, less RNS, as measured by dihydrorhodamine 123 fluorescence, were formed at 15 h after APAP (Fig. 7). Although dihydrorhodamine has been used as a measure of superoxide in cells (Khand et al., 2002), the specificity of the dye for superoxide is unclear because dihydrorhodamine is unreactive toward superoxide or hydrogen peroxide in the absence of a catalyst (Wardman, 2007). However, dihydrorhodamine is directly oxidized by peroxynitrite (Kooy et al., 1994; Wardman, 2007), and dihydrorhodamine fluorescence has been used as an indicator for peroxynitrite in cell culture (Crow, 1997; Radi et al., 2001). Consistent with these findings, nitrotyrosine protein adducts as indicators for peroxynitrite formation were detectable in these cells at 15 h (Fig. 7).
The absence of elevated mitochondrial ROS formation at 6 h (Fig. 5) and the occurrence of oxidant stress and limited peroxynitrite formation at 15 h (Figs. 6 and 7) correlated with the delayed and attenuated mitochondrial dysfunction and cell necrosis under 10% oxygen (Fig. 2). These data indicate that the fundamental sequence of events including metabolic activation, mitochondrial oxidant stress, and RNS formation leading to cell necrosis are not different between cells cultured under 21 oxygen or 10% oxygen levels. However, the increase of the mitochondrial oxidant stress, the subsequent decline of the mitochondrial function, and cell death appears to be accelerated and more amplified under 21% oxygen. This higher mitochondrial oxidant stress induced by APAP toxicity under 21% oxygen may be the reason for the tendency that lipid peroxidation appears to be a more relevant cell injury mechanism in vitro (21% oxygen) (Albano et al., 1983; Nagai et al., 2002) than in vivo (Knight et al., 2003). In support of this conclusion, a mixture of vitamin E and BHT, chain-breaking, lipid-soluble antioxidants which can prevent lipid peroxidation, was more effective in attenuating APAP-induced liver cell death at 21% oxygen compared with lower, more physiological oxygen concentrations (Fig. 8). These findings indicate that supraphysiological oxygen concentrations in cell culture can affect mechanisms of cell injury or signaling pathways. As previously discussed, adaptation to these artificial cell culture conditions may lead to overemphasis of cellular redox signaling, which is less relevant in vivo (Halliwell, 2003). Furthermore, the (oxidant) stress in cultured cells under 21% oxygen may trigger apoptotic cell death when necrosis is prevented during hypoxia-reoxygenation (Kim et al., 2003) or APAP toxicity (Kon et al., 2004). Protection against APAP-induced oxidant stress and cell necrosis in vivo does not cause apoptosis but results in cell survival and even triggers cell cycle activation (Bajt et al., 2003).
In summary, there are important differences between in vivo responses to drugs and chemicals and effects observed in primary cultured hepatocytes exposed to the same stressors. Our present studies clearly indicate that the generally used supraphysiological oxygen tensions (21%) in cell culture can at least exacerbate the mitochondrial oxidant stress during APAP hepatotoxicity, which leads to accelerated and enhanced necrosis compared with cells cultured under more physiologically relevant oxygen tensions (10%). Although this does not appear to fundamentally change the mechanisms of cell death, the higher oxygen levels could be responsible for the differential protection by lipid-soluble antioxidants in cell culture compared with in vivo experiments. Thus, cell culture conditions, especially the oxygen tensions, need to be considered when the mechanisms of cell injury and potential therapeutic intervention strategies investigated in cultured cells are extrapolated to animals or humans.
FUNDING
National Institutes of Health (R01 DK070195, R01 AA12916 to H.J.); National Center for Research Resources (P20 RR016475, P20 RR021940), a component of the National Institutes of Health.
References
- Albano E, Poli G, Chiarpotto E, Biasi F, Dianzani MU. Paracetamol-stimulated lipid peroxidation in isolated rat and mouse hepatocytes. Chem. Biol. Interact. 1983;47:249–263. doi: 10.1016/0009-2797(83)90161-8. [DOI] [PubMed] [Google Scholar]
- Bajt ML, Cover C, Lemasters JJ, Jaeschke H. Nuclear translocation of endonuclease G and apoptosis-inducing factor during acetaminophen-induced liver injury. Toxicol. Sci. 2006;94:217–225. doi: 10.1093/toxsci/kfl077. [DOI] [PubMed] [Google Scholar]
- Bajt ML, Farhood A, Lemasters JJ, Jaeschke H. Mitochondrial bax translocation accelerates DNA fragmentation and cell necrosis in a murine model of acetaminophen hepatotoxicity. J. Pharmacol. Exp. Ther. 2008;324:8–14. doi: 10.1124/jpet.107.129445. [DOI] [PubMed] [Google Scholar]
- Bajt ML, Knight TR, Farhood A, Jaeschke H. Scavenging peroxynitrite with glutathione promotes regeneration and enhances survival during acetaminophen-induced liver injury in mice. J. Pharmacol. Exp. Ther. 2003;307:67–73. doi: 10.1124/jpet.103.052506. [DOI] [PubMed] [Google Scholar]
- Bajt ML, Knight TR, Lemasters JJ, Jaeschke H. Acetaminophen-induced oxidant stress and cell injury in cultured mouse hepatocytes: protection by N-acetyl cysteine. Toxicol. Sci. 2004;80:343–349. doi: 10.1093/toxsci/kfh151. [DOI] [PubMed] [Google Scholar]
- Bergmeyer HU, editor. Methods of Enzymatic Analysis. New York: Academic Press, Inc.; 1974. pp. 1464–2148. [Google Scholar]
- Bernas T, Dobrucki J. Mitochondrial and nonmitochondrial reduction of MTT: interaction of MTT with TMRE, JC-1, and NAO mitochondrial fluorescent probes. Cytometry. 2002;47:236–242. doi: 10.1002/cyto.10080. [DOI] [PubMed] [Google Scholar]
- Bernhardt WM, Warnecke C, Willam C, Tanaka T, Wiesener MS, Eckardt KU. Organ protection by hypoxia and hypoxia-inducible factors. Methods Enzymol. 2007;435:221–245. doi: 10.1016/S0076-6879(07)35012-X. [DOI] [PubMed] [Google Scholar]
- Cover C, Mansouri A, Knight TR, Bajt ML, Lemasters JJ, Pessayre D, Jaeschke H. Peroxynitrite-induced mitochondrial and endonuclease-mediated nuclear DNA damage in acetaminophen hepatotoxicity. J. Pharmacol. Exp. Ther. 2005;315:879–887. doi: 10.1124/jpet.105.088898. [DOI] [PubMed] [Google Scholar]
- Crow JP. Dichlorodihydrofluorescein and dihydrorhodamine 123 are sensitive indicators of peroxynitrite in vitro: implications for intracellular measurement of reactive nitrogen and oxygen species. Nitric Oxide. 1997;1:145–157. doi: 10.1006/niox.1996.0113. [DOI] [PubMed] [Google Scholar]
- Feldmann G, Haouzi D, Moreau A, Durand-Schneider AM, Bringuier A, Berson A, Mansouri A, Fau D, Pessayre D. Opening of the mitochondrial permeability transition pore causes matrix expansion and outer membrane rupture in Fas-mediated hepatic apoptosis in mice. Hepatology. 2000;31:674–683. doi: 10.1002/hep.510310318. [DOI] [PubMed] [Google Scholar]
- Gujral JS, Knight TR, Farhood A, Bajt ML, Jaeschke H. Mode of cell death after acetaminophen overdose in mice: apoptosis or oncotic necrosis? Toxicol. Sci. 2002;67:322–328. doi: 10.1093/toxsci/67.2.322. [DOI] [PubMed] [Google Scholar]
- Halliwell B. Oxidative stress in cell culture: an under-appreciated problem? FEBS Lett. 2003;540:3–6. doi: 10.1016/s0014-5793(03)00235-7. [DOI] [PubMed] [Google Scholar]
- Jaeschke H. Glutathione disulfide formation and oxidant stress during acetaminophen-induced hepatotoxicity in mice in vivo: the protective effect of allopurinol. J. Pharmacol. Exp. Ther. 1990;255:935–941. [PubMed] [Google Scholar]
- Jaeschke H, Bajt ML. Intracellular signaling mechanisms of acetaminophen-induced liver cell death. Toxicol. Sci. 2006;89:31–41. doi: 10.1093/toxsci/kfi336. [DOI] [PubMed] [Google Scholar]
- Jaeschke H, Knight TR, Bajt ML. The role of oxidant stress and reactive nitrogen species in acetaminophen hepatotoxicity. Toxicol. Lett. 2003;144:279–288. doi: 10.1016/s0378-4274(03)00239-x. [DOI] [PubMed] [Google Scholar]
- Jaeschke H, Mitchell JR. Use of isolated perfused organs in hypoxia and ischemia/reperfusion oxidant stress. Methods Enzymol. 1990;186:752–759. doi: 10.1016/0076-6879(90)86175-u. [DOI] [PubMed] [Google Scholar]
- Khand FD, Gordge MP, Robertson WG, Noronha-Dutra AA, Hothersall JS. Mitochondrial superoxide production during oxalate-mediated oxidative stress in renal epithelial cells. Free Radic. Biol. Med. 2002;32:1339–1350. doi: 10.1016/s0891-5849(02)00846-8. [DOI] [PubMed] [Google Scholar]
- Kietzmann T, Jungermann K. Modulation by oxygen of zonal gene expression in liver studied in primary rat hepatocyte cultures. Cell Biol. Toxicol. 1997;13:243–255. doi: 10.1023/a:1007427206391. [DOI] [PubMed] [Google Scholar]
- Kim JS, Qian T, Lemasters JJ. Mitochondrial permeability transition in the switch from necrotic to apoptotic cell death in ischemic rat hepatocytes. Gastroenterology. 2003;124:494–503. doi: 10.1053/gast.2003.50059. [DOI] [PubMed] [Google Scholar]
- Knight TR, Fariss MW, Farhood A, Jaeschke H. Role of lipid peroxidation as a mechanism of liver injury after acetaminophen overdose in mice. Toxicol. Sci. 2003;76:229–236. doi: 10.1093/toxsci/kfg220. [DOI] [PubMed] [Google Scholar]
- Knight TR, Ho YS, Farhood A, Jaeschke H. Peroxynitrite is a critical mediator of acetaminophen hepatotoxicity in murine livers: protection by glutathione. J. Pharmacol. Exp. Ther. 2002;303:468–475. doi: 10.1124/jpet.102.038968. [DOI] [PubMed] [Google Scholar]
- Knight TR, Kurtz A, Bajt ML, Hinson JA, Jaeschke H. Vascular and hepatocellular peroxynitrite formation during acetaminophen toxicity: role of mitochondrial oxidant stress. Toxicol. Sci. 2001;62:212–220. doi: 10.1093/toxsci/62.2.212. [DOI] [PubMed] [Google Scholar]
- Kon K, Kim JS, Jaeschke H, Lemasters JJ. Mitochondrial permeability transition in acetaminophen-induced necrotic and apoptotic cell death to cultured mouse hepatocytes. Hepatology. 2004;40:1170–1179. doi: 10.1002/hep.20437. [DOI] [PubMed] [Google Scholar]
- Kooy NW, Royall JA, Ischiropoulos H, Beckman JS. Peroxynitrite-mediated oxidation of dihydrorhodamine 123. Free Radic. Biol. Med. 1994;16:149–156. doi: 10.1016/0891-5849(94)90138-4. [DOI] [PubMed] [Google Scholar]
- Kowaltowski AJ, de Souza-Pinto NC, Castilho RF, Vercesi AE. Mitochondria and reactive oxygen species. Free Radic. Biol. Med. 2009;47:333–343. doi: 10.1016/j.freeradbiomed.2009.05.004. [DOI] [PubMed] [Google Scholar]
- Larson AM, Polson J, Fontana RJ, Davern TJ, Lalani E, Hynan LS, Reisch JS, Schiodt FV, Ostapowicz G, Shakil AO, et al. Acute liver failure study group. Acetaminophen-induced acute liver failure: results of a United States multicenter, prospective study. Hepatology. 2005;42:1364–1372. doi: 10.1002/hep.20948. [DOI] [PubMed] [Google Scholar]
- Martinez I, Nedredal GI, Øie CI, Warren A, Johansen O, Le Couteur DG, Smedsrød B. The influence of oxygen tension on the structure and function of isolated liver sinusoidal endothelial cells. Comp. Hepatol. 2008;7:4. doi: 10.1186/1476-5926-7-4. [DOI] [PMC free article] [PubMed] [Google Scholar]
- Meyers LL, Beierschmitt WP, Khairallah EA, Cohen SD. Acetaminophen-induced inhibition of hepatic mitochondrial respiration in mice. Toxicol. Appl. Pharmacol. 1988;93:378–387. doi: 10.1016/0041-008x(88)90040-3. [DOI] [PubMed] [Google Scholar]
- Moon JO, Welch TP, Gonzalez FJ, Copple BL. Reduced liver fibrosis in hypoxia-inducible factor-1alpha-deficient mice. Am. J. Physiol. Gastrointest. Liver Physiol. 2009;296:G582–G592. doi: 10.1152/ajpgi.90368.2008. [DOI] [PMC free article] [PubMed] [Google Scholar]
- Mukhopadhyay P, Rajesh M, Hasko G, Hawkins BJ, Madesh M, Pacher P. Simultaneous detection of apoptosis and mitochondrial superoxide production in live cells by flow cytometry and confocal microscopy. Nat. Protoc. 2007;2:2295–2301. doi: 10.1038/nprot.2007.327. [DOI] [PMC free article] [PubMed] [Google Scholar]
- Nagai H, Matsumaru K, Feng G, Kaplowitz N. Reduced glutathione depletion causes necrosis and sensitization to tumor necrosis factor-alpha-induced apoptosis in cultured mouse hepatocytes. Hepatology. 2002;36:55–64. doi: 10.1053/jhep.2002.33995. [DOI] [PubMed] [Google Scholar]
- Nelson SD. Molecular mechanisms of the hepatotoxicity caused by acetaminophen. Semin. Liver Dis. 1990;10:267–278. doi: 10.1055/s-2008-1040482. [DOI] [PubMed] [Google Scholar]
- Qiu Y, Benet LZ, Burlingame AL. Identification of hepatic protein targets of the reactive metabolites of the non-hepatotoxic regioisomer of acetaminophen, 3'-hydroxyacetanilide, in the mouse in vivo using two-dimensional gel electrophoresis and mass spectrometry. Adv. Exp. Med. Biol. 2001;500:663–673. doi: 10.1007/978-1-4615-0667-6_99. [DOI] [PubMed] [Google Scholar]
- Radi R, Peluffo G, Alvarez MN, Naviliat M, Cayota A. Unraveling peroxynitrite formation in biological systems. Free Radic. Biol. Med. 2001;30:463–488. doi: 10.1016/s0891-5849(00)00373-7. [DOI] [PubMed] [Google Scholar]
- Robinson KM, Janes MS, Pehar M, Monette JS, Ross MF, Hagen TM, Murphy MP, Beckman JS. Selective fluorescent imaging of superoxide in vivo using ethidium-based probes. Proc. Natl. Acad. Sci. U.S.A. 2006;103:15038–15043. doi: 10.1073/pnas.0601945103. [DOI] [PMC free article] [PubMed] [Google Scholar]
- Saito C, Yan HM, Artigues A, Villar MT, Farhood A, Jaeschke H. Mechanism of protection by metallothionein against acetaminophen hepatotoxicity. Toxicol. Appl. Pharmacol. 2010;242:182–190. doi: 10.1016/j.taap.2009.10.006. [DOI] [PMC free article] [PubMed] [Google Scholar]
- Tirmenstein MA, Nelson SD. Subcellular binding and effects on calcium homeostasis produced by acetaminophen and a nonhepatotoxic regioisomer, 3'-hydroxyacetanilide, in mouse liver. J. Biol. Chem. 1989;264:9814–9819. [PubMed] [Google Scholar]
- Tirmenstein MA, Nelson SD. Acetaminophen-induced oxidation of protein thiols. Contribution of impaired thiol-metabolizing enzymes and the breakdown of adenine nucleotides. J. Biol. Chem. 1990;265:3059–3065. [PubMed] [Google Scholar]
- Wardman P. Fluorescent and luminescent probes for measurement of oxidative and nitrosative species in cells and tissues: progress, pitfalls, and prospects. Free Radic. Biol. Med. 2007;43:995–1022. doi: 10.1016/j.freeradbiomed.2007.06.026. [DOI] [PubMed] [Google Scholar]


