Abstract
Foxa1 and Foxa2 play both redundant and distinct roles in early pancreas development. We demonstrate here that inducible ablation of both transcription factors in mature mouse β-cells leads to impaired glucose homeostasis and insulin secretion. The defects in both glucose-stimulated insulin secretion and intracellular calcium oscillation are more pronounced than those in β-cells lacking only Foxa2. Unexpectedly, in contrast to the severe reduction of β-cell-enriched factors contributing to metabolic and secretory pathways, expression of a large number of genes that are involved in neural differentiation and function is significantly elevated. We further demonstrate that expression of carbohydrate response element-binding protein (ChREBP or Mlxipl), an important transcriptional regulator of carbohydrate metabolism, is significantly affected in compound Foxa1/a2 mutant β-cells. ChREBP expression is directly controlled by Foxa1 and Foxa2 in both the fetal endocrine pancreas as well as mature islets. These data demonstrate that Foxa1 and Foxa2 play crucial roles in the development and maintenance of β-cell-specific secretory and metabolic pathways.
The winged helix transcription factors Foxa1 and Foxa2 cooperate to maintain insulin secretion in β-cells by activating a network of metabolic genes and by preventing activation of neuronal genes.
Foxa1 and Foxa2 belong to the mammalian forkhead transcription factor gene family and regulate the fetal development of a number of metabolic and endocrine-related tissues (1,2,3,4,5,6,7,8,9,10). Recent studies employing tissue-specific ablation of these two genes have uncovered many additional functions not revealed in previous single-mutant models. For instance, in the mouse liver, simultaneous loss of Foxa1 and Foxa2 derepresses IL-6 expression and leads to abnormal bile duct expansion (9). In the intestinal epithelium, compound ablation of both genes causes severe reduction in the differentiation of several secretory cell types (10). Interestingly, in addition to their diverse roles in the development and function of digestive tissues, Foxa1 and Foxa2 regulate multiple phases of the development of midbrain dopaminergic neurons (11,12,13).
The expression of Foxa1 and Foxa2 in the pancreatic primordium precedes pancreas morphogenesis and persists in all exocrine and endocrine cell types throughout development and adulthood (3,8). Conditional inactivation of Foxa2 in early pancreatic epithelial precursors prevents terminal differentiation of α-cells (3), whereas ablation of Foxa2 in fetal β-cells affects islet morphology and secretory function, and the resultant neonatal mutants die shortly after birth due to hypoglycemia (7). Compound ablation of both Foxa1 and Foxa2 in the pancreatic primordium severely blocks the initial morphogenesis and differentiation of both acinar and islet tissues (8), strongly suggesting redundant roles for the two factors in early pancreas development. In addition to these redundant functions, Foxa1 and Foxa2 also have unique roles, both in the regulation of the Pdx1 enhancer and in the promotion of pancreatic cell differentiation (3,8). These studies have provided strong evidence for the redundant and distinct roles of Foxa1 and Foxa2 in regulating early pancreas development; common functions of the Foxa genes in mature β-cells, however, remain undefined.
Using an inducible Cre-loxP conditional gene ablation strategy, we had previously inactivated Foxa2 in adult pancreatic β-cells and demonstrated abnormal oscillations of nutrient-stimulated intracellular Ca2+ and exuberant exocytosis of insulin granules in β-cells (14). Because Foxa1 functions normally in these Foxa2-deficient β-cells, redundant functions of the two proteins are still maintained. Here, we demonstrate that inducible, simultaneous ablation of both factors in mature β-cell leads to severely abnormal glucose homeostasis and insulin secretion. Surprisingly, in addition to the discovery of a severe reduction of β-cell-enriched factors involved in normal metabolic and secretory activities, a large number of genes that participate in neuronal differentiation and function are activated in compound-mutant β-cells. We also uncover an important novel target of Foxa1 and Foxa2, carbohydrate response element-binding protein (ChREBP), which is a master regulator of carbohydrate metabolism. Thus, Foxa1 and Foxa2 are essential for the maintenance of the metabolic and secretory features in mature β-cells.
Results
Ablation of Foxa1 and Foxa2 in mature β-cell leads to severe hypoglycemia
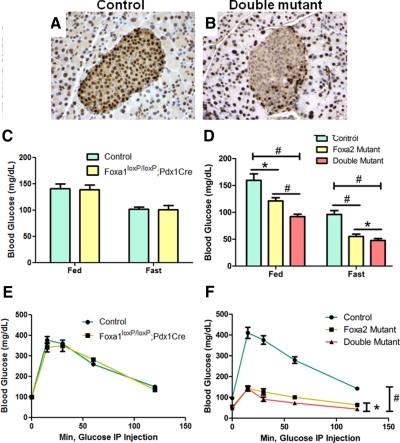
We derived Foxa1loxP/loxP;Foxa2loxP/loxP; Pdx1CreERT2 and control Foxa1loxP/loxP; Foxa2loxP/loxP mice and administrated tamoxifen to 10- to 12-wk-old male littermates via sc implantation of a slow-release pellet. After 3 wk, efficient deletion of Foxa1 and Foxa2 in β-cells of Foxa1loxP/loxP;Foxa2loxP/loxP;Pdx1CreERT2 mice was confirmed by immunohistochemistry using an antibody recognizing both factors (Fig. 1, A and B). No deletion occurred in non-β-cells throughout the pancreatic endocrine and exocrine compartments (Fig. 1B).
Figure 1.
Compound ablation of Foxa1 and Foxa2 in mature β-cells causes severe hypoglycemia. A and B, Immunohischemical staining for Foxa1/2 in control and double-mutant mouse pancreas. C, Adult Foxa1loxP/loxP;Pdx1Cre mice are euglycemic compared with control littermates. D, Double-mutant mice show significantly lower blood glucose levels compared with control and Foxa2-deficient mice. *, P < 0.05; #, P < 0.01. E, Adult Foxa1loxP/loxP;Pdx1Cre mice exhibit normal glucose tolerance compared with control littermates. F, Double-mutant mice demonstrate significantly augmented glucose tolerance compared with control and Foxa2-deficient mice. Error bars indicate sem.
In contrast to pancreas-specific Foxa1 knockout Foxa1loxP/loxP;Pdx1Cre mice, which are euglycemic throughout their neonatal (8) and adult stages (Fig. 1C), compound- mutant mice are significantly hypoglycemic under both fed and fasted conditions compared with their control littermates (P < 0.01; Fig. 1D). In glucose tolerance tests, compound-mutant mice exhibited overall lower blood glucose levels (P < 0.01; Fig. 1F), whereas Foxa1loxP/loxP;Pdx1Cre mice demonstrated normal glucose clearance (Fig. 1E), indicating that Foxa2 compensates for the loss of Foxa1. Thus, we focused our subsequent studies on compound-mutant and Foxa2loxP/loxP;Pdx1CreERT2 mice.
The hypoglycemic phenotype observed in compound-mutant mice is similar to what has been reported for Foxa2loxP/loxP;Pdx1CreERT2 mice (14). However, when we compared the glucose levels between compound-mutant and Foxa2loxP/loxP;Pdx1CreERT2 mice, we found that glucose levels were even more severely affected in compound-mutant mice (P < 0.05; Fig. 1, D and F).
Impaired glucose-stimulated insulin secretion and intracellular calcium response
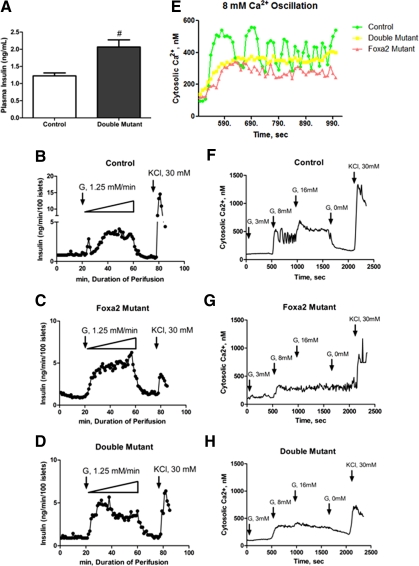
Measurement of plasma insulin levels revealed a 1.6-fold increase in compound-mutant mice compared with control littermates (P < 0.01; Fig. 2A), reminiscent of a nearly 2-fold increase of plasma insulin levels that had been previously observed in Foxa2-deficient mice (14). To examine the dynamic response of glucose-stimulated insulin secretion in compound-mutant mice, we performed in vitro islet perifusion assays. Islets were perifused with a 0–50 mm glucose ramp, increasing at a rate of 1.25 mm/min. Control islets produced a rapid and sharp first-phase insulin secretion in response to the glucose stimulation at 5–10 mm (Fig. 2B). The initial insulin-secretory response in compound-mutant islets was elicited by 3.75 mm glucose, a lower concentration than that of control islets, suggesting a decreased glucose response threshold in mutant islets (Fig. 2D). In contrast to control islets, compound-mutant islets failed to produce a distinct peak indicative of first-phase secretion, but instead exhibited a hypersecretory activity similar to that of Foxa2-deficient islets (Fig. 2, C and D). During the time window that corresponded to first-phase insulin secretion in control islets (23–27 min) the total insulin output from Foxa2-deficient and compound-mutant islets was 1.73-fold and 1.82-fold more than that of controls, respectively, with an average insulin secretion of 1.70 ± 0.35 ng/min, 2.94 ± 0.33 ng/min, and 3.10 ± 0.36 ng/min from control, Foxa2-deficient, and compound-mutant islets, respectively (Fig. 2, B–D). During second-phase insulin secretion, compound-mutant islets produced 1.32-fold more insulin than control islets. These perifusion results confirmed the observed hyperinsulinemia in compound-mutant mice (Fig. 2A).
Figure 2.
Hyperinsulinemia and severely impaired Ca2+ oscillation in compound-mutant mice. A, Double-mutant mice are hyperinsulinemic. B–D, Control, Foxa2-deficient, and compound-mutant islets were perifused by a glucose ramp (0–50 mm) flowing at a rate of 1.25 mm/min, followed by 20 min Krebs buffer wash and a final 30 mm KCl stimulation. E, Control islets treated with 8 mm glucose show strong Ca2+ oscillation. Foxa2-deficient islets show irregular Ca2+ modulations. Compound-mutant β-cells show completely abrogated Ca2+ oscillation. F–H, Cytosolic Ca2+ imaging was performed on control, Foxa2-deficient, and compound single islet, treated with 3 mm, 8 mm, and 16 mm glucose in Krebs buffer at indicated times. KCl (30 mm) was used in the end to elicit the maximal response. Representative profiles were shown from multiple experiments.
To examine the intracellular signaling that controls insulin granule exocytosis, we performed cytosolic Ca2+ imaging on tamoxifen-treated control and compound-mutant islets at 3 mm, 8 mm, and 16 mm glucose levels. Although control and compound-mutant islets showed similar basal Ca2+ concentration at 3 mm glucose (Fig. 2, F–H), the strong Ca2+ oscillation in control islets at 308–557 nm, elicited by 8 mm glucose, was absent from Foxa2-deficient and compound-mutant islets (Fig. 2E). Although Foxa2-deficient islets still retained some irregular vibration of Ca2+ concentration between 250 and 342 nm, compound-deficient islets exhibit nearly constant Ca2+ levels of 328–379 nm, indicating a severe abrogation of Ca2+ cycling (Fig. 2E). The average Ca2+ concentration in control, Foxa2-deficient, and compound-mutant islets during 8 mm glucose treatment was 405 nm, 271 nm, and 340 nm, respectively. In contrast to control islets, which responded to 16 mm glucose stimulation by oscillating cytosolic Ca2+ to an elevated peak level of 698 nm, Foxa2-deficient and compound-mutant islets increased their average Ca2+ concentration only slightly, to 293 nm and 363 nm, respectively. After glucose withdrawal, Ca2+ concentration in mutant islets failed to return rapidly toward baseline as illustrated by control islets (Fig. 2, F–H), suggesting a termination defect.
Although Ca2+ oscillation was impaired in both Foxa2-deficient and compound-mutant islets, compound-mutant islets exhibited an overall higher Ca2+ level than Foxa2-deficient islets during 8 mm and 16 mm glucose treatment (Fig. 2, G and H). This elevated Ca2+ level may mobilize more insulin granules and possibly lead to additional molecular changes, giving rise to the hypoglycemic phenotype observed in the compound-mutant animals.
Reduced endocrine but increased neuronal gene expression in compound mutants
To investigate the molecular pathways underlying this abnormal glucose homeostatic phenotype, we performed a gene expression microarray analysis using four pairs of purity-matched control and compound-mutant islet RNA samples. This revealed 566 differentially expressed genes with at least 1.5-fold change at a false discovery rate of less than 5%. Among these genes, 294 were down-regulated, and 272 were up-regulated in compound-mutant islets. Gene functional category analysis using the National Institutes of Health DAVID bioinformatics web engine revealed that a large number of genes involved in carbohydrate, lipid, and amino acid metabolic processes were severely affected in compound-mutant islets with significant enrichment scores (P < 0.01; Table 1). In addition, genes that participate in the transport functions in β-cells, especially ion transport, were severely disregulated (P < 0.001; Table 1). The gene with the largest fold change was insulin receptor-related receptor (Insrr), which was decreased 29.4-fold in compound-mutant islets (Fig. 3 and Supplemental Table 1 published on The Endocrine Society’s Journals Online web site at http://mend. endojournals.org). Additional significantly reduced genes include various transporters, among them several potassium transporter genes (Slc14a2, Slco1a6, Slc35d3, Kcnh1, Kcnk16, Kcnj12) and β-cell-enriched enzymes (Hadh, Akr1c14, Ddc, Adh1), as well as other islet-enriched genes (Mlxipl, Ica1l, Ttr) (Fig. 3 and Supplemental Table 1).
Table 1.
Metabolic and transport genes are significantly reduced in compound mutant and β-cells
| No. of genes | Benjamini P value | |
|---|---|---|
| Metabolism | ||
| Lipid metabolism | 42 | 2.4E-4 |
| Carbohydrate metabolism | 33 | 2.1E-3 |
| Amino acid metabolism | 21 | 2.1E-3 |
| Transport | ||
| Ion transport | 97 | 6.4E-4 |
| General transport | 69 | 1.1E-3 |
| Cation transport | 139 | 2.2E-2 |
Figure 3.
Decreased β-cell but increased neuronal gene expression in compound-mutant β-cells. Genes with the greatest fold of reduction (−29.4-fold) are listed at the top, whereas genes with the greatest fold of induction (+19.5-fold) are at the bottom. The heat bar on the left indicates DM/CT ratio of individual gene’s expression level in double-mutant (DM) over the level in control (CT) islets. Fold changes are indicated in color-coded boxes next to the corresponding genes.
In contrast to decreased expression of metabolic and transporter genes, functional category analysis revealed a significant enrichment of genes involved in neuronal cell differentiation and function. In fact, up-regulated genes with the highest fold change were almost exclusively related to neuronal cell development or function. Tacr3, encoding a receptor for neurokinin-3, which plays a crucial role in the reactivity to dopaminergic stimuli (15) and functional modulation of neuronal glutamate receptors (16), was increased 19.5-fold in compound-mutant islets (Fig. 3). Other highly increased genes included Dcx, an early neuronal fate marker (17), Nptx2, a secreted neuronal synaptic protein (18), Grin3a, an ubiquitously expressed glutamate receptor in the developing central nervous system (19), Slc6a15, a neurotransmitter transporter (20), and several important regulators of neuronal progenitor cell proliferation and migration (Dct, Ust, Astn1) (Refs. 21,22,23 and Fig. 3).
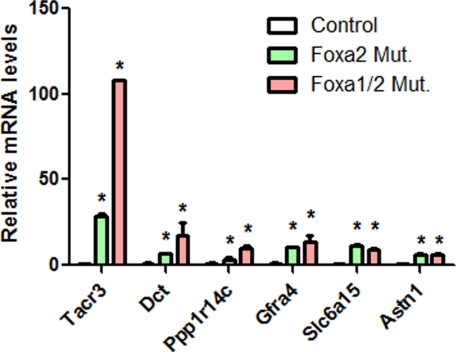
Because some neuronal genes mentioned above were not present on the PancChip microarray platform used in our previous Foxa2loxP/loxP;Pdx1CreERT2 study (14), we next performed quantitative RT-PCR analysis to determine the mRNA levels in Foxa2-deficient islets. Quantitative PCR confirmed the significant up-regulation of a number of neuronal genes in compound-mutant islets (Fig. 4). In contrast to control islets that only express these neuronal genes at a level below or near detection limit, Foxa2-deficient islets show significant elevation of these genes (Fig. 4). Compared with Foxa2-deficient islets, the expression levels of Tacr3, Dct, Ppp1r14c, and Gfra4 are further elevated in compound-mutant islets (Fig. 4), suggesting that Foxa1 and Foxa2 corepress these neuronal genes in normal β-cells.
Figure 4.
Quantitative RT-PCR confirms up-regulation of neuronal genes. Compound-mutant and Foxa2-deficient islets show significant up-regulation of a number of neuronal genes. *, P < 0.05. Mut., Mutant.
Regulation of ChREBP by Foxa1 and Foxa2 is glucose independent
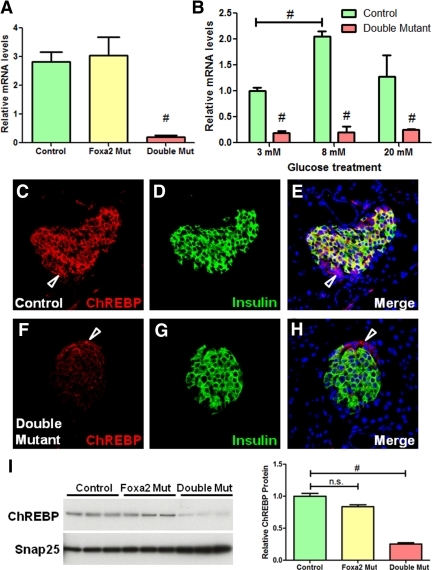
Because compound-mutant mice demonstrated severe abnormalities in glucose homeostasis, and Mlxipl (called ChREBP hereafter) is a master regulator of carbohydrate metabolism in several metabolic tissues (24,25,26,27), the significant (13-fold) decrease in its expression level in compound-mutant islets was intriguing. Quantitative PCR confirmed the significant reduction of ChREBP transcriptional levels in compound-mutant islets but demonstrated normal expression level of ChREBP in Foxa2-deficient islets (Fig. 5A). Because ChREBP transcription is dependent on glucose levels (28), we measured ChREBP mRNA levels in isolated islets after overnight incubation in media containing 3 mm, 8 mm, and 20 mm glucose. In contrast to control islets, which demonstrated a nearly 2-fold increase in ChREBP mRNA levels after 8 mm glucose treatment, compound-mutant islets failed to promote its expression in response to high glucose stimulation (Fig. 5B), indicating that the reduced expression was not related to the blood glucose levels in the mutant animals.
Figure 5.
ChREBP expression is dependent on Foxa1 and Foxa2 in β-cells. A, Quantitative RT-PCR confirmed a significant reduction of ChREBP expression in compound-mutant islets, but not in Foxa2-deficient islets. B, Glucose treatment failed to increase ChREBP expression in compound-mutant islets. C–H, Confocal fluorescent analysis for ChREBP (red) and insulin (green) in control and compound mutant pancreata. Note that ChREBP is also expressed in insulin-negative cells indicated by arrows in C, E, F, and H. Nuclei were counterstained by 4′,6-diamidino-2-phenylindole. I, Western blots show significant reduction of ChREBP protein levels in compound-mutant islets. #, P < 0.01. Mut, Mutant; n.s., not significant.
Confocal immunofluorescent staining for ChREBP and insulin demonstrated that ChREBP expression in compound-mutant β-cells was clearly reduced compared with control β-cells (Fig. 5). However, normal ChREBP expression was maintained in both Foxa1-deficient and Foxa2-deficient pancreatic islets (Supplemental Fig. 1), suggesting that Foxa1 and Foxa2 redundantly regulate ChREBP expression in islets. We found that a large proportion of ChREBP protein was located in the cytoplasm of β-cells in both fed and fasted mice. This predominantly cytoplasmic localization pattern of ChREBP was consistent with previous reports demonstrating that ChREBP shuttles between the nucleus and cytoplasm (24). We observed similar staining patterns in wild-type mouse liver sections (Supplemental Fig. 2). ChREBP levels were not affected in islet non-β-cells (Fig. 5, D and F), because these cells continue to express Foxa1 and Foxa2 (Fig. 1B). Western blot analysis using islet lysates confirmed the significant reduction of ChREBP protein levels in compound-mutant islets (P < 0.01), but not in Foxa2-deficient islets (Fig. 5I).
Foxa1 and Foxa2 regulate ChREBP expression during pancreas development
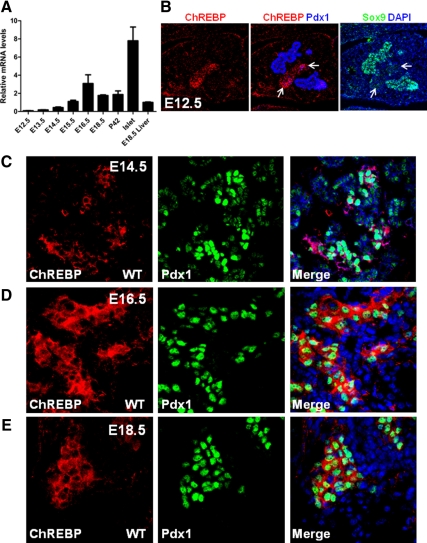
We have previously documented that Foxa1 and Foxa2 control Pdx1 expression by dynamic occupancy of several crucial enhancer regions. Such regulation plays an important role in the differentiation of endocrine and exocrine pancreas during embryogenesis. Due to the importance of ChREBP in metabolic regulation and the lack of understanding about how this factor is controlled during early pancreas development, we decided to perform a systemic analysis on its developmental expression and regulation. Quantitative RT-PCR indicated that transcript levels of ChREBP become elevated around embryonic d 13.5 (E13.5)–E14.5 and reach their peak at E16.5 (Fig. 6A), at which point endocrine pancreatic cells have already initiated significant proliferation and expansion. ChREBP levels in total pancreatic tissues are maintained at a constant level from late gestation stages to adulthood (Fig. 6A). Consistent with the immunostaining pattern in the adult pancreas (Fig. 5C), ChREBP expression was enriched in endocrine tissue, where its mRNA level was even higher than in liver (Fig. 6A).
Figure 6.
ChREBP expression in the developing embryonic pancreas. A, Relative ChREBP mRNA levels in early developing pancreas and adult pancreatic islets. Liver RNA was used as a reference. B, ChREBP (red), Pdx1 (blue), and Sox9 (green) were costained in E12.5 pancreas. Arrows point to differentiated pancreatic cells that show reduced Sox9 expression. C–E, ChREBP (red) and Pdx1 (green) were stained in E14.5, E16.5, and E18.5 wild-type (WT) fetal pancreases. DAPI, 4′,6-diamidino-2-phenylindole.
Confocal immunofluorescent analysis for ChREBP on embryonic pancreas showed weak expression in E12.5 differentiating pancreatic cells, which also show reduced Sox9 levels (29) (Fig. 6B). Costaining of ChREBP with insulin and glucagon at this stage revealed that its expression is localized to early endocrine cells (Supplemental Fig. 3). Consistent with its mRNA expression levels (Fig. 6A), higher levels of ChREBP were detected by immunostaining in late-gestation embryos (Fig. 6, C–E). Clusters of ChREBP+ cells in E14.5 pancreas had higher Pdx1 expression than ChREBP− cells, suggesting that these cells are likely nascent β-cells (Fig. 6C). From E16.5 to E18.5, ChREBP expression becomes almost exclusively colocalized to Pdx1-expressing cells that are committed to the islet cell fate (Fig. 6, D and E).
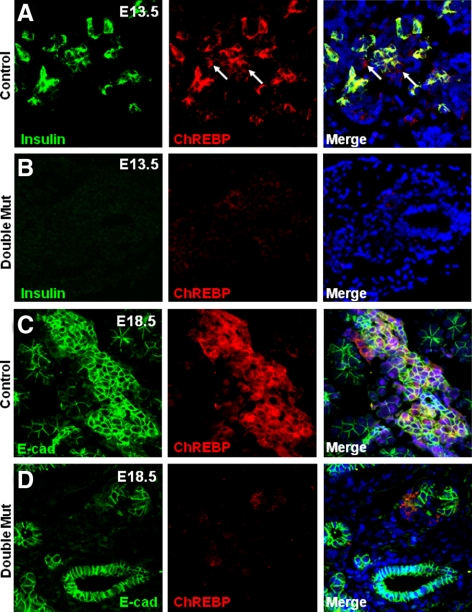
To determine whether Foxa1 and Foxa2 are required for ChREBP activation during early pancreas development, we analyzed ChREBP expression in control and Foxa1loxP/loxP;Foxa2loxP/loxP;Pdx1Cre pancreas at E13.5, a time point during which the endocrine progenitor cell population undergoes significant expansion. Costaining of insulin with ChREBP revealed more than 80% colocalization of insulin- and ChREBP-expressing cells (Fig. 7A). In contrast, a dramatic reduction of ChREBP-expressing cells was observed in Foxa1loxP/loxP;Foxa2loxP/loxP;Pdx1Cre pancreas (Fig. 7B). At E18.5, control ChREBP-expressing cells became clustered into nascent islet-like structures (Fig. 7C), whereas only a few ChREBP-expressing cells were found in the Foxa1loxP/loxP;Foxa2loxP/loxP; Pdx1Cre pancreatic epithelium (Fig. 7D). These data are consistent with a severe blockage of endocrine cell differentiation in these mutant pancreata (8).
Figure 7.
ChREBP expression in fetal endocrine pancreas requires Foxa1 and Foxa2. A and B, E13.5 control and Foxa1loxP/loxP;Foxa2loxP/loxP; Pdx1Cre pancreas were stained for ChREBP (red) and insulin (green). C and D, E18.5 control and Foxa1loxP/loxP;Foxa2loxP/loxP;Pdx1Cre pancreas were stained for ChREBP (red) and E-Cadherin (green). Mut, Mutant.
Foxa1 and Foxa2 directly regulate ChREBP expression
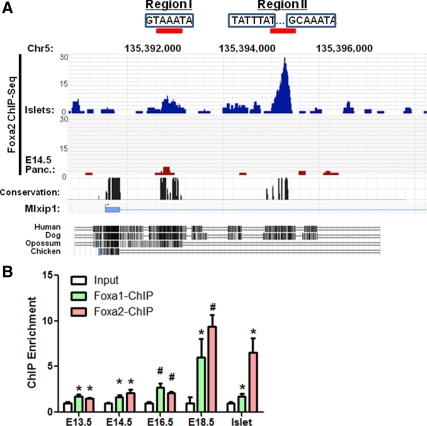
To determine whether Foxa1 and Foxa2 control ChREBP transcription directly, we performed ChIP-Seq analysis using chromatin prepared from E14.5 mouse embryonic pancreas and mature islets. We found significant binding of two evolutionarily conserved cis-regulatory regions (region I and II) located in the first intron of ChREBP gene in islet cells (Fig. 8A). The occupancy of region I by Foxa2 was also observed in E14.5 fetal pancreas, albeit with a lower enrichment value compared with islets (Fig. 8A). This lower binding intensity is consistent with the lower amount of ChREBP+ cells found in the E14.5 pancreas (Fig. 6C).
Figure 8.
ChIP-Seq identifies Foxa-regulatory regions in ChREBP. A, Foxa2 ChIP-Seq using E14.5 and islet chromatin demonstrates significant binding to two conserved regulatory regions within the first intron of ChREBP gene. Consensus Foxa-binding sites (boxed) are shown within the two regions. Strong occupancy of region II is islet enriched. B, Quantitative ChIP assays for Foxa1 and Foxa2 were performed using chromatin derived from a time course of wild-type developing pancreas and adult islets. *, P < 0.05; #, P < 0.01. Panc., Pancreas.
Consensus Foxa-binding elements were identified within both regions by searching for our recently reported Foxa2 positional weight matrix (30). Interestingly, occupancy of the distal region II by Foxa2 is specific to islet cells (not seen in liver; data not shown) and demonstrates a much stronger intensity than region I, which is shared by liver cells (data not shown). To validate Foxa2 ChIP-Seq results and determine the chromatin occupancy by Foxa1, we performed quantitative Foxa1 and Foxa2 chromatin immunoprecipitation (ChIP) assays on a time course of pancreas development. Both Foxa1 and Foxa2 significantly bind region II from E13.5d onward, with their binding intensities increased during late gestation (Fig. 8B), suggesting that increased binding of Foxa1 and Foxa2 to this regulatory region promotes ChREBP transcription during islet maturation (Fig. 6A). In adult islets, Foxa2 binds to the ChREBP enhancer with stronger intensity than Foxa1 (Fig. 8B).
Discussion
Our study delineates the redundant roles of Foxa1 and Foxa2 in the regulation of mature β-cell function. Compound Foxa1 and Foxa2 mutant mice demonstrate more pronounced hypoglycemic and insulin-secretory abnormalities than Foxa2-deficient mice. This increased severity is supported, at the gene expression level, by a global reduction of β-cell-enriched factors involved in metabolism, transport, and secretory functions. A group of genes the expression of which was altered to a small degree in Foxa2-deficient β cells became more significantly affected in compound-mutant mice. For instance, Hydroxyacyl-coenzyme A dehydrogenase (Hadh, or Schad), which was reduced 2.4-fold in Foxa2-deficient β-cells, became down-regulated by 5.4-fold in compound-mutant β cells. This gene encodes a mitochondrial fatty acid oxidation enzyme, and its mutation has been implicated in familial hyperinsulinemic hypoglycemia in infants (31,32,33). In addition, Dopa decarboxylase (Ddc) was decreased 1.9-fold in Foxa2-deficient β-cells whereas it was reduced 5.1-fold in compound-mutant β-cells. The transcriptional regulation of these genes thus appears to be controlled in a Foxa dosage-dependent fashion. In contrast to these genes, a large portion of genes that were affected in compound-mutant β-cells seem to be resilient to the loss of either of these two factors, because their activity was not changed in either solely Foxa1- or Foxa2-deficient models (14,34). These genes include crucial metabolic and transport genes, e.g. ChREBP and several potassium channels. The transcriptional control of these genes may be more critical for the fundamental aspects of β-cell function; thus their expression is regulated by both factors in a redundant fashion.
ChREBP has been shown to be essential for the induction of glucose-regulated genes in the liver (24). Recent studies suggest that this factor regulates multiple glucose-responsive genes in β-cells as well (27,35,36). We demonstrate that ChREBP expression initiates in early differentiated endocrine cells and becomes highly enriched in mature islet cells, with expression levels exceeding those seen in the liver. The observation that ChREBP expression in fetal pancreas is predominantly detected in cells with high levels of nuclear Pdx1 suggests that ChREBP may be regulated by Pdx1 as well and is also consistent with our previous finding that Pdx1 itself is dynamically controlled by Foxa1 and Foxa2 in early pancreas development (8). Using ChIP analysis we further identified two conserved Foxa-regulatory regions within the ChREBP gene. These data establish a transcription factor cascade that facilitates islet or β-cell metabolic function during progressive cell differentiation and maturation. Most interestingly, global ablation of ChREBP in leptin-deficient (ob/ob) mice significantly lowers the blood glucose levels in these animals with drastically improved glucose tolerance (37). Because our compound-mutant mice, with significantly reduced ChREBP in the β-cells, demonstrate a significantly increased glucose tolerance, it will be interesting to determine the glucose-stimulated insulin-secretory capacity of ChREBP−/− islets in the future.
Our study identified a previously unknown function of Foxa1 and Foxa2 in repressing neuronal gene expression in mature β-cells. Given that fetal and mature β-cells share a number of transcription factors that are expressed by neural progenitor cells, including Ngn, Pax, and Nkx family members, the observed plasticity of the transcriptional program in β-cells is not entirely unexpected. In the Caenorrhabitis elegans foregut, the Foxa homolog gene Pha-4 mediates transcriptional repression of ectodermal genes through a strong association with a nucleosome remodeling and histone deacetylase NuRD complex (38), suggesting that the transcriptional repressive roles of Foxa might be evolutionarily conserved. Recent studies in mammalian models have further proposed that Foxa1 may translate the epigenetic signatures, such as the distribution of histone H3 lysine 4 dimethylation, into changes of chromatin conformation, thus facilitating lineage-specific transcriptional programs (39). The neuronal genes could be epigenetically modified in β-cells through histone modifications (our unpublished data). Thus, one of the important roles of Foxa in β-cells is to functionally execute these repressive epigenetic marks so that the β-cell transcriptional program is maintained over a neuronal cell differentiation program.
In both embryonic pancreas and mature β-cells, Foxa2 appears to be a stronger regulator than Foxa1, because loss of Foxa2 alone elicits a partial phenotype of the one we describe here for the compound-mutant animals (8). Taken together, our studies demonstrate the essential roles of Foxa1 and Foxa2 in the initial development and subsequent maintenance of β-cell transcriptional.
Materials and Methods
Mice
The Foxa1loxP/loxP and Foxa2loxP/loxP mice have been described previously (7,8). Pdx1CreERT2 mice were kindly provided by D. Melton (Harvard University). All mice were maintained on a mixed 129SvEv/C57BL/6 background. Genotyping was performed by PCR using genomic DNA isolated from the toe tips of newborn mice. Adult male mice (10–12 wk of age) were used in all experiments.
To induce gene ablation, tamoxifen pellets (free base, 25 mg/pellet, 21-d release, E-361; Innovative Research of America, Sarasota, FL) were implanted sc into the mice (14). Procedures involving mice were approved by the University of Pennsylvania Institutional Animal Care and Use Committee.
Immunohistochemical analysis
Indirect immunostaining was performed using confocal microscopy (Leica Microsystems, Inc., Deerfield, IL). The primary antibodies used were guinea pig antiinsulin (1:1000 dilution; Linco Research, Inc., St. Charles, MO), rabbit anti-ChREBP (1:200; Thermo Scientific, Rockford, IL), goat anti-Foxa1/2 (1:1000; Santa Cruz Biotechnology, Inc., Santa Cruz, CA), mouse anti-Ecadherin (1:400, BD Transduction Laboratories, Inc., Lexington, KY), guinea pig or goat anti-Pdx1 antibodies (gifts from C. Wright, Vanderbilt University,), goat anti-Sox9 (1:200 Santa Cruz). Cy3-, Cy5-, or Cy2-conjugated secondary antibodies were purchased from Jackson ImmunoResearch Laboratories, Inc. (West Grove, PA).
Glucose tolerance tests and insulin assay
Animals were fasted overnight, and blood glucose levels were measured by Glucometer Elite (Bayer Corp., Pittsburgh, PA). Mice were then injected ip with 2 g of glucose (Sigma-Aldrich, St. Louis, MO) per kg of body weight. Glucose levels were measured at 15, 30, 60, 90, and 120 min after challenge. Plasma insulin concentrations were measured by ELISA (Crystal Chemical Co., Wakefield, MA) as described previously (14). The multivariate ANOVA test was used for the statistical analysis of data derived from the glucose tolerance tests.
Islet perifusion and Ca2+ imaging
Islets were isolated from mutant and control mice using standard collagenase digestion followed by purification through a Ficoll gradient (14). Islets (n = 100) were hand picked under a light microscope and placed into a perifusion chamber (Millipore Corp., Milford, MA). A computer-controlled fast-performance HPLC system (625 LC System, Waters Corp., Milford, MA) allowed programmable rates of flow and concentration of the appropriate solutions held in a 37 C water bath. Islets were perifused with Krebs bicarbonate buffer [2.2 mm Ca2+, 0.25% BSA, 10 mm HEPES, and 95% O2/5% CO2 equilibration (pH 7.35)] to reach baseline hormone secretion values before the addition of the appropriate secretagogues. Samples were collected at regular intervals with a fraction collector (Waters Corp.). Insulin content was determined using a RIA (University of Pennsylvania Diabetes Center). Ca2+ measurement was performed as described previously (14,40).
Microarray and quantitative real-time PCR
Islets were isolated using standard collagenase procedure as described above. Total RNA from islets was extracted in TRIzol (Invitrogen, Carlsbad, CA) according to the manufacturer’s instructions. Islet purity was assessed so that pairs of control and mutant RNA samples with similar purity were matched (41). Four pairs of control and compound-mutant islet RNA samples were obtained. Total RNA (250 ng) was amplified and labeled with Cy3 using the Low Linear Amplification Kit (Agilent Technologies, CA). After purification, 1.65 mg of cRNA were fragmented and hybridized to the Whole Mouse Genome Oligo Microarray (G4122A; Agilent Technologies, Palo Alto, CA) array for 17 h at 65 C. The subsequent analysis has been described in full detail previously (42). Microarray data have been deposited into ArrayExpress under accession no. E-MTAB-219.
For real-time PCR, RNA was reverse transcribed using 1 μg oligo(dT) primer, SuperScript II Reverse Transcriptase, and accompanying reagents (Invitrogen). PCR mixes were assembled using Brilliant SYBR Green QPCR Master Mix (Stratagene, La Jolla, CA). Reactions were performed using the SYBR Green (with dissociation curve) program on Mx3000 Multiplex Quantitative PCR System (Stratagene). All reactions were performed in triplicate with reference dye normalization, and median cycling threshold values were used for analysis.
Gene functional annotation
Gene functional classification was performed on differentially expressed genes with fold change more than 1.5-fold. The Refseq_mRNA IDs of these genes were used for analysis by DAVID Bioinformatics resources, National Institutes of Health (43).
Western blot analysis
Islets were isolated and lysed in lysis buffer containing 50 mm Tris (pH 7.5), 150 mm NaCl, 10 mm EDTA, 0.02% NaN3, 50 mm NaF, 1 mm Na3VO4, 1% Nonidet P-40, 1 mm phenylmethylsulfonylfluoride, and protease inhibitors (Sigma). Protein lysate (10 μg) for each sample was heated at 70 C for 10 min in 4× lithium dodecyl sulfate buffer (Invitrogen) and loaded on 4%–12% SDS-PAGE (Invitrogen). Proteins were transferred to polyvinylidene difluoride membranes (Invitrogen) and detected by antibodies against ChREBP (1:1000; Thermo Scientific) and SNAP25 (1:2000; Abcam) simultaneously. Quantifications of Western results were performed using Image J (version 1.38, National Institutes of Health). Student’s t test was used for the statistical analysis.
ChIP and ChIP-Seq analyses
The complete procedures of ChIP and ChIP-Seq experiments and subsequent analysis have been described in detail elsewhere (8). PCR primers used for Foxa1 and Foxa2 ChIP assay are: ChREBP-ChP (forward): TGGTTGCTGGGATACAGACA; ChREBP-ChP (reverse): GGGTTGGGGACACTAATCCT.
Supplementary Material
Acknowledgments
We thank Ms. Karrie Brondell for helping with mouse work and Amber Riblett for editing of the manuscript.
Footnotes
This study is supported by National Institutes of Health/National Institute of Diabetes and Digestive and Kidney Diseases Grant R01 DK 55342-09 (to K.H.K.). N.G. is supported by the Juvenile Diabetes Research Foundation Fellowship 3-2007-521 and a grant from National Institutes of Health/National Institute of Diabetes and Digestive and Kidney Diseases (1K01DK085194-01).
Disclosure Summary: The authors have nothing to disclose.
First Published Online June 9, 2010
Abbreviations: ChIP, Chromatin immunoprecipitation; ChREBP, carbohydrate response element-binding protein.
References
- Friedman JR, Kaestner KH 2006 The Foxa family of transcription factors in development and metabolism. Cell Mol Life Sci 63:2317–2328 [DOI] [PMC free article] [PubMed] [Google Scholar]
- Lee CS, Friedman JR, Fulmer JT, Kaestner KH 2005 The initiation of liver development is dependent on Foxa transcription factors. Nature 435:944–947 [DOI] [PubMed] [Google Scholar]
- Lee CS, Sund NJ, Behr R, Herrera PL, Kaestner KH 2005 Foxa2 is required for the differentiation of pancreatic α-cells. Dev Biol 278:484–495 [DOI] [PubMed] [Google Scholar]
- Gao N, Ishii K, Mirosevich J, Kuwajima S, Oppenheimer SR, Roberts RL, Jiang M, Yu X, Shappell SB, Caprioli RM, Stoffel M, Hayward SW, Matusik RJ 2005 Forkhead box A1 regulates prostate ductal morphogenesis and promotes epithelial cell maturation. Development 132:3431–3443 [DOI] [PubMed] [Google Scholar]
- Kaestner KH, Katz J, Liu Y, Drucker DJ, Schütz G 1999 Inactivation of the winged helix transcription factor HNF3α affects glucose homeostasis and islet glucagon gene expression in vivo. Genes Dev 13:495–504 [DOI] [PMC free article] [PubMed] [Google Scholar]
- Lantz KA, Kaestner KH 2005 Winged-helix transcription factors and pancreatic development. Clin Sci (Lond) 108:195–204 [DOI] [PubMed] [Google Scholar]
- Sund NJ, Vatamaniuk MZ, Casey M, Ang SL, Magnuson MA, Stoffers DA, Matschinsky FM, Kaestner KH 2001 Tissue-specific deletion of Foxa2 in pancreatic β cells results in hyperinsulinemic hypoglycemia. Genes Dev 15:1706–1715 [DOI] [PMC free article] [PubMed] [Google Scholar]
- Gao N, LeLay J, Vatamaniuk MZ, Rieck S, Friedman JR, Kaestner KH 2008 Dynamic regulation of Pdx1 enhancers by Foxa1 and Foxa2 is essential for pancreas development. Genes Dev 22:3435–3448 [DOI] [PMC free article] [PubMed] [Google Scholar]
- Li Z, White P, Tuteja G, Rubins N, Sackett S, Kaestner KH 2009 Foxa1 and Foxa2 regulate bile duct development in mice. J Clin Invest 119:1537–1545 [DOI] [PMC free article] [PubMed] [Google Scholar]
- Ye DZ, Kaestner KH 2009 Foxa1 and Foxa2 control the differentiation of goblet and enteroendocrine L- and D-cells in mice. Gastroenterology 137:2052–2062 [DOI] [PMC free article] [PubMed] [Google Scholar]
- Lin W, Metzakopian E, Mavromatakis YE, Gao N, Balaskas N, Sasaki H, Briscoe J, Whitsett JA, Goulding M, Kaestner KH, Ang SL 2009 Foxa1 and Foxa2 function both upstream of and cooperatively with Lmx1a and Lmx1b in a feedforward loop promoting mesodiencephalic dopaminergic neuron development. Dev Biol 333:386–396 [DOI] [PubMed] [Google Scholar]
- Ang SL 2009 Foxa1 and Foxa2 transcription factors regulate differentiation of midbrain dopaminergic neurons. Adv Exp Med Biol 651:58–65 [DOI] [PubMed] [Google Scholar]
- Ferri AL, Lin W, Mavromatakis YE, Wang JC, Sasaki H, Whitsett JA, Ang SL 2007 Foxa1 and Foxa2 regulate multiple phases of midbrain dopaminergic neuron development in a dosage-dependent manner. Development 134:2761–2769 [DOI] [PubMed] [Google Scholar]
- Gao N, White P, Doliba N, Golson ML, Matschinsky FM, Kaestner KH 2007 Foxa2 controls vesicle docking and insulin secretion in mature β cells. Cell Metab 6:267–279 [DOI] [PubMed] [Google Scholar]
- Nordquist RE, Savignac H, Pauly-Evers M, Walker G, Knoflach F, Borroni E, Glaentzlin P, Bohrmann B, Messer J, Ozmen L, Albientz A, Spooren W 2008 Characterization of behavioral response to amphetamine, tyrosine hydroxylase levels, and dopamine receptor levels in neurokinin 3 receptor knockout mice. Behav Pharmacol 19:518–529 [DOI] [PubMed] [Google Scholar]
- Wang YQ, Hu HJ, Cao R, Chen LW 2005 Differential co-localization of neurokinin-3 receptor and NMDA/AMPA receptor subunits in neurons of the substantia nigra of C57/BL mice. Brain Res 1053:207–212 [DOI] [PubMed] [Google Scholar]
- Dellarole A, Grilli M 2008 Adult dorsal root ganglia sensory neurons express the early neuronal fate marker doublecortin. J Comp Neurol 511:318–328 [DOI] [PubMed] [Google Scholar]
- Reti IM, Miskimon M, Dickson M, Petralia RS, Takamiya K, Bland R, Saini J, During MJ, Huganir RL, Baraban JM 2008 Activity-dependent secretion of neuronal activity regulated pentraxin from vasopressin neurons into the systemic circulation. Neuroscience 151:352–360 [DOI] [PMC free article] [PubMed] [Google Scholar]
- Nilsson A, Eriksson M, Muly EC, Akesson E, Samuelsson EB, Bogdanovic N, Benedikz E, Sundström E 2007 Analysis of NR3A receptor subunits in human native NMDA receptors. Brain Res 1186:102–112 [DOI] [PubMed] [Google Scholar]
- Drgonova J, Liu QR, Hall FS, Krieger RM, Uhl GR 2007 Deletion of v7–3 (SLC6A15) transporter allows assessment of its roles in synaptosomal proline uptake, leucine uptake and behaviors. Brain Res 1183:10–20 [DOI] [PMC free article] [PubMed] [Google Scholar]
- Jiao Z, Zhang ZG, Hornyak TJ, Hozeska A, Zhang RL, Wang Y, Wang L, Roberts C, Strickland FM, Chopp M 2006 Dopachrome tautomerase (Dct) regulates neural progenitor cell proliferation. Dev Biol 296:396–408 [DOI] [PubMed] [Google Scholar]
- Adams NC, Tomoda T, Cooper M, Dietz G, Hatten ME 2002 Mice that lack astrotactin have slowed neuronal migration. Development 129:965–972 [DOI] [PubMed] [Google Scholar]
- Ishii M, Maeda N 2008 Oversulfated chondroitin sulfate plays critical roles in the neuronal migration in the cerebral cortex. J Biol Chem 283:32610–32620 [DOI] [PubMed] [Google Scholar]
- Denechaud PD, Bossard P, Lobaccaro JM, Millatt L, Staels B, Girard J, Postic C 2008 ChREBP, but not LXRs, is required for the induction of glucose-regulated genes in mouse liver. J Clin Invest 118:956–964 [DOI] [PMC free article] [PubMed] [Google Scholar]
- Ishii S, Iizuka K, Miller BC, Uyeda K 2004 Carbohydrate response element binding protein directly promotes lipogenic enzyme gene transcription. Proc Natl Acad Sci USA 101:15597–15602 [DOI] [PMC free article] [PubMed] [Google Scholar]
- Iizuka K, Bruick RK, Liang G, Horton JD, Uyeda K 2004 Deficiency of carbohydrate response element-binding protein (ChREBP) reduces lipogenesis as well as glycolysis. Proc Natl Acad Sci USA 101:7281–7286 [DOI] [PMC free article] [PubMed] [Google Scholar]
- Wang H, Wollheim CB 2002 ChREBP rather than USF2 regulates glucose stimulation of endogenous L-pyruvate kinase expression in insulin-secreting cells. J Biol Chem 277:32746–32752 [DOI] [PubMed] [Google Scholar]
- Dentin R, Pégorier JP, Benhamed F, Foufelle F, Ferré P, Fauveau V, Magnuson MA, Girard J, Postic C 2004 Hepatic glucokinase is required for the synergistic action of ChREBP and SREBP-1c on glycolytic and lipogenic gene expression. J Biol Chem 279:20314–20326 [DOI] [PubMed] [Google Scholar]
- Seymour PA, Freude KK, Tran MN, Mayes EE, Jensen J, Kist R, Scherer G, Sander M 2007 SOX9 is required for maintenance of the pancreatic progenitor cell pool. Proc Natl Acad Sci USA 104:1865–1870 [DOI] [PMC free article] [PubMed] [Google Scholar]
- Tuteja G, White P, Schug J, Kaestner KH 2009 Extracting transcription factor targets from ChIP-Seq data. Nucleic Acids Res 37:e113 [DOI] [PMC free article] [PubMed] [Google Scholar]
- Clayton PT, Eaton S, Aynsley-Green A, Edginton M, Hussain K, Krywawych S, Datta V, Malingre HE, Berger R, van den Berg IE 2001 Hyperinsulinism in short-chain L-3-hydroxyacyl-CoA dehydrogenase deficiency reveals the importance of β-oxidation in insulin secretion. J Clin Invest 108:457–465 [DOI] [PMC free article] [PubMed] [Google Scholar]
- Hardy OT, Hohmeier HE, Becker TC, Manduchi E, Doliba NM, Gupta RK, White P, Stoeckert Jr CJ, Matschinsky FM, Newgard CB, Kaestner KH 2007 Functional genomics of the β-cell: short-chain 3-hydroxyacyl-coenzyme A dehydrogenase regulates insulin secretion independent of K+ currents. Mol Endocrinol 21:765–773 [DOI] [PubMed] [Google Scholar]
- Molven A, Matre GE, Duran M, Wanders RJ, Rishaug U, Njølstad PR, Jellum E, Søvik O 2004 Familial hyperinsulinemic hypoglycemia caused by a defect in the SCHAD enzyme of mitochondrial fatty acid oxidation. Diabetes 53:221–227 [DOI] [PubMed] [Google Scholar]
- Vatamaniuk MZ, Gupta RK, Lantz KA, Doliba NM, Matschinsky FM, Kaestner KH 2006 Foxa1-deficient mice exhibit impaired insulin secretion due to uncoupled oxidative phosphorylation. Diabetes 55:2730–2736 [DOI] [PubMed] [Google Scholar]
- Noordeen NA, Khera TK, Sun G, Longbottom ER, Pullen TJ, da Silva Xavier G, Rutter GA, Leclerc I 2010 ChREBP is a negative regulator of ARNT/HIF-1β gene expression in pancreatic islet β-cells. Diabetes 59:153–160 [DOI] [PMC free article] [PubMed] [Google Scholar]
- da Silva Xavier G, Rutter GA, Diraison F, Andreolas C, Leclerc I 2006 ChREBP binding to fatty acid synthase and L-type pyruvate kinase genes is stimulated by glucose in pancreatic β-cells. J Lipid Res 47:2482–2491 [DOI] [PubMed] [Google Scholar]
- Iizuka K, Miller B, Uyeda K 2006 Deficiency of carbohydrate-activated transcription factor ChREBP prevents obesity and improves plasma glucose control in leptin-deficient (ob/ob) mice. Am J Physiol Endocrinol Metab 291:E358–E364 [DOI] [PubMed] [Google Scholar]
- Kiefer JC, Smith PA, Mango SE 2007 PHA-4/FoxA cooperates with TAM-1/TRIM to regulate cell fate restriction in the C. elegans foregut. Dev Biol 303:611–624 [DOI] [PMC free article] [PubMed] [Google Scholar]
- Lupien M, Eeckhoute J, Meyer CA, Wang Q, Zhang Y, Li W, Carroll JS, Liu XS, Brown M 2008 FoxA1 translates epigenetic signatures into enhancer-driven lineage-specific transcription. Cell 132:958–970 [DOI] [PMC free article] [PubMed] [Google Scholar]
- Doliba NM, Qin W, Vatamaniuk MZ, Buettger CW, Collins HW, Magnuson MA, Kaestner KH, Wilson DF, Carr RD, Matschinsky FM 2006 Cholinergic regulation of fuel-induced hormone secretion and respiration of SUR1−/− mouse islets. Am J Physiol Endocrinol Metab 291:E525–E535 [DOI] [PubMed] [Google Scholar]
- Lantz KA, Vatamaniuk MZ, Brestelli JE, Friedman JR, Matschinsky FM, Kaestner KH 2004 Foxa2 regulates multiple pathways of insulin secretion. J Clin Invest 114:512–520 [DOI] [PMC free article] [PubMed] [Google Scholar]
- Gao N, White P, Kaestner KH 2009 Establishment of intestinal identity and epithelial-mesenchymal signaling by Cdx2. Dev Cell 16:588–599 [DOI] [PMC free article] [PubMed] [Google Scholar]
- Dennis Jr G, Sherman BT, Hosack DA, Yang J, Gao W, Lane HC, Lempicki RA 2003 DAVID: database for annotation, visualization, and integrated discovery. Genome Biol 4:P3 [PubMed] [Google Scholar]
Associated Data
This section collects any data citations, data availability statements, or supplementary materials included in this article.


