Abstract
SPARC (secreted protein acidic and rich in cysteine) is expressed in all grades of astrocytoma, including glioblastoma (GBM). SPARC suppresses glioma growth but promotes migration and invasion by mediating integrin and growth factor receptor-regulated kinases and their downstream effectors. PTEN (phosphatase and tensin homolog deleted on chromosome 10), which is commonly lost in primary GBMs, negatively regulates proliferation and migration by inhibiting some of the same SPARC-mediated signaling pathways. This study determined whether PTEN reconstitution in PTEN-mutant, SPARC-expressing U87MG cells could further suppress proliferation and tumor growth but inhibit migration and invasion in SPARC-expressing cells in vitro and in vivo, and thereby prolong survival in animals with xenograft tumors. In vitro, PTEN reduced proliferation and migration in both SPARC-expressing and control cells, with a greater suppression in SPARC-expressing cells. PTEN reconstitution suppressed AKT activation in SPARC-expressing and control cells but suppressed the SHC-RAF-ERK signaling pathway only in SPARC-expressing cells. Importantly, coexpression of SPARC and PTEN resulted in the smallest, least proliferative tumors with reduced invasive capacity and longer animal survival. Furthermore, direct inhibition of the AKT and SHC-RAF-ERK signaling pathways suppressed the proliferation and migration of SPARC-expressing cells in vitro. These findings demonstrate that PTEN reconstitution or inhibition of signaling pathways that are activated by the loss of PTEN provide potential therapeutic strategies to inhibit SPARC-induced invasion while enhancing the negative effect of SPARC on tumor growth.
Keywords: glioma, migration and invasion, proliferation and growth, PTEN, SPARC
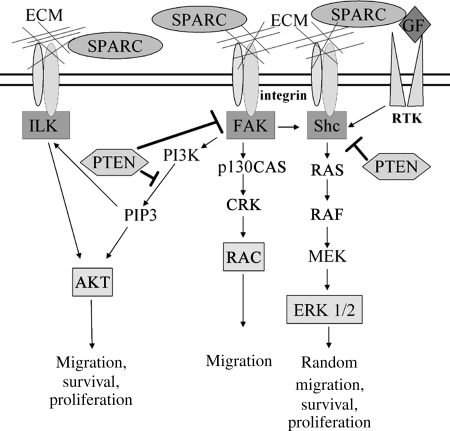
Glioblastoma (GBM) is the most common primary brain tumor in adults, and individuals with this aggressive tumor often survive 12 months or less.1 This poor prognosis is largely due to the highly infiltrative nature of GBM. Our laboratory has found that secreted protein acidic and rich in cysteine (SPARC/osteonectin/basement membrane protein-40) is highly expressed in all grades of astrocytoma, including GBM.2 In addition, we have shown that SPARC promotes glioma cell motility and invasion both in vitro3,4 and in vivo.5 Our laboratory and others have shown that high levels of SPARC correlate with increased expression of specific matrix metalloproteinases, which may be 1 mechanism by which SPARC promotes invasion.6–10 Furthermore, SPARC has been found to interact with integrin β111,12 and activate integrin-regulated kinases including ILK and focal adhesion kinase (FAK),12–14 and signaling through these molecules may be important for glioma cell motility (Fig. 1).
Fig. 1.
Proposed SPARC-mediated signaling pathways and regulation by PTEN. We propose that SPARC activates the FAK-AKT and SHC-RAF-ERK signaling pathways by regulating ECM interactions with integrins or by directly interacting with integrin β1. SPARC may also reduce SHC signaling by interfering with growth factor interactions with tyrosine kinase receptors (RTK). PTEN suppresses migration by promoting the dephosphorylation of PIP3, FAK, and SHC, which inhibits downstream signaling in these pathways.
On the other hand, we have demonstrated that SPARC suppresses glioma cell proliferation in vitro15,16 and delays tumor growth in rat brains in vivo.5 We found that the effects of SPARC on cell growth were biphasic; low levels of SPARC arrested cells at the G2M phase of the cell cycle, whereas high levels of SPARC arrested cells in the G0/G1 phase.15 It has also been suggested that SPARC may suppress cell growth by interfering with growth factor–growth factor receptor interactions, as SPARC can bind platelet-derived growth factor (PDGF) and vascular endothelial growth factor (VEGF) and inhibit the binding of these growth factors to their tyrosine kinase receptors.17,18 Therefore, a potential therapeutic strategy to inhibit brain tumor progression could involve inhibiting the positive effect of SPARC on tumor invasion while enhancing the negative effect of SPARC on proliferation and tumor growth.
The tumor suppressor phosphatase and tensin homolog deleted on chromosome 10 (PTEN/mutated in multiple advanced cancers) is a phosphatase, which is mutated at a high frequency in multiple human cancers19,20 and plays a role in keeping the processes of cell migration and proliferation under control. Loss of PTEN is associated with primary GBM development,19,20 with estimates of up to 30%–36% of GBMs having PTEN loss/mutation.21,22 Transfection of wild-type PTEN into human glioma cells decreases tumorigenicity in nude mice, demonstrating that PTEN serves as a tumor suppressor in glioma.23 PTEN functions as a phosphatase for both lipids and proteins.24 Due to its lipid phosphatase activity, PTEN is a negative regulator of phosphatidylinositol-3-kinase (PI3K) signaling by dephosphorylating phosphatidylinositol-3-5-triphosphate (PIP3), whereas its protein phosphatase activity inhibits the activation of FAK and SHC.25,26 PTEN expression suppresses cell migration by negatively regulating FAK, SHC, and ILK signaling25–28 (Fig. 1). Furthermore, through inhibition of the PI3K-AKT pathway, PTEN suppresses glioma cell proliferation by arresting cells in the G1 phase of the cell cycle.29 As PTEN can suppress integrin-mediated signaling pathways, which have increased activation due to SPARC, the reconstitution of PTEN or the direct inhibition of signaling pathways that are negatively regulated by PTEN provide potential therapeutic approaches to inhibit SPARC-mediated brain tumor invasion and possibly further suppress brain tumor growth.
As the loss of PTEN and the overexpression of SPARC are important changes that contribute to GBM development and progression, the present study sought to determine whether the reconstitution of PTEN in invasive PTEN-mutant, SPARC-expressing GBM cells could suppress the in vitro proliferation and migration and the in vivo tumor growth and invasion of these cells, and prolong the survival of animals with xenograft tumors.
Materials and Methods
Generation of PTEN-Expressing GBM Cells
Generation and characterization of SPARC- (A2b2), empty vector control- (C2a2), SPARC-GFP- (H2), or GFP vector control- (C1.1) expressing U87MG cells was previously reported.3–6,8,15,30 The PTEN sequence was subcloned from pBP-PTEN, kindly provided by Drs. Frank Furnari and Webster Cavenee, into the pcDNA6/V5-HisB plasmid (Invitrogen) with blasticidin resistance and confirmed by DNA sequencing (Becton Coulter CEQ8000 Genetic Analysis System). PTEN-encoding pcDNA6 vector (PTEN) or pcDNA6 empty vector (EV) plasmids were transfected into the A2b2, C2a2, H2, and C1.1 cell lines by electroporation using Cell Line Nucleofector Kit T (Amaxa Biosystems) using the manufacturer's U87MG protocol with the Nucleofector 1 program X-01 (Amaxa Biosystems). Stable transfectants were selected with blasticidin (9 µg/mL) over 14 days. Clones were isolated using limiting dilution, and specific clones were selected based on SPARC and/or PTEN expression.
Cell Culture
Cells were cultured in DMEM + 10% fetal bovine serum (FBS) and 10 µg/mL gentamycin. A2b2 and C2a2 clones were grown in blasticidin (9 µg/mL) and puromycin (1 µg/mL) while the H2 and C1.1 clones were grown in blasticidin (9 µg/mL) and geneticin (400 µg/mL). Selective antibiotics were removed at least 3 days prior to use in an assay or experiment.
Cell Morphology
Cells were plated at 2 × 10⁵/100-mm dish and cultured in growth media for 5 days. Images were captured on an inverted microscope at ×10 and ×20 magnification.
Western Blot Analysis
Cells (5 × 10⁵) were plated on 50 µg/mL fibronectin-coated 100-mm dishes and grown in either DMEM + 10% FBS, serum-free DMEM, or Opti-MEM. After 24 and 48 hours, cells were lysed and the protein concentration was determined using BCA protein assay (Pierce). Equal protein/lane (15–25 mg) was loaded onto 10% polyacrylamide sodium dodecyl sulfate Tris–Glycine gels. After electrophoresis (20 mA/gel), proteins were transferred (100 volts) to PVDF membranes (Millipore). Membranes were blocked (5% nonfat dry milk) and then incubated with primary antibody overnight at 4°C, followed by incubation with HRP-conjugated secondary antibody at room temperature for 1 hour. The blots were developed using ECL (Pierce). The primary antibodies used were purchased as follows: Hematologic Technologies: SPARC (AON-5031); Cascade BioScience: PTEN (ABM-2052); BD Biosciences: pFAK (611 722) and c-RAF (610 151); Cell Signaling: FAK (3285), pAKT (4051L), AKT (9272), pSHC (2434S), and pRAF (9427S); and Santa Cruz Biotechnology: SHC (sc-967), pERK (sc-7383), ERK1 (sc-94), Actin (sc-1616), and all secondary antibodies.
Proliferation Assay
Cells (1.5 × 10³ cells/well) were seeded in triplicate in fibronectin-coated, 96-well, white-walled plates (#3610, Corning, Inc.). Separate plates were made for 0-, 3-, 5-, and 7-day timepoints. Cells were cultured in DMEM + 10% FBS for 4 hours at which time the 0 timepoint plate was read and the other timepoint plates continued to incubate for the appropriate time period. At each timepoint, the media was removed and the plate was frozen at −80°C. The media were changed on the remaining plates. At the end of the experiment, the number of viable cells was determined using the FluoReporter Blue Fluorometric dsDNA Quantitation Kit (Molecular Probes), according to the manufacturer's protocol. The fluorescent signal was read on a Fusion Universal Microplate Analyzer (PerkinElmer). The data at each timepoint were background subtracted using the reagent blank fluorescence value and then calculated as a percentage of the 0 day data. The experiment was repeated 3 times.
For the proliferation assay with inhibitors, separate plates were made for days 0, 3, and 6. The cells were cultured in DMEM + 10% FBS for 4 hours until the 0-day timepoint plate was read. At this time, the media were removed from the remaining timepoint plates and replaced with new DMEM + 10% FBS with either DMSO (1/1000), the MEK inhibitors PD98059 (50 µM; Calbiochem) or U0126 (20 µM, Cell Signaling), or the AKT inhibitor AKT IV (2.5 µM, Calbiochem). The concentration of inhibitor used was the lowest amount of inhibitor that could produce a maximal suppression of protein activation and not induce cell death.
Wound Healing Migration Assay
Cells (3.2 × 10⁵) were seeded onto fibronectin-coated (50 µg/mL) 60-mm dishes.4 Cells were grown in DMEM + 10% FBS until confluent (2 days). Wounds were made using a 19-mm razor blade to cut the cells and mark the plate, and then the blade was moved gently across the plate to remove the cell monolayer. Following 2 PBS rinses to remove cellular debris, DMEM + 10% FBS was added (plus inhibitors or DMSO control if applicable). After 20 hours, the distance the cells migrated past the wounding line was measured from images of 2 microscopic fields/wound and 4 wounds/cell-type using SPOT version 4.0.8 (Diagnostic Instruments, Inc.) software. The distances migrated were averaged from the 4 separate wounds from each of 2 independent experiments.
Brain Xenograft
Using an IACUC-approved protocol, cells were implanted into nude rat brains (NCI Frederick, NIH), as previously described5 with minor modifications. Briefly, cells (4 × 10⁵ cells/5 µL PBS) were injected 3 mm to the right of bregma at a rate of 0.5 µL/minutes. Animals were sacrificed at days 7 and 10, and when neurologic deficit occurred. The brains were fixed with 10% formalin, placed in a coronal brain matrix (Activational Systems, Inc.), and sliced into 2-mm blocks. The blocks were routinely processed, paraffin-embedded, and serially sectioned at 5 µm. Animals/group: day 7: n = 6, day 10: n = 3, and neurologic deficit: n = 3.
Immunohistochemistry
Adjacent sections were retrieved for the human mitochondrial marker, SPARC, Ki-67 (HIER with Citrate buffer pH 6.0), PTEN (rodent decloaker at 97°C for 25 minutes), and Factor VIII (0.4% pepsin for 50 minutes at 37°C). Sections were then immunohistochemically stained for human mitochondrial marker (1:100 for 60 minutes; E5204, Spring Bioscience), SPARC (1:20 000 in 0.25% BSA for 60 minutes; AON-5031, Hematologic Technologies, Inc.), Ki-67 (1:100 for 30 minutes; M7240, Dako), PTEN (1:400 for 40 minutes; CM278, Biocare Medical), or Factor VIII (1:1000 for 40 minutes; A0082, Dako) on a Nemesis 7200 stainer using BioCare reagents (Biocare Medical). Control sections were processed substituting the primary antibody with the appropriate immunoglobulin isotype. Detection was performed with streptavidin/biotin-HRP and DAB for 2 minutes and then counterstained with hematoxylin for 8 seconds. Images were captured on a Nikon Eclipse E800 microscope with a Nikon DXM1200C digital camera. Composite figures were prepared using Adobe Photoshop CS3 software.
In Vivo Analysis of Tumor Volume
Every tenth section was stained with human-specific mitochondrial marker, and the tumor was imaged at ×0.5 magnification. ImagePro 6.0 Plus (Media Cybernetics) software was used to outline the tumor and calculate the area. The area was then multiplied by the section thickness to determine the tumor volume for that section. The total tumor volume was calculated by adding the volumes for each section with averaging for the 9 intervening sections (n = 6 animals/group).
In Vivo Analysis of MIB-1 Proliferation Index
Every tenth serial section was stained with MIB-1 antibody (Dako).5 Using Photoshop 6.0 software, images (×40 magnification) were overlaid with a grid, and total and MIB-1-positive cells were counted. The MIB-1 proliferation index was calculated by dividing the number of MIB-1-positive cells by the total cell number and multiplying by 100 (n = 6 animals/group).
In Vivo Analysis of Cell Invasion
Serial sections were immunohistochemically stained for SPARC and human mitochondrial marker to assess invasion. Tumor cell invasion was examined for the following types of movement in the brain: (i) invasion into surrounding parenchyma, (ii) invasion along blood vessels, or (iii) invasion along white matter tracts.5 Animals/group: day 7: n = 6 and day 10: n = 3.
In Vivo Analysis of Vascularity
Serial sections were immunohistochemically processed for Factor VIII to assess tumor vasculature.30 For each tumor, 4 regions with the highest Factor VIII staining/section were imaged at ×40 magnification. The number of vessel lumens/image was independently counted by 2 individuals. ImagePro 6.0 Plus (Media Cybernetics) software was used to calculate the cross-sectional area of each vessel. The number of vessels, size of vessels, and overall vascular area/image were measured (n = 6 animals/group).
Statistical Analysis
Analysis of variance (ANOVA) techniques were used to assess the differences among groups and timepoints. When the assumptions for ANOVA were not met, log transformations were done to decrease the variability among the groups. The statistical testing was set at alpha equal to 0.05. All statistical data analysis was done using SAS (SAS Institute, Inc.) version 9.2.
Results
Characterization of U87MG Human GBM Cell Lines Expressing SPARC and PTEN
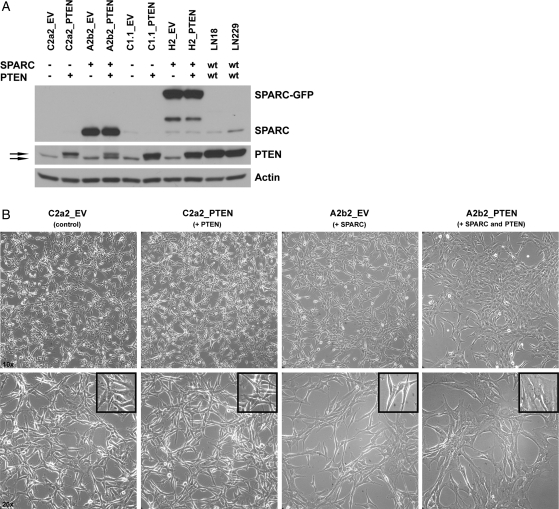
Generation and characterization of SPARC- (A2b2), empty vector control- (C2a2), SPARC-GFP- (H2), or GFP vector control- (C1.1) expressing cells has been previously reported.3–6,15,30 These U87MG-derived cell lines were transfected with a PTEN-encoding pcDNA6 vector (PTEN) or pcDNA6 empty vector (EV), and blasticidin-resistant stable clones were selected. SPARC and PTEN expression were confirmed by RT-PCR (data not shown) and Western blot analysis (Fig. 2A). The lower molecular weight PTEN band is likely the mutant form of PTEN expressed by U87MG cells, which contains a deletion that includes exon 3.19,20 Effects of gene expression on cell morphology were assessed in vitro. As previously reported, SPARC induced an elongated morphology.3,4 PTEN did not alter the morphology of control cells; however, cell morphology changes were detected when SPARC and PTEN were coexpressed (Fig. 2B). A2b2_PTEN cells lost the elongated morphology, became flattened in appearance with more cytoplasm, and grew as a monolayer. Similar changes in morphology were seen when the control and PTEN vectors were transfected into GFP- and SPARC-GFP-expressing clones (data not shown).
Fig. 2.
SPARC and PTEN expression and morphology for the generated U87MG-transfected cell lines. (A) Control (C2a2, C1.1) and SPARC-expressing (A2b2, H2) cells transfected with PTEN or EV were lysed 48 h after plating on fibronectin. Lysates (15 µg) were analyzed for PTEN and SPARC/SPARC-GFP expression by Western blot. wt, wildtype. Top arrow: transfected WT PTEN. Bottom arrow: endogenous mutant PTEN. (B) Cell morphology was assessed after equal numbers of the cells were plated for 5 days. Images were taken at ×10 (upper panels) and ×20 (lower panels) magnification. Inset shows a 1.6-fold zoomed image of cells.
PTEN Reconstitution Decreases Proliferation and Migration in SPARC-Expressing and Control GBM Cells
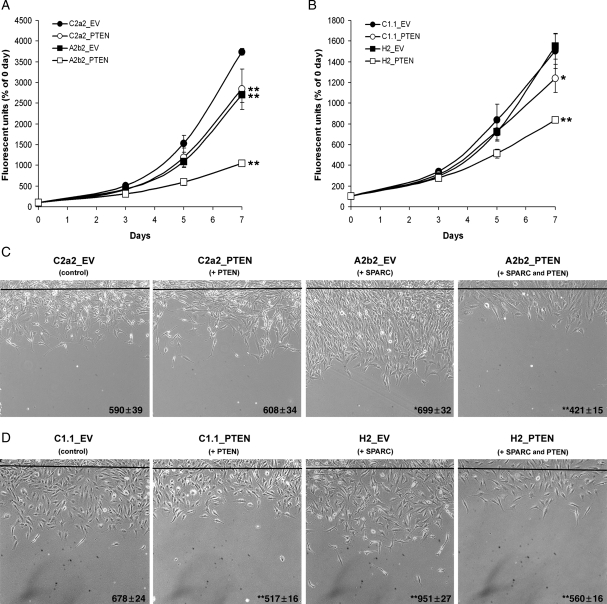
The effect of PTEN on proliferation in SPARC-expressing and control cells was assessed over 7 days (Fig. 3A and B). PTEN expression (C2a2_PTEN) or SPARC expression (A2b2_EV) significantly reduced proliferation at 3 (P < 0.01), 5 (P < 0.05) and 7 days (P < 0.001) compared with control C2a2_EV cells (Fig. 3A). PTEN and SPARC coexpression (A2b2_PTEN) significantly reduced proliferation at 3, 5, and 7 days (all: P < 0.001) and, by day 7, the effect of coexpression on proliferation was more than additive. The results for the GFP-expressing clones were similar except that SPARC-GFP-expressing cells (H2_EV) grew similar to the GFP control cells (C1.1_EV) (Fig. 3B). However, PTEN expression (C1.1_PTEN) significantly reduced proliferation at 7 days (P < 0.01), and PTEN and SPARC coexpression (H2_PTEN) significantly reduced proliferation at 5 days (P < 0.01) and 7 days (P < 0.001). By day 7, the effect of coexpression on proliferation was more than additive.
Fig. 3.
PTEN decreases proliferation and migration in SPARC-expressing and control U87MG-transfected cell lines. (A,B) Cells were plated on fibronectin and analyzed at 0, 3, 5, and 7 day timepoints for dsDNA content using a fluorescent assay. The assay was repeated 3 times and analyzed statistically. Asterisks denote significantly different from C2a2_EV or C1.1_EV where * = P < 0.01, ** = P < 0.001. (C,D) Equal numbers of cells were plated on fibronectin and wounded. The black line represents the beginning of the wound. The distance migrated past the wounding line was measured after 20 h using random microscopic fields from 4 wounds/cell type. The assay was repeated twice and analyzed statistically. The numbers represent the distance in µm ± the SEM. Asterisks denote significantly different from C2a2_EV or C1.1_EV where * = P < 0.05, ** = P < 0.001.
The effect of PTEN on migration in SPARC-expressing and control cells was assessed using the wound healing assay (Fig. 3C and D). Similar to our reported results,4,15 SPARC (A2b2_EV) and SPARC-GFP (H2_EV) expression increased migration compared with control cells at 19% (P = 0.014) and 40% (P < 0.001), respectively. No difference in migration was observed between C2a2_PTEN and C2a2_EV, whereas a significant reduction in migration was found for C1.1_PTEN compared with C1.1_EV (−24%, P < 0.001). The latter results agree with published reports that PTEN suppresses migration in U87 cells,31 and the difference between the 2 controls is likely due to the increased expression of transfected PTEN in clone C1.1_PTEN compared with C2a2_PTEN (Fig. 2A). Transfection of PTEN in both SPARC-expressing cell lines (A2b2_PTEN and H2_PTEN) resulted in a significant decrease in migration compared with control cells (−29% and −17%, respectively, P < 0.001) and to EV-transfected SPARC-expressing cells (−40% and −41%, respectively, P < 0.001).
PTEN Reconstitution Suppresses FAK, AKT, SHC, RAF, and ERK Activation in SPARC-Expressing GBM Cells
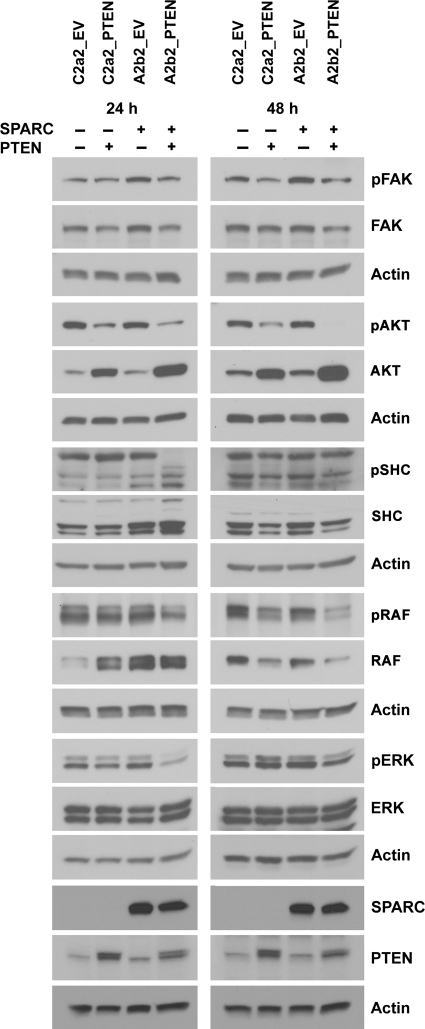
To determine whether PTEN-induced changes in proliferation and migration were mediated by changes in the FAK-AKT and SHC-RAF-ERK signaling pathways, signal transduction was assessed 24 and 48 h after plating the cells on fibronectin. By 24 h, PTEN suppressed the phosphorylation of FAK, SHC, RAF, and ERK in SPARC-expressing cells (A2b2_PTEN) but not in control (C2a2_PTEN) cells (Fig. 4). AKT activation was suppressed by PTEN in both SPARC-expressing and control cells (Fig. 4). The amount of total AKT was upregulated when PTEN was expressed in the cells, which may be a compensatory process by the cells to increase AKT signaling when the activation of AKT is strongly suppressed. Similar changes in 24-hour signaling were observed when the cells were grown in 2 different serum-free media: DMEM and Opti-MEM (data not shown). Furthermore, at 48 hours, RAF and ERK activation were still suppressed by PTEN in SPARC-expressing cells, and FAK and AKT activation were suppressed by PTEN in both SPARC-expressing and control cells (Fig. 4). In addition, similar signaling changes were seen for the GFP-expressing clones with the exception of pFAK, which was not found to be suppressed by PTEN in the clone H2_PTEN even though the amount of total FAK was reduced by PTEN (Supplementary Material, Fig. S1).
Fig. 4.
PTEN decreases FAK, AKT, SHC, RAF, and ERK activation in SPARC-expressing GBM cells. Cells were lysed 24 or 48 h after plating on fibronectin. Lysates (15–25 µg) were analyzed for phosphorylated protein, total protein, and actin (loading control) expression by Western blot.
From this data, the SHC-RAF-ERK signaling pathway appears to have increased sensitivity to PTEN reconstitution in SPARC-expressing cells, suggesting that this pathway may be important for the additional suppressive effect of PTEN on migration and proliferation in SPARC-expressing cells compared with control cells (Fig. 3A–D).
To determine whether SPARC and PTEN interact, coimmunoprecipitation was performed using antibodies to each protein. Neither protein coimmunoprecipitated the other in A2b2_PTEN cells or the glioma cell line LN229 that naturally expresses both wild-type SPARC and PTEN (Supplementary Material, Fig. S2).
PTEN Reconstitution Suppresses the In Vivo Tumor Growth and Proliferation of Both SPARC-Expressing and Control GBM Cells
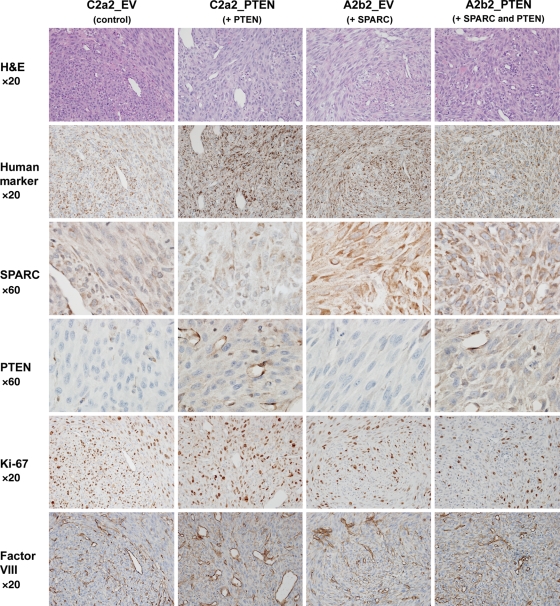
SPARC- and PTEN-expressing cells were implanted into the brains of nude rats and allowed to develop for 7 days to determine if the in vitro changes in proliferation would be seen in vivo when the cancer cells were interacting with the tumor microenvironment. Serial sections were H&E stained and evaluated for SPARC, PTEN, and Ki-67 (Fig. 5). Identification of human tumor cells in the rat brain was accomplished using an anti-human-specific mitochondrial antibody. SPARC and PTEN were expressed in the appropriate tumors. SPARC was homogeneously and highly expressed in A2b2_EV and A2b2_PTEN tumors. On the other hand, SPARC had low and localized expression in C2a2_EV and C2a2_PTEN tumors, which is due to the low level of endogenous SPARC in these cell lines and SPARC expression by host endothelial cells and other host-derived infiltrating cells. PTEN had weak staining throughout the cytoplasm of the cancer cells in C2a2_PTEN and A2b2_PTEN tumors that was visualized best at a high magnification. Strong PTEN staining was also detected in the blood vessels in all tumor types. The suppressive effects of PTEN, SPARC, or SPARC and PTEN on proliferation were visualized using MIB-1 antibody to detect Ki-67.
Fig. 5.
Characterization of intracranial xenografts of control-, PTEN-, SPARC-, and SPARC and PTEN-expressing cells lines. Cells (400 000 in 5 µL) were intracranially implanted into nude rat brains and allowed to grow for 7 days. Brains were harvested, formalin-fixed, and paraffin-embedded. Tumor xenograft sections were H&E stained and immunohistochemically stained for human mitochondrial marker, SPARC, PTEN, the proliferation marker Ki-67, and the blood vessel marker Factor VIII. Magnifications as indicated. Representative images of n = 6 animals/group.
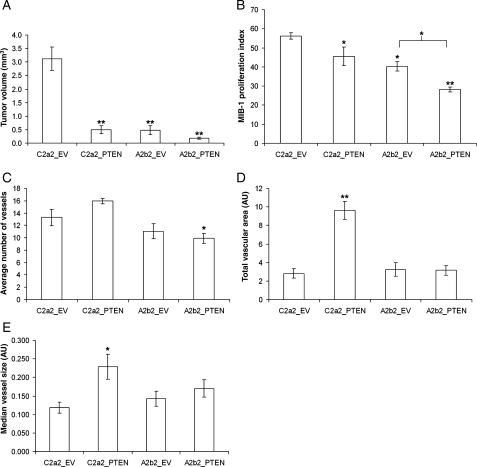
Quantitation of the tumor volumes and proliferation indices at 7 days postimplantation (Fig. 6) demonstrated that PTEN- or SPARC-expressing tumors were significantly smaller in size (6.3-fold, 6.4-fold, respectively; P < 0.001) and had significantly reduced MIB-1 proliferation indices (P < 0.05) compared with the control C2a2_EV tumors (Fig. 5; Fig. 6A and B; Fig. 7). Tumors with both SPARC and PTEN had the smallest tumor volumes (with a 17.7-fold reduction compared with control tumors; P < 0.0001) and had a significantly reduced MIB-1 proliferation index when compared with control tumors (P < 0.0001) as well as to the SPARC-expressing A2b2_EV tumors (P < 0.01) (Fig. 5; Fig. 6A and B; Fig. 7). That the suppression of proliferation was greatest when SPARC and PTEN were coexpressed demonstrates that the effects on proliferation in vitro (Fig. 3A) hold true in vivo.
Fig. 6.
PTEN suppresses the in vivo tumor growth and proliferation of both SPARC-expressing and control GBM cells and increases blood vessel size and vascular area in control but not in SPARC-expressing tumors. Intracranial xenografts were quantitated and analyzed statistically for tumor volume (A), proliferation index (B), number of blood vessels (C), total vascular area (D), and median vessel size (E). AU, arbitrary units. Asterisks denote significantly different from C2a2_EV (unless otherwise indicated) where * = P < 0.05, ** = P < 0.001, n = 6 animals/group.
Fig. 7.
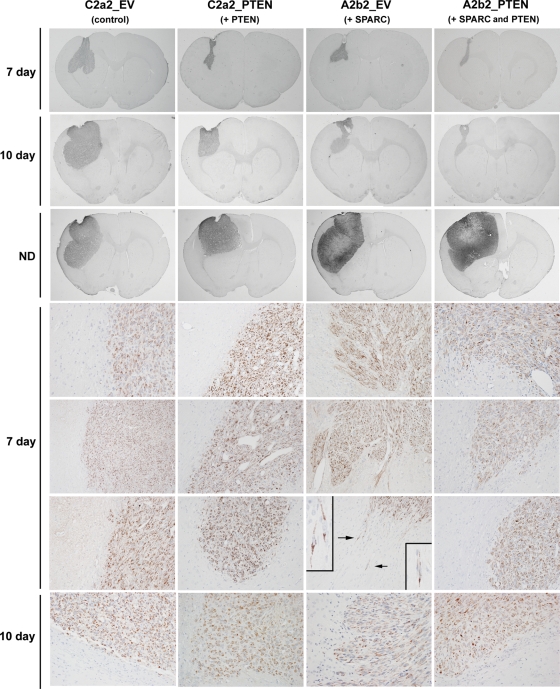
PTEN reconstitution suppresses the in vivo invasion of SPARC-expressing cells. Cells (400 000 in 5 µL) were intracranially implanted into nude rat brains and allowed to grow for 7 and 10 days, or until signs of neurological deficit. Brains were harvested, formalin-fixed, and paraffin-embedded. Tumor sections were stained for human mitochondrial marker to identify the tumor cells. Whole brain sections illustrating the largest cross sections through the tumors were captured at ×0.5 magnification. Days 7 and 10 sections were captured at ×20 magnification. Arrows indicate the single cell infiltration illustrated in the insets captured at ×60 magnification. Representative images of n = 6 (day 7) and n = 3 (day 10; ND) animals/group.
PTEN Expression Increases Tumor Blood Vessel Size and Vascular Area in Control but Not in SPARC-Expressing Tumors
To determine whether vascularity differed between tumor types and contributed to the reduction in tumor volume when SPARC and/or PTEN were expressed, serial sections were stained for Factor VIII (Fig. 5) and the vascularity was compared according to the number of vessel lumens, the vessel sizes, and the total vascular area (Fig. 6C–E). A striking finding was that PTEN expression alone (C2a2_PTEN) resulted in a significant increase in median vessel size and total vascular area even though these were not the largest or most proliferative tumors (Fig. 6A and B). It appears that SPARC was able to suppress the ability of PTEN to increase vessel size and vascular area because A2b2_PTEN tumors did not show significant changes in these measures. The A2b2_PTEN tumors did have a significant reduction in the number of vessels compared with control C2a2_EV tumors; however, there was no reduction in total vascular area possibly because there was a trend toward increased vessel size.
PTEN Reconstitution Suppresses the In Vivo Invasion of SPARC-Expressing GBM Cells
Using human-specific mitochondrial marker staining, tumors were examined 7 and 10 days after tumor implantation (Fig. 7). All tumors developed along the injection tract through the cerebral cortex into the subjacent external capsule and caudoputamen. At day 7, each group of tumors had an overall well-defined pattern of growth and invasion. By day 7, the large control (C2a2_EV) tumors extended centrifugally as broad-based nubbins in the gray matter and along the axonal bundles in the white matter. Generally, the control tumors had a broad, rather smooth border at the brain–tumor interface. The intermediate-sized C2a2_ PTEN tumors had an advancing edge that was somewhat irregular due to limited nodular growth along vessels. The SPARC- (A2b2_EV) expressing tumors had a very irregular advancing edge as a result of their long, well-defined finger-like projections of perivascular tumor growth at the brain–tumor interface. In addition, isolated tumor cells were present invading into adjacent normal tissue. The smallest SPARC- and PTEN-coexpressing tumors (A2b2_PTEN) were mostly confined to the external capsule, with only small extensions into the caudoputamen. Their invading edge was narrow and made of short perivascular projections. Although a few small masses of tumor cells were occasionally observed in brain adjacent to the tumor mass, we found no instances of isolated cells invading at a distance into the normal tissue. By day 10, the size differences across the tumors were similar to those at day 7 (Fig. 7), and the tumors retained their characteristic invasion patterns. However, if the tumors were allowed to grow until the animals demonstrated signs of neurological deficit, all tumors reached massive proportions and effaced large portions of the cerebral hemisphere. Of note, the SPARC-expressing tumors had massive regions of necrosis, as previously reported,5 and PTEN was not capable of inhibiting this.
PTEN Reconstitution Prolongs Animal Survival Time for SPARC-Expressing and Control Tumors with the Longest Survival Time when Tumors Express Both SPARC and PTEN
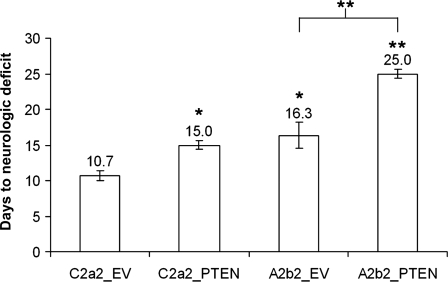
Animals with SPARC- and/or PTEN-expressing tumors lived longer than animals with control C2a2_EV tumors (P < 0.05), and animals with tumors that express both SPARC and PTEN lived longer than animals with tumors that express SPARC alone (P < 0.001) (Fig. 8).
Fig. 8.
PTEN reconstitution prolongs animal survival for SPARC-expressing and control tumors. The number of days to neurologic deficit is plotted. Asterisks denote significantly different from C2a2_EV (unless otherwise indicated) where * = P < 0.05, ** = P < 0.001.
Direct Inhibition of Signaling Pathways That Are Negatively Regulated by PTEN Suppresses Proliferation and Migration in SPARC-Expressing GBM Cells In Vitro
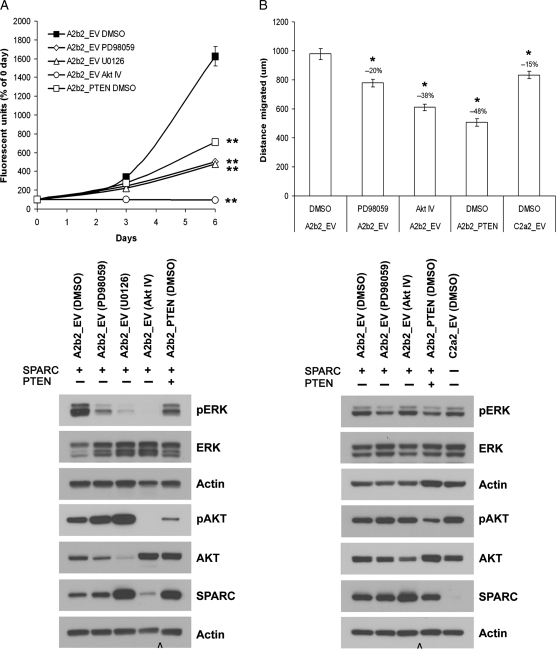
The effect of the ERK pathway inhibitors PD98059 and U0126 and the AKT pathway inhibitor AKT IV on the proliferation of SPARC-expressing A2b2_EV cells was assessed over 6 days (Fig. 9A). All 3 inhibitors reduced A2b2_EV cell proliferation (P < 0.001), with an effect that was greater than the reduction observed when PTEN was restored to the cells. Western blot analysis of the cells after 3 days with inhibitors showed that both the ERK and AKT inhibitors were effective in suppressing the activation of ERK and AKT, respectively. Interestingly, the AKT inhibitor AKT IV also suppressed the activation of ERK, which may explain why there was a complete inhibition of growth with this inhibitor. PTEN reconstitution also suppressed the activation of both ERK and AKT in this assay, as expected from results in Fig. 4. After 6 days of treatment with AKT IV, the cell morphology did not indicate that the cells were undergoing cell death; rather it appeared that the cells were not dividing (data not shown). In addition, the AKT inhibitor reduced the expression of transfected SPARC, whereas the ERK inhibitor U0126 increased SPARC compared with DMSO-treated A2b2_EV cells.
Fig. 9.
Direct inhibition of signaling pathways that are negatively regulated by PTEN suppresses proliferation and migration in SPARC-expressing GBM cells. (A) Cells were plated on fibronectin and analyzed at 0-, 3-, and 6-day timepoints for dsDNA content. The cells were treated with either the MEK inhibitor PD98059 (50 µM), the MEK inhibitor U0126 (20 µM), the AKT inhibitor AKT IV (2.5 µM), or equivalent vehicle control (DMSO). The assay was repeated 3 times and analyzed statistically. Asterisks denote significantly different from A2b2_EV DMSO at P < 0.001. After 3 days with inhibitors, the cells were lysed and analyzed for phosphorylated protein, total protein, and actin (loading control) expression by Western blot. (B) SPARC-expressing cells were plated on fibronectin until confluent and then wounded with a razor blade. After wounding, the cells were treated with either the MEK inhibitor PD98059 (50 µM), the AKT inhibitor AKT IV (2.5 µM), or equivalent vehicle control (DMSO). The distance migrated was measured after 20 h using random microscopic fields from 4 wounds/cell type. The assay was repeated twice and analyzed statistically. Asterisks mean significantly different from A2b2_EV DMSO at P < 0.001. After migration, the cells were lysed and analyzed for phosphorylated protein, total protein, and actin (loading control) expression by Western blot. Cap symbol denotes the deletion of intervening lanes.
We further tested whether an ERK inhibitor and an AKT inhibitor could suppress migration in SPARC-expressing A2b2_EV cells to the level observed when PTEN was restored to the cells (Fig. 9B). Both the ERK inhibitor PD98059 and the AKT inhibitor AKT IV significantly reduced migration by 20% (P < 0.001) and 38% (P < 0.001), respectively; however, reconstitution of PTEN produced the greatest suppression of migration by 48% (P < 0.001). Western blot analysis of the migration assay lysates showed that ERK activation was suppressed by PD98059 and PTEN reconstitution. PTEN reconstitution suppressed AKT activation, but AKT IV did not appear to reduce the activation of AKT although the amount of total AKT was suppressed in the presence of the inhibitor. In this assay, the cells are confluent at the start of migration and the majority of the cells are overly confluent at the end of the assay when the cells are lysed. It is possible that the migrating cells have a reduction in AKT activation as indicated by the inhibition of migration in the presence of AKT IV; whereas AKT activation in the stressed, overly confluent cells may remain high due to the survival stimuli affecting the cells under these conditions. Because the migrating cells make up only a small proportion of the cell lysate, the changes in AKT activation in these cells may not be detected.
Discussion
In this study, we demonstrate that reconstitution of PTEN suppresses the in vitro proliferation and migration and the in vivo tumor growth and invasion of SPARC-expressing GBM cells and prolongs animal survival. These changes correlate with suppression of the AKT and SHC-RAF-ERK signaling pathways, and chemical inhibitors of these pathways can suppress the in vitro proliferation and migration of SPARC-expressing GBM cells.
The in vitro data demonstrate that, similar to our previous reports, SPARC expression suppressed proliferation15,16 and increased migration4,15 compared with control cells. PTEN reconstitution was able to suppress proliferation and migration in both SPARC-expressing and control U87MG glioma cells. These results are in agreement with several previous reports in which PTEN restoration was found to reduce the in vitro proliferation,23,32 cell cycle progression,29 and migration25–27,33 of glioma cells. Interestingly, the PTEN effects were greater in SPARC-expressing cells compared with control cells, which may in part be due to the suppression of ERK activation by PTEN, which was only seen in SPARC-expressing cells.
The PTEN-induced suppression of proliferation and migration correlates with inhibition of the AKT and SHC-RAF-ERK signaling pathways. PTEN reduced AKT signaling in both control and SPARC-expressing cells, whereas SHC-RAF-ERK signaling was suppressed only in SPARC-expressing cells. Therefore, the SHC-RAF-ERK pathway may be important for the additional suppression of proliferation and migration by PTEN in SPARC-expressing cells. Interestingly, Li et al.34 found that the p53 mutational background of glioma cell lines determines whether PTEN restoration will result in a tumor-promoting or tumor-suppressing phenotype. In the current study, we find that SPARC overexpression increases the tumor-suppressing potential of PTEN both in vitro and in vivo. One possible explanation is that when PTEN is expressed, the resulting suppression in cell growth may induce the cells to become more dependent on growth factor signaling, which can be antagonized by SPARC. SPARC can interfere with growth factor–growth factor receptor interactions by binding to VEGF and PDGF and inhibiting the activation of the tyrosine kinase receptors for these growth factors.17,18 Furthermore, both SPARC and PTEN have been shown to inhibit growth-factor stimulated ERK activation,18,35 which may explain why there is a greater effect on the ERK pathway when both SPARC and PTEN are expressed.
Similar to reports that PTEN restoration reduces the in vivo tumorigenicity of glioma cells,23,29,36 the current study found that PTEN suppresses the in vivo tumor growth and proliferation of both control and SPARC-expressing GBM cells when implanted into the brains of nude rats, with the greatest reduction in growth when SPARC and PTEN are coexpressed. The in vivo proliferation rates correlated with animal survival in which PTEN or SPARC alone increased survival by 40% and 52%, respectively, and SPARC and PTEN together increased survival by 134% compared with control tumors.
Since SPARC30 and PTEN36 have both previously been shown to regulate tumor vascularity, we determined whether changes in vascularity contributed to the reduction in tumor growth when SPARC and/or PTEN were expressed in the cells. Unexpectedly, we found that PTEN expression alone resulted in a significant increase in median vessel size and total vascular area even though PTEN-expressing tumors were smaller and less proliferative than control tumors. In addition, the SPARC- and PTEN-expressing tumors had a significant reduction in vessel number compared with control tumors; however, no reduction in the total vascular area was detected. Thus, these data suggest that proliferation rate is a more important contributor to tumor volume and animal survival than vascularity in this model.
We did detect a trend toward a decrease in the number of vessels with SPARC alone, which is in agreement with a previous report by our laboratory in which SPARC-expressing GBM cells that were xenografted in vivo produced tumors that had reduced vascularity and VEGF staining.30 One difference between the studies is that in the Yunker et al.30 report, individual endothelial cells were counted, which would favor inclusion of small angiogenic vessels, whereas in this study only blood vessel lumens were counted, which would exclude the small vessels.
PTEN has been reported to decrease vascularity in U87MG36 or U87MGΔEGFR37 brain xenografts in nude rodents. In the current study, there was no difference in the number of vessel lumens between PTEN-expressing tumors compared with control tumors, although there was a trend toward an increase in vessel number with PTEN. The difference in the results between the studies may be due to differences in the implantation sites of the tumors, the rate at which the tumors developed, or the methods used to quantitate vascularity. For example, 1 group used a stain to detect only angiogenic vessels36 and the other group normalized the number of vessels to the tumor volume.37
This is the first study to assess the effect of PTEN on invasion in gliomas in vivo. When PTEN was restored in invasive SPARC-expressing cells, the tumors resembled control tumors rather than SPARC-expressing tumors, and we did not detect invading single cells along white matter tracts or into the adjacent parenchyma as seen in SPARC-expressing tumors. Collectively, the data suggest that PTEN suppresses SPARC-induced invasion. The ability of PTEN to suppress invasion in vivo agrees with several in vitro reports and 1 ex vivo study that PTEN can reduce glioma cell invasion.27,38–42
PTEN may suppress invasion, in part, by reducing the expression of matrix-degrading proteases. It has been reported that the reconstitution of PTEN in glioma cells inhibits matrix metalloproteinase (MMP)-2 expression and activity40,43 and hyaluronic acid-induced MMP-9 secretion and activity.43 Interestingly, we and others have previously shown that the expression of SPARC in glioma cell lines increases the expression and activity of several types of matrix metalloproteinases.6,8–10 Future studies should determine whether PTEN can reverse the increase in protease expression induced by SPARC.
Direct inhibition of the AKT and ERK signaling pathways, which are negatively regulated by PTEN, suppresses proliferation and migration in SPARC-expressing cells in vitro. Chemical inhibitors of AKT and ERK were as effective as PTEN restoration at suppressing proliferation but not migration. Since the AKT and the SHC-RAF-ERK pathways are both involved in the suppression of migration by PTEN, both pathways may have to be inhibited together to mimic the effect of restoring PTEN to the cells.
In summary, reconstitution of PTEN suppresses the in vitro proliferation and migration and the in vivo tumor growth and invasion of SPARC-expressing GBM cells and prolongs animal survival. These changes correlate with PTEN-induced suppression of the AKT and SHC-RAF-ERK signaling pathways, and chemical inhibitors of AKT and ERK can suppress the in vitro proliferation and migration of SPARC-expressing GBM cells. Therefore, the reconstitution of PTEN or the direct inhibition of the AKT and/or SHC-RAF-ERK signaling pathways provide potential therapeutic strategies to suppress brain tumor progression by inhibiting the positive effect of SPARC on tumor invasion while enhancing the negative effect of SPARC on proliferation and tumor growth. Future clinical studies should determine whether patients whose tumors express SPARC and are deleted for PTEN respond better to AKT and ERK inhibitors than patients whose tumors express SPARC but retain PTEN.
Supplementary Material
Supplementary material is available at Neuro-Oncology Journal online.
Funding
This work was partially supported by the Jeffrey Baron/American Brain Tumor Association Fellowship (to S.L.T.) and by the National Institutes of Health and National Cancer Institute (R01CA86997 to S.A.R.). The authors are grateful to the Barbara Jane Levy family for their continued support.
Acknowledgements
We thank Pamela Osenkowski, Enoch Carleton, and Rachel Klein for technical assistance, and Chad Schultz for instruction in xenograft implants. We thank Drs. Frank Furnari and Webster Cavenee for the pBP-PTEN plasmid.
Conflict of interest statement. None declared.
References
- 1.Reardon DA, Wen PY. Therapeutic advances in the treatment of glioblastoma: rationale and potential role of targeted agents. Oncologist. 2006;11:152–164. doi: 10.1634/theoncologist.11-2-152. doi:10.1634/theoncologist.11-2-152. [DOI] [PubMed] [Google Scholar]
- 2.Rempel SA, Golembieski WA, Ge S, et al. SPARC: a signal of astrocytic neoplastic transformation and reactive response in human primary and xenograft gliomas. J Neuropathol Exp Neurol. 1998;57:1112–1121. doi: 10.1097/00005072-199812000-00002. [DOI] [PubMed] [Google Scholar]
- 3.Golembieski WA, Ge S, Nelson K, et al. Increased SPARC expression promotes U87 glioblastoma invasion in vitro. Int J Dev Neurosci. 1999;17:463–472. doi: 10.1016/s0736-5748(99)00009-x. doi:10.1016/S0736-5748(99)00009-X. [DOI] [PubMed] [Google Scholar]
- 4.Golembieski WA, Thomas SL, Schultz CR, et al. HSP27 mediates SPARC-induced changes in glioma morphology, migration, and invasion. Glia. 2008;56:1061–1075. doi: 10.1002/glia.20679. doi:10.1002/glia.20679. [DOI] [PubMed] [Google Scholar]
- 5.Schultz C, Lemke N, Ge S, et al. Secreted protein acidic and rich in cysteine promotes glioma invasion and delays tumor growth in vivo. Cancer Res. 2002;62:6270–6277. [PubMed] [Google Scholar]
- 6.Golembieski WA, Rempel SA. cDNA array analysis of SPARC-modulated changes in glioma gene expression. J Neurooncol. 2002;60:213–226. doi: 10.1023/a:1021167211131. doi:10.1023/A:1021167211131. [DOI] [PubMed] [Google Scholar]
- 7.Tremble PM, Lane TF, Sage EH, Werb Z. SPARC, a secreted protein associated with morphogenesis and tissue remodeling, induces expression of metalloproteinases in fibroblasts through a novel extracellular matrix-dependent pathway. J Cell Biol. 1993;121:1433–1444. doi: 10.1083/jcb.121.6.1433. doi:10.1083/jcb.121.6.1433. [DOI] [PMC free article] [PubMed] [Google Scholar]
- 8.McClung HM, Thomas SL, Osenkowski P, et al. SPARC upregulates MT1-MMP expression, MMP-2 activation, and the secretion and cleavage of galectin-3 in U87MG glioma cells. Neurosci Lett. 2007;419:172–177. doi: 10.1016/j.neulet.2007.04.037. doi:10.1016/j.neulet.2007.04.037. [DOI] [PMC free article] [PubMed] [Google Scholar]
- 9.Rich JN, Shi Q, Hjelmeland M, et al. Bone-related genes expressed in advanced malignancies induce invasion and metastasis in a genetically defined human cancer model. J Biol Chem. 2003;278:15951–15957. doi: 10.1074/jbc.M211498200. doi:10.1074/jbc.M211498200. [DOI] [PubMed] [Google Scholar]
- 10.Kunigal S, Gondi CS, Gujrati M, et al. SPARC-induced migration of glioblastoma cell lines via uPA-uPAR signaling and activation of small GTPase RhoA. Int J Oncol. 2006;29:1349–1357. [PMC free article] [PubMed] [Google Scholar]
- 11.Nie J, Chang B, Traktuev DO, et al. IFATS collection: combinatorial peptides identify alpha5beta1 integrin as a receptor for the matricellular protein SPARC on adipose stromal cells. Stem Cells. 2008;26:2735–2745. doi: 10.1634/stemcells.2008-0212. doi:10.1634/stemcells.2008-0212. [DOI] [PMC free article] [PubMed] [Google Scholar]
- 12.Weaver MS, Workman G, Sage EH. The copper binding domain of SPARC mediates cell survival in vitro via interaction with integrin beta1 and activation of integrin-linked kinase. J Biol Chem. 2008;283:22826–22837. doi: 10.1074/jbc.M706563200. doi:10.1074/jbc.M706563200. [DOI] [PMC free article] [PubMed] [Google Scholar]
- 13.Barker TH, Baneyx G, Cardo-Vila M, et al. SPARC regulates extracellular matrix organization through its modulation of integrin-linked kinase activity. J Biol Chem. 2005;280:36483–36493. doi: 10.1074/jbc.M504663200. doi:10.1074/jbc.M504663200. [DOI] [PubMed] [Google Scholar]
- 14.Shi Q, Bao S, Song L, et al. Targeting SPARC expression decreases glioma cellular survival and invasion associated with reduced activities of FAK and ILK kinases. Oncogene. 2007;26:4084–4094. doi: 10.1038/sj.onc.1210181. doi:10.1038/sj.onc.1210181. [DOI] [PubMed] [Google Scholar]
- 15.Rempel SA, Golembieski WA, Fisher JL, et al. SPARC modulates cell growth, attachment and migration of U87 glioma cells on brain extracellular matrix proteins. J Neurooncol. 2001;53:149–160. doi: 10.1023/a:1012201300188. doi:10.1023/A:1012201300188. [DOI] [PubMed] [Google Scholar]
- 16.Vadlamuri SV, Media J, Sankey SS, et al. SPARC affects glioma cell growth differently when grown on brain ECM proteins in vitro under standard versus reduced-serum stress conditions. Neurooncology. 2003;5:244–254. doi: 10.1093/neuonc/5.4.244. [DOI] [PMC free article] [PubMed] [Google Scholar]
- 17.Raines EW, Lane TF, Iruela-Arispe ML, et al. The extracellular glycoprotein SPARC interacts with platelet-derived growth factor (PDGF)-AB and -BB and inhibits the binding of PDGF to its receptors. Proc Natl Acad Sci USA. 1992;89:1281–1285. doi: 10.1073/pnas.89.4.1281. doi:10.1073/pnas.89.4.1281. [DOI] [PMC free article] [PubMed] [Google Scholar]
- 18.Kupprion C, Motamed K, Sage EH. SPARC (BM-40, osteonectin) inhibits the mitogenic effect of vascular endothelial growth factor on microvascular endothelial cells. J Biol Chem. 1998;273:29635–29640. doi: 10.1074/jbc.273.45.29635. doi:10.1074/jbc.273.45.29635. [DOI] [PubMed] [Google Scholar]
- 19.Li J, Yen C, Liaw D, et al. PTEN, a putative protein tyrosine phosphatase gene mutated in human brain, breast, and prostate cancer. Science. 1997;275:1943–1947. doi: 10.1126/science.275.5308.1943. doi:10.1126/science.275.5308.1943. [DOI] [PubMed] [Google Scholar]
- 20.Steck PA, Pershouse MA, Jasser SA, et al. Identification of a candidate tumour suppressor gene, MMAC1, at chromosome 10q23.3 that is mutated in multiple advanced cancers. Nat Genet. 1997;15:356–362. doi: 10.1038/ng0497-356. doi:10.1038/ng0497-356. [DOI] [PubMed] [Google Scholar]
- 21.Cancer Genome Atlas Research Network. Comprehensive genomic characterization defines human glioblastoma genes and core pathways. Nature. 2008;455:1061–1068. doi: 10.1038/nature07385. doi:10.1038/nature07385. [DOI] [PMC free article] [PubMed] [Google Scholar]
- 22.Parsons DW, Jones S, Zhang X, et al. An integrated genomic analysis of human glioblastoma multiforme. Science. 2008;321:1807–1812. doi: 10.1126/science.1164382. doi:10.1126/science.1164382. [DOI] [PMC free article] [PubMed] [Google Scholar]
- 23.Cheney IW, Johnson DE, Vaillancourt MT. Suppression of tumorigenicity of glioblastoma cells by adenovirus-mediated MMAC1/PTEN gene transfer. Cancer Res. 1998;58:2331–2334. [PubMed] [Google Scholar]
- 24.Knobbe CB, Merlo A, Reifenberger G. Pten signaling in gliomas. Neurooncology. 2002;4:196–211. doi:10.1215/15228517-4-3-196. [PMC free article] [PubMed] [Google Scholar]
- 25.Tamura M, Gu J, Takino T, Yamada KM. Tumor suppressor PTEN inhibition of cell invasion, migration, and growth: differential involvement of focal adhesion kinase and p130Cas. Cancer Res. 1999;59:442–449. [PubMed] [Google Scholar]
- 26.Gu J, Tamura M, Pankov R, et al. Shc and FAK differentially regulate cell motility and directionality modulated by PTEN. J Cell Biol. 1999;146:389–403. doi: 10.1083/jcb.146.2.389. doi:10.1083/jcb.146.2.389. [DOI] [PMC free article] [PubMed] [Google Scholar]
- 27.Tamura M, Gu J, Matsumoto K, et al. Inhibition of cell migration, spreading, and focal adhesions by tumor suppressor PTEN. Science. 1998;280:1614–1617. doi: 10.1126/science.280.5369.1614. doi:10.1126/science.280.5369.1614. [DOI] [PubMed] [Google Scholar]
- 28.Attwell S, Mills J, Troussard A, et al. Integration of cell attachment, cytoskeletal localization, and signaling by integrin-linked kinase (ILK), CH-ILKBP, and the tumor suppressor PTEN. Mol Biol Cell. 2003;14:4813–4825. doi: 10.1091/mbc.E03-05-0308. doi:10.1091/mbc.E03-05-0308. [DOI] [PMC free article] [PubMed] [Google Scholar]
- 29.Li DM, Sun H. PTEN/MMAC1/TEP1 suppresses the tumorigenicity and induces G1 cell cycle arrest in human glioblastoma cells. Proc Natl Acad Sci USA. 1998;95:15406–15411. doi: 10.1073/pnas.95.26.15406. doi:10.1073/pnas.95.26.15406. [DOI] [PMC free article] [PubMed] [Google Scholar]
- 30.Yunker CK, Golembieski W, Lemke N, et al. SPARC-induced increase in glioma matrix and decrease in vascularity are associated with reduced VEGF expression and secretion. Int J Cancer. 2008;122:2735–2743. doi: 10.1002/ijc.23450. doi:10.1002/ijc.23450. [DOI] [PMC free article] [PubMed] [Google Scholar]
- 31.Endersby R, Baker SJ. PTEN signaling in brain: neuropathology and tumorigenesis. Oncogene. 2008;27:5416–5430. doi: 10.1038/onc.2008.239. doi:10.1038/onc.2008.239. [DOI] [PubMed] [Google Scholar]
- 32.Furnari FB, Lin H, Huang HS, Cavenee WK. Growth suppression of glioma cells by PTEN requires a functional phosphatase catalytic domain. Proc Natl Acad Sci USA. 1997;94:12479–12484. doi: 10.1073/pnas.94.23.12479. doi:10.1073/pnas.94.23.12479. [DOI] [PMC free article] [PubMed] [Google Scholar]
- 33.Dey N, Crosswell HE, De P, et al. The protein phosphatase activity of PTEN regulates SRC family kinases and controls glioma migration. Cancer Res. 2008;68:1862–1871. doi: 10.1158/0008-5472.CAN-07-1182. doi:10.1158/0008-5472.CAN-07-1182. [DOI] [PubMed] [Google Scholar]
- 34.Li Y, Guessous F, Kwon S, et al. PTEN has tumor-promoting properties in the setting of gain-of-function p53 mutations. Cancer Res. 2008;68:1723–1731. doi: 10.1158/0008-5472.CAN-07-1963. doi:10.1158/0008-5472.CAN-07-1963. [DOI] [PMC free article] [PubMed] [Google Scholar]
- 35.Gu J, Tamura M, Yamada KM. Tumor suppressor PTEN inhibits integrin- and growth factor-mediated mitogen-activated protein (MAP) kinase signaling pathways. J Cell Biol. 1998;143:1375–1383. doi: 10.1083/jcb.143.5.1375. doi:10.1083/jcb.143.5.1375. [DOI] [PMC free article] [PubMed] [Google Scholar]
- 36.Wen S, Stolarov J, Myers MP, et al. PTEN controls tumor-induced angiogenesis. Proc Natl Acad Sci USA. 2001;98:4622–4627. doi: 10.1073/pnas.081063798. doi:10.1073/pnas.081063798. [DOI] [PMC free article] [PubMed] [Google Scholar]
- 37.Abe T, Terada K, Wakimoto H, et al. PTEN decreases in vivo vascularization of experimental gliomas in spite of proangiogenic stimuli. Cancer Res. 2003;63:2300–2305. [PubMed] [Google Scholar]
- 38.Maier D, Jones G, Li X, et al. The PTEN lipid phosphatase domain is not required to inhibit invasion of glioma cells. Cancer Res. 1999;59:5479–5482. [PubMed] [Google Scholar]
- 39.Kotelevets L, van Hengel J, Bruyneel E, et al. The lipid phosphatase activity of PTEN is critical for stabilizing intercellular junctions and reverting invasiveness. J Cell Biol. 2001;155:1129–1135. doi: 10.1083/jcb.200105109. doi:10.1083/jcb.200105109. [DOI] [PMC free article] [PubMed] [Google Scholar]
- 40.Koul D, Parthasarathy R, Shen R, et al. Suppression of matrix metalloproteinase-2 gene expression and invasion in human glioma cells by MMAC/PTEN. Oncogene. 2001;20:6669–6678. doi: 10.1038/sj.onc.1204799. doi:10.1038/sj.onc.1204799. [DOI] [PubMed] [Google Scholar]
- 41.Cai XM, Tao BB, Wang LY, et al. Protein phosphatase activity of PTEN inhibited the invasion of glioma cells with epidermal growth factor receptor mutation type III expression. Int J Cancer. 2005;117:905–912. doi: 10.1002/ijc.21251. doi:10.1002/ijc.21251. [DOI] [PubMed] [Google Scholar]
- 42.Furukawa K, Kumon Y, Harada H, et al. PTEN gene transfer suppresses the invasive potential of human malignant gliomas by regulating cell invasion-related molecules. Int J Oncol. 2006;29:73–81. [PubMed] [Google Scholar]
- 43.Park MJ, Kim MS, Park IC, et al. PTEN suppresses hyaluronic acid-induced matrix metalloproteinase-9 expression in U87MG glioblastoma cells through focal adhesion kinase dephosphorylation. Cancer Res. 2002;62:6318–6322. [PubMed] [Google Scholar]


