

Abstract
Previous studies have shown that oligodendroglial progenitor cells (OPCs) can give rise to neurons in vitro and in perinatal cerebral cortex in vivo. We now report that OPCs in adult murine piriform cortex express low levels of doublecortin, a marker for migratory and immature neurons. Additionally, these OPCs express Sox2, a neural stem cell marker, and Pax6, a transcription factor characteristic of progenitors for cortical glutamatergic neurons. Genetic fate-mapping by means of an inducible Cre–LoxP recombination system proved that these OPCs differentiate into pyramidal glutamatergic neurons in piriform cortex. Several lines of evidence indicated that these newly formed neurons became functionally integrated into the cortical neuronal network. Our data suggest that NG2+/PDGFRα+ proteolipid protein promoter-expressing progenitors generate pyramidal glutamatergic neurons within normal adult piriform cortex.
Introduction
The production of new neurons in the adult mammalian brain is predominantly restricted to two areas, the subventricular zone (SVZ) and the hippocampal subgranular zone (SGZ) (Gage, 2000). Whether neurogenesis continues in the normal adult cerebral cortex, from either SVZ neural stem cells (NSCs) (Gould et al., 1999; Inta et al., 2008) or intrinsic neural progenitors within cortex (Magavi et al., 2000; Dayer et al., 2005) remains controversial (Gould, 2007), although formation of new cortical interneurons from subventricular zone or intrinsic cortical progenitors after cerebral injury has been well documented (Magavi et al., 2000; Arvidsson et al., 2002; Tsai et al., 2006; Ohira et al., 2010). In the present study, we provide genetic fate-mapping evidence for the de novo formation of glutamatergic pyramidal neurons from oligodendroglial progenitor cells (OPCs) within the normal adult murine piriform cortex.
OPCs, identifiable by their expression of the proteoglycan NG2 and the platelet-derived growth factor receptor PDGFRα, have been assumed until recently to give rise only to oligodendroglia in intact immature and adult mammals, although these progenitors are known to be capable of generating neurons and NG2-positive (NG2+) “type 2 astroglia” in vitro in the presence of appropriate morphogens (Raff et al., 1983; Kondo and Raff, 2000) and in vivo after transplantation (Belachew et al., 2003; Aguirre et al., 2004). Abundant NG2+ cells persist in CNS white and gray matter after myelination is completed (Dawson et al., 2003). Some extend processes to nodes of Ranvier (Butt et al., 1999), receive glutamatergic synaptic inputs from local neurons, and generate immature action potentials (Bergles et al., 2000; Chittajallu et al., 2004; Káradóttir et al., 2008; Mangin et al., 2008; De Biase et al., 2010; Etxeberria et al., 2010). The functional role of this synaptic input to these OPCs remains unknown, but in vitro studies have shown that glutamate inhibits differentiation of OPCs to oligodendrocytes (Gallo et al., 1996; Yuan et al., 1998).
In vivo genetic fate-mapping studies of OPCs by use of oligodendroglial lineage-specific Cre transgenes have not yielded consistent results. Using a PDGFRα promoter-driven Cre, Rivers et al. (2008) observed neuronal generation in adult piriform cortex from OPCs, but other investigators, using NG2- or Olig2-promoter-driven Cre transgenes, did not (Dimou et al., 2008; Zhu et al., 2008).
Taking advantage of proteolipid protein (Plp) promoter activity in OPCs to drive expression of a tamoxifen-inducible Cre transgene, we reported previously that NG2+/PDGFRα+ Plp promoter-expressing progenitors (“NG2+/PDGFRα+ PPEPs”) give rise to neurons in neonatal mouse forebrain (Guo et al., 2009). We now demonstrate that mature glutamatergic pyramidal neurons are generated in adult piriform cortex from adult NG2+/PDGFRα+ PPEPs that express the PLP promoter and markers for neural stem cells (Sox2) and neuronal progenitors [doublecortin (DCX) and Pax6] and that these neurons become functionally integrated into CNS circuits.
Materials and Methods
Animals.
The Plp–CreERT2 mice (Doerflinger et al., 2003) and Rosa26–STOP–EYFP recombination reporter line (Srinivas et al., 2001) were purchased from The Jackson Laboratory and maintained in C57BL/6 background. The hGFAP–Cre–ERT2 mice were from the Vaccarino colony at Yale University. Plp–CreERT2 and hGFAP–Cre–ERT2 mice were bred to reporter mice Rosa26–STOP–EYFP to yield Plp–CreERT2/Rosa26– EYFP (PCE/R) and hGFAP–Cre–ERT2/Rosa26–STOP–EYFP (GCE/R) double-transgenic mice. The Rosa26–STOP–EYFP transgene in both PCE/R and GCE/R mice was maintained as homozygous. Both male and female mice were used in our experiments, because we detected no sex differences with respect to Cre-induced recombination and neurogenesis. Mice were caged in a 12 h light/dark cycle with access to food and water ad libitum. Mouse genotypes were ascertained by Transnetyx. All animal procedures were performed according to guidelines of the Institutional Animal Care and Use Committee of the University of California, Davis.
Tamoxifen treatment and Cre induction.
Tamoxifen (TM) (T5648; Sigma-Aldrich) was dissolved in an ethanol/sunflower seed oil (1:9) mixture at a concentration of 30 mg/ml. Early adult mice [postnatal day 45 (P45) to P60] were intraperitoneally treated with TM, twice daily for 5 consecutive days. The dose of injection in the morning was 1.2 mg (40 μl) and that in the afternoon was 1.5 mg (50 μl). With this TM dosage schedule, we obtained highest recombination efficiency with no lethality. No enhanced yellow fluorescent protein (EYFP) expression was detected by direct or antibody-amplified fluorescence microscopy of PCE/R mice treated with vehicle only (mixture of ethanol and sunflower seed oil, 1:9) (Guo et al., 2009, their Fig. S1A1–B2). EYFP appeared in OPCs and oligodendroglia as early as 12 h after first TM injection, the earliest time point we assessed.
Bromodeoxyuridine cumulative labeling.
Eight week postnatal C57Bl mice were used for bromodeoxyuridine (BrdU) cumulative labeling experiment. For 2 h pulse labeling of mitotic cells, mice were intraperitoneally injected with BrdU solution (100 mg/kg body weight in sterile PBS at 10 mg/ml). For long-term labeling of mitotic cells, BrdU was dissolved in the drinking water (1 mg/ml), and mice were given access to the water ad libitum for as long as 20 d. BrdU labeling periods of 25 d or more were not used, because we found that, after 25 d, mice showed evidences of toxicity, for example, loss of hair and body shaking. Brain tissues were analyzed after 2, 4, 6, 8, 10, 14, and 20 d of BrdU labeling to calculate the growth index of OPCs (Nowakowski et al., 1989).
Tissue preparation.
The brain tissues were analyzed on 1, 5, 10, 17, 30, 60, 90, 150, and 182 d after their last TM injection (days after TM), with three to eight mice at each time point. After anesthesia with ketamine (150 mg/kg body weight)/xylazine (16 mg/kg body weight), mice were perfused transcardially with 1× PBS and then with 4% paraformaldehyde (PFA) in PBS. Brains were harvested, postfixed in 4% PFA in PBS for 1–2 h at room temperature (RT), then cryoprotected in 30% sucrose (v/v) prepared in 1× PBS at 4°C until tissues sink down, usually for 1–2 h overnight, and then transferred to OCT compound for embedding on ethanol/dry ice.
In this study, we focused on the posterior piriform cortex from bregma −1.06 mm to bregma −2.3 (Franklin and Paxinos, 2008), ∼1.3 mm spanning the posterior forebrain. For analyzing the SVZ, we collected sections from bregma 0.98 mm to bregma 0.02 mm (Franklin and Paxinos, 2008). Brains were cut coronally on a Leica cryostat (model CM3050 S) to prepare 14-μm-thick sections, which were stored at −80°C until use.
Immunohistochemistry.
The immunostaining methods have been described previously (Guo et al., 2009), with a few modifications. Briefly, sections were air dried for at least 30 min at RT, followed by incubation in normal serum blocking solution (dependent on the secondary antibodies used) at RT for at least 1 h (5% normal serum plus 0.1% Triton X-100 in 1× PBS). When a streptavidin–biotin detection system was used, the section was treated with a streptavidin–biotin blocking kit (SP-2002; Vector Laboratories) before normal serum blocking. Primary antibodies were diluted in normal serum blocking solutions and incubated at 4°C overnight or 37°C for 2–3 h, followed by three 20 min washes in PBS plus 0.1% Triton X-100. After incubation with secondary antibodies (all from Jackson ImmunoResearch) in normal serum blocking solution, sections were washed three times (20 min each) in PBS plus 0.1% Triton X-100 at RT. For streptavidin–biotin detection system, DyLight 488-, DyLight 549- (from Jackson ImmunoResearch), or Pacific blue-SA (from Invitrogen), diluted in PBS, were incubated for 15 min at RT, followed by three 10 min washes in PBS plus 0.1% Triton X-100 at RT. Finally, 4′,6′-diamidino-2-phenylindole (DAPI) was used to label nuclei, and the sections were mounted with Vectashield mounting medium for fluorescence (H-1000; Vector Laboratories).
In our previous study (Guo et al., 2009), we used a DCX antibody (from Abcam) at 1:250 dilution, which yielded a high background and possibly masked low-level OPC DCX expression. In the present study, we optimized immunostaining with this antibody by using 1:400 to 1:600 dilutions. This reduced background without affecting overall signals. To evaluate the specificity of DCX immunostaining, peptide absorption experiments were conducted. In brief, DCX antibody (1:500) was incubated with DCX peptide (catalog #ab19804; Abcam) or an unrelated peptide (NMDA receptor subunit 1 peptide; catalog #sc-1467P; Santa Cruz Biotechnology) at 4°C overnight. Tissue sections were then immunostained with these DCX antibody/peptide mixtures, with untreated DCX antibody as a positive control. Results (supplemental Fig. S2A–C, available at www.jneurosci.org as supplemental material) demonstrated that OPC immunostaining by DCX antibody was specific.
For BrdU staining, we used HCl instead of heating to denature double-stranded DNA, because immunoreactivity of EYFP is destroyed by high temperature. After all the immunostaining steps except DAPI staining were completed, sections were postfixed with 2% PFA in 1× PBS at RT for 15 min and then denatured in 2N HCl at 37°C for 45 min. After three 5 min washes in PBS, the sections were incubated with anti-BrdU (rat, 1:100; Santa Cruz Biotechnology) diluted in normal serum blocking solution at 4°C overnight or 37°C for 3 h. Signals from BrdU staining were compared with those obtained with 5-ethynyl-2-deoxyuridine (EdU) to evaluate the efficacy of our BrdU immunostaining protocol, because EdU signals were visualized via chemical reaction without any DNA denaturing procedures. Eight week postnatal C57BL/6 mice were given six intraperitoneal doses of BrdU and EdU mixture (same molar concentrations of each) and killed 2 h after the last injection. Tissue sections were color developed with EdU first and then immunostained with anti-BrdU. The overlap of BrdU and EdU signals (supplemental Fig. S1J,K, available at www.jneurosci.org as supplemental material) validated the efficiency of our BrdU immunostaining protocols.
Primary antibodies were as described in our previous study (Guo et al., 2009, their supplemental Table 1) except for the following: Sox2 (rabbit, 1:200), Pax6 (rabbit, 1:200), and SMI312 (mouse, 1:1000) from Covance; Sox10 (goat, 1:100) and c-Fos (rabbit, 1:100) from Santa Cruz Biotechnology; NR1 (rabbit, 1:200) and choline acetyltransferase (ChAT) (rabbit, 1:500) from Millipore; Iba-1 (rabbit, 1:1000) from Wako; CD11b (rabbit, 1:80) from BD PharMingen; and Tbr1 (rabbit, 1:50 from Santa Cruz Biotechnology; rabbit, 1:200 from Abcam). As negative controls for immunohistochemistry, normal IgG (with final concentration of 10 μg/ml, usually twice that of the primary antibodies) from corresponding species were incubated in parallel with the primary antibodies to exclude nonspecific binding.
OPC purification and immunocytochemistry.
NG2+ cultured OPCs were purified from neonate mouse forebrain using methods described by Horiuchi et al. (2010). DCX and PDGFRα double immunostaining was conducted on primary cultured OPCs (Horiuchi et al., 2010).
Microscopic analysis and quantification.
A Nikon Eclipse C1 confocal laser-scanning microscope was used to image DyLight 488 (green), DyLight 549 (red), and DAPI or Pacific Blue (blue). Optical sections were acquired using 20× [numerical aperture (NA), 0.75], 40× (NA, 1.30), or 60× (NA, 1.40) oil objective lens with Nikon EZ-C1 software, version 3.8. The Nikon EZ-C1 3.20 FreeViewer was used to create single-channel views, merged views, and orthogonal views of the images, and Photoshop CS3 was used to combine and label the images, which were exported from EZ-C1 3.20 FreeViewer without any manipulation of contrast. We considered two markers as colocalized only if this colocalization extended from the top to bottom of the z-section images.
For cell counting, we counted the whole area of piriform cortex in 14-μm-thick coronal sections. Under 20× lens, ∼five to six optical fields covered the entire area of the piriform cortex. Six to eight coronal sections located within bregma −1.06 mm to bregma −2.3 mm (∼90 sections collected) from each brain (three to eight animals for each time point) were examined. The number of EYFP+ neurons in layers II and III were quantified; EYFP+ neurons were absent from layer 1. Other quantifications included the whole piriform cortex. For quantification of every defined profile, at least 200 cells were assessed.
We quantified the expression of DCX using Nikon NIS-Elements AR 3.10 software. In brief, DCX signal pixels (range of pixel intensity, 0–256) from individual DCX-positive cells [considered as a region of interest (ROI)] were measured using the Auto Detection tool and exported into Excel files. Average DCX expression levels were calculated by dividing “sum intensity” by “ROI area.” This DCX expression level analysis revealed a two-peak distribution pattern, with peak expression levels of 51 and 122, respectively.
To quantify apical dendritic tree length, tissue sections from 30, 90, and 150 d after TM were immunostained with EYFP in parallel using a biotin–streptavidin detection system to amplify EYFP signals. The distance between the protrusion of the apical dendritic trunk and the end of the apical dendritic tree in piriform cortex layer I, visualized by EYFP signals, was measured using Nikon NIS-Elements AR 3.10 software. At least 30 EYFP+ neurons were examined in this way at each time point.
Statistical analysis.
All data in this study are reported as mean ± SD. Statistical analyses were performed by Student's t test (two-tailed) using SPSS 15.0. Statistical significance was set as p = 0.05.
Results
Immunohistological identification of OPCs in adult piriform cortex
Adult OPCs were identified by their expression of NG2 and PDGFRα. Anti-PDGFRα labeled the cell body and primary processes of OPCs in an asymmetric manner (supplemental Fig. S1A, available at www.jneurosci.org as supplemental material), whereas NG2 was expressed on the entire OPC surface, including both primary and secondary processes (supplemental Fig. S1B, available at www.jneurosci.org as supplemental material). Blood vessels also expressed NG2 and PDGFRα (for example, supplemental Fig. S1D, arrowhead, available at www.jneurosci.org as supplemental material) but were readily distinguished from OPCs by their morphology and lack of expression of Sox10, an oligodendroglial lineage marker (supplemental Fig. S1D, arrows, available at www.jneurosci.org as supplemental material). In piriform cortex, all PDGFRα+ OPCs colabeled with NG2, and 96.4 ± 2.3% (mean ± SD) NG2+ OPCs were PDGFRα+ (supplemental Fig. S1C, arrows, E, available at www.jneurosci.org as supplemental material).
OPCs in the cortex express low-level doublecortin immunoreactivity
It has been reported previously that early postnatal and adult cortex contains a large number of low-level DCX-expressing cells that retain properties of multipotential precursors in vitro (Walker et al., 2007). We observed two populations of DCX-expressing cells in the piriform cortex, high-level DCX-expressing (DCX++) cells (Fig. 1A1, arrowheads), primarily restricted to layer II, and low-level expressing (DCX+) cells (Fig. 1A1, arrows), distributed evenly throughout the piriform cortex. Quantification of DCX expression level revealed an atypical two-peak distribution pattern, with peak expression being 51 ± 12 and 122 ± 18, respectively (p = 7.2e-16, n = 150) (Fig. 1D7). To determine the in vivo identities of these DCX-expressing cells, we double immunostained DCX-expressing cells for PDGFRα, NG2, or HuCD. Virtually none of the DCX++ cells were PDGFRα+ or NG2+, and all DCX++ cells were labeled with HuCD, identifying them as neuronal lineage cells (Fig. 1D,D1–D3). In contrast, 95.7% of the DCX+ cells were positive for PDGFRα (Fig. 1A2, arrows, B1–B3, higher magnification) and NG2 (data not shown), and most were negative for HuCD (Fig. 1D4,D5). Interestingly, occasional DCX+ cells were labeled by HuCD; however, their morphology was that of OPCs, with primary processes extended from cell bodies and fine distal branched secondary processes (Fig. 1E1–E3). We further confirmed that the DCX+ cells were members of the oligodendroglial lineage by demonstrating that almost all DCX+/PDGFRα+ cells expressed Sox10, an oligodendroglial lineage-specific maker (Fig. 1G1–G3). The DCX+ cells could be subdivided into two populations, perineuronal (Fig. 1F1–F3, arrows) and non-perineuronal (Fig. 1D4,D5), according to their relative position to HuCD+ neurons. The cell bodies and some of the processes of perineuronal DCX+ cells were immediately adjacent to neuronal cell bodies. The low-level expression of DCX on NG2+/PDGFRα+ OPCs was confirmed by in vitro immunohistology of cultured primary mouse OPCs (supplemental Fig. S2F–H, available at www.jneurosci.org as supplemental material). BrdU cumulative labeling conducted on 8 week postnatal mice showed that only a minority of the NG2+ OPCs (∼25%) in piriform cortex were mitotically active, with an average cell cycle duration of 8 d (supplemental Fig. S1F–H, available at www.jneurosci.org as supplemental material) and that 23 ± 3.2% of the DCX+/PDGFRα+ cells incorporated BrdU (supplemental Fig. S2I–K, available at www.jneurosci.org as supplemental material). None of the DCX++ cells in piriform cortex were labeled with BrdU (supplemental Fig. S2L–N, available at www.jneurosci.org as supplemental material).
Figure 1.
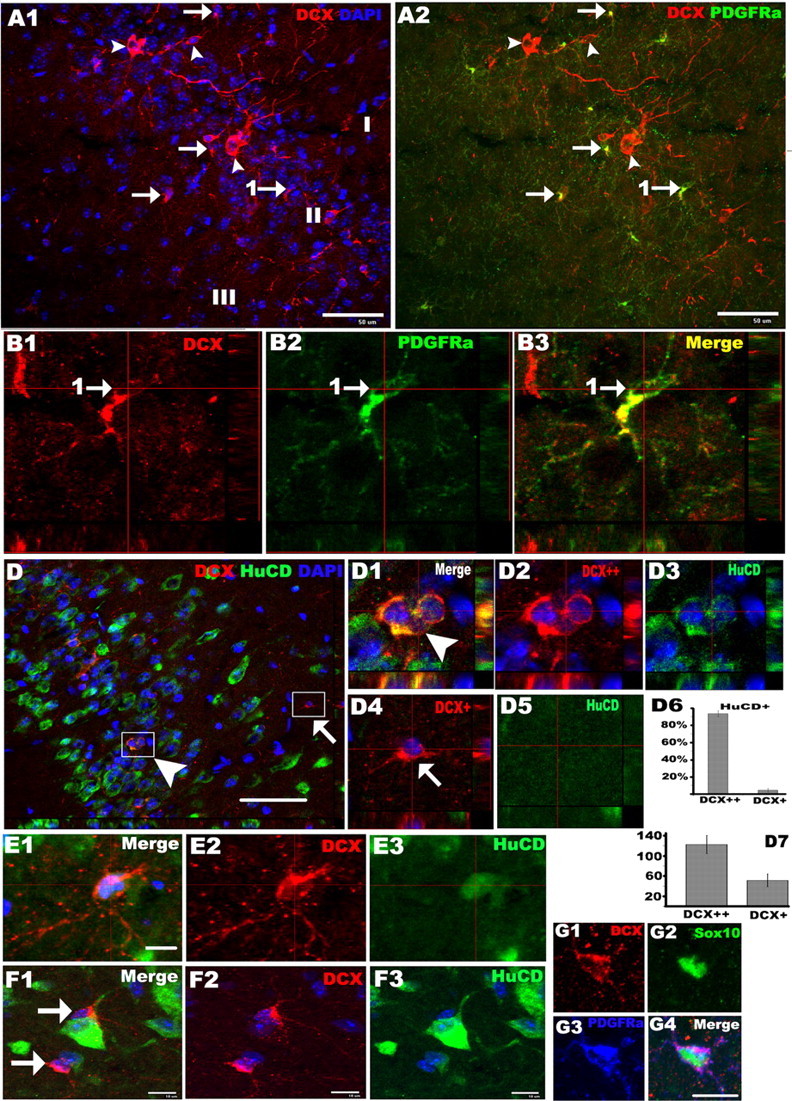
OPCs in the cortex express low-level doublecortin. Double immunohistochemistry depicting high-level DCX (red)-expressing (A1, A2, arrowheads) and low-level DCX (red)-expressing (A1, A2, arrows) cells in the piriform cortex. Low-level DCX-expressing cells were colabeled with PDGFRα (green) (arrows in A2, B1–B3) and were negative for HuCD (green) (D4, D5), and high-level DCX-expressing cells colocalized with HuCD (green) (D1–D3). B1–B3, Orthogonal views of the cell pointed by arrow 1 in A2. D1–D3 and D4,D5 showed orthogonal views of boxed areas pointed by arrowhead an arrow in D, respectively. D6, Percentage of high-level (DCX++) and low-level (DCX+) DCX-expressing cells that were positive for HuCD. D7, Data showing DCX protein expression levels by DCX++ and DCX+ cells. E1–E3, DCX (red)/HuCD (green) double-positive cells with morphology like that of OPCs. F1–F3, Low-level DCX (red)-expressing cells (arrows) located close to HuCD+ (green) neurons. G1–G4, DCX+ (red)/PDGFRα+ (blue) cells were colabeled with Sox10 (green). I, II, and III in A1 stand for layer I, II, and III of piriform cortex, respectively, in this and subsequent figures. All the pictures were taken from P45–P60 mice. Scale bars: A1, A2, D, 50 μm; E1, F1, G4, 10 μm.
Genetic labeling of cerebral cortical oligodendroglial lineage cells
The low-level DCX expression in OPCs suggested the hypothesis that there is a lineage connection between putative OPCs and neurons. We used a genetic fate-mapping procedure to test this hypothesis. Oligodendroglial lineage cells including OPCs express the PLP promoter (Mallon et al., 2002; Guo et al., 2009), and we took advantage of this to label OPCs in the adult piriform cortex with the reporter gene EYFP by Cre–LoxP conditional recombination system using PLPcreERT2/Rosa26–STOP–EYFP (PCE/R) double-transgenic mice. Early adult mice (P45–P60) were intraperitoneally injected with TM twice daily for 5 consecutive days. Consistent with the absence of Cre immunoreactivity in neuronal-specific nuclear protein-positive (NeuN+) or HuCD+ neurons (supplemental Fig. S3G,H, available at www.jneurosci.org as supplemental material), we confirmed that, in adult piriform cortex 10 d after the last tamoxifen injection, 96.7% of EYFP+ cells were Sox10+ and thus members of the oligodendroglial lineage (Fig. 2A, arrows) and, conversely, that ∼60% of Sox10+ cells had undergone recombination. Among these EYFP+ cells, 16.7 ± 3.2% were NG2+ OPCs (Fig. 2B arrows) or PDGFRα+ OPCs (Fig. 2C, arrows) and 81.4% were PDGFRα-negative (PDGFRα−)/Sox10+ mature oligodendrocytes. We also found that a very small proportion of EYFP+ cells (∼2.3%) were subpial GFAP+ cells.
Figure 2.
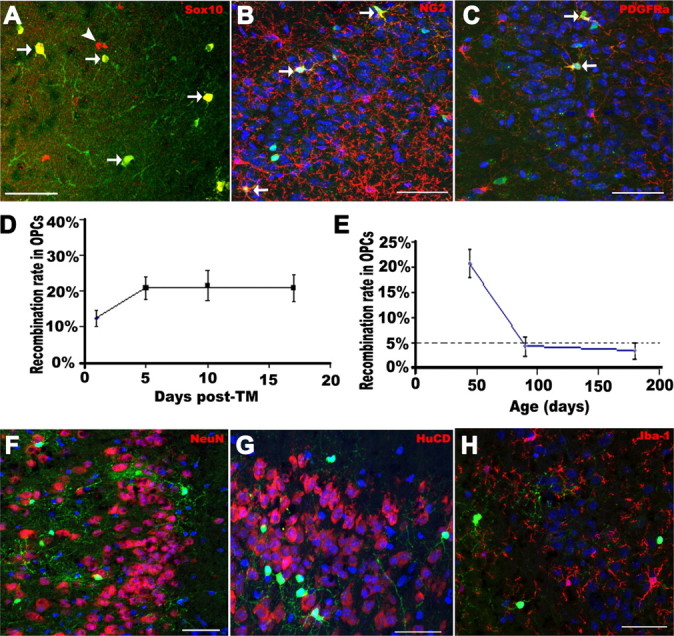
Genetic labeling of adult OPCs in the piriform cortex. A, Almost all EYFP+ cells expressed Sox10 (red). B, C, A subpopulation of EYFP+ cells were NG2+ (red) or PDGFRα+ (red) putative OPCs, respectively. D, Recombination rate in NG2+/PDGFRα+ OPCs on different days after last tamoxifen injection. Note that recombination reached a plateau after 5 d after TM. E, Recombination rates in NG2+/PDGFRα+ OPCs at different ages. Virtually no NeuN+ (red) (F) or HuCD+ (red) (G) cells were labeled before 17 d after TM. H, No Iba-1+ (red) microglia were labeled with EYFP. Arrows in A–C point to examples of double-labeled cells. Arrowhead in A, single-labeled cell. Scale bars, 50 μm.
To further assess the effect of tamoxifen on the recombination rate among OPCs, we analyzed the tissues on 1, 5, 10, and 17 d after the last tamoxifen injection (days after TM) and quantified the percentages of NG2+ or PDGFRα+ OPCs that were labeled with EYFP. On 1 d after TM, 12.4 ± 2.3% of total OPCs were EYFP positive (Fig. 2D), which was consistent with our previous study (Guo et al., 2009, their Discussion). This number increased to 20.8 ± 2.9% on 5 d after TM (Fig. 2D). The recombination rate did not change significantly at later time points, with the percentage being 21.6 and 20.9% on 10 and 17 d after TM, respectively (Fig. 2D), arguing that the TM effect on reporter gene recombination in NG2+ and PDGFRα+ OPCs had been driven to completion within the first 5 d after TM. Consistent with this observation, Cre immunoreactivity in Sox10+ cells was confined to the nucleus on 1 d after TM (supplemental Fig. S3I, available at www.jneurosci.org as supplemental material) but, in contrast, restricted to cytoplasm from 5 d after TM onward (supplemental Fig. S3J,K, available at www.jneurosci.org as supplemental material). Next, we asked whether the recombination rate decreased with age. P90 and P180 mice were treated with TM using the same protocol, i.e., 5 consecutive days, twice a day. In contrast to the results in young adults, only 4.9 and 3.6% of NG2+/PDGFRα+ OPCs became EYFP labeled at P90 and P180, respectively (Fig. 2E), significantly lower recombination rates than that at P45 (p = 0.0006). However, the recombination rate among mature oligodendrocytes and the distribution of EYFP+ mature oligodendrocytes did not change significantly between P45, P90, and P180 using the same tamoxifen paradigm.
Using Cre immunoreactivity as an indicator of Plp transgene expression, we showed that no NeuN+ (supplemental Fig. S3G, available at www.jneurosci.org as supplemental material) or HuCD+ (supplemental Fig. S3H, available at www.jneurosci.org as supplemental material) cells expressed Cre in piriform cortex. To further evaluate whether recombination-induced EYFP expression in piriform cortex was oligodendroglial lineage specific, we assessed EYFP expression in cells of other lineages during the first 17 d after TM. During this time interval, there was no neuronal EYFP expression, indicated by NeuN (Fig. 2F) and HuCD (Fig. 2G) immunostaining (0 EYFP+/HuCD+ cells of 1253 EYFP+ cells counted on 5 d after TM, 0 of 430 on 10 d after TM, 2 of 312 on 17 d after TM). Occasional cells appeared to be EYFP and HuCD double positive, but we were able to exclude colocalization of these markers by confocal z-stacking, which demonstrated that the EYFP was actually in perineuronal cells (Fig. 1F1–F3, available at www.jneurosci.org as supplemental material). Similarly, as shown in Figure 2H, we did not detect EYFP expression in Iba-1+ microglia at any time after TM.
Characterization of NG2+/PDGFRα+ PPEPs in the piriform cortex
Before tracing the progenies of EYFP+ OPCs, we assessed the proportion of EYFP+ OPCs that were mitotically active. NG2+/PDGFRα+, EYFP+/PDGFRα+, and EYFP−/PDGFRα+ cells were designated as overall OPCs, Plp–Cre-positive OPCs, and Plp–Cre-negative OPCs, respectively, based on the observation that, shortly after TM treatment, EYFP was expressed only in Cre-positive cells (compare Fig. 2 with supplemental Fig. S3, available at www.jneurosci.org as supplemental material). After 9 d of BrdU labeling administered in drinking water to 45–55 d postnatal mice, by which time the BrdU labeling index had reached a plateau level, 26.8 ± 12.4% of EYFP-negative OPCs incorporated BrdU, a percentage similar to that in overall OPCs (Fig. 3C), whereas the labeling index of EYFP positive OPCs was 15.3 ± 10.2%. This difference did not reach statistical significance (p = 0.14); hence, EYFP expression did not discriminate adult nonproliferating from proliferating NG2+/PDGFRα+ OPCs, a result consistent with previous data showing that Plp promoter activity does not distinguish proliferating from nonproliferating NG2+ OPCs (Mallon et al., 2002).
Figure 3.
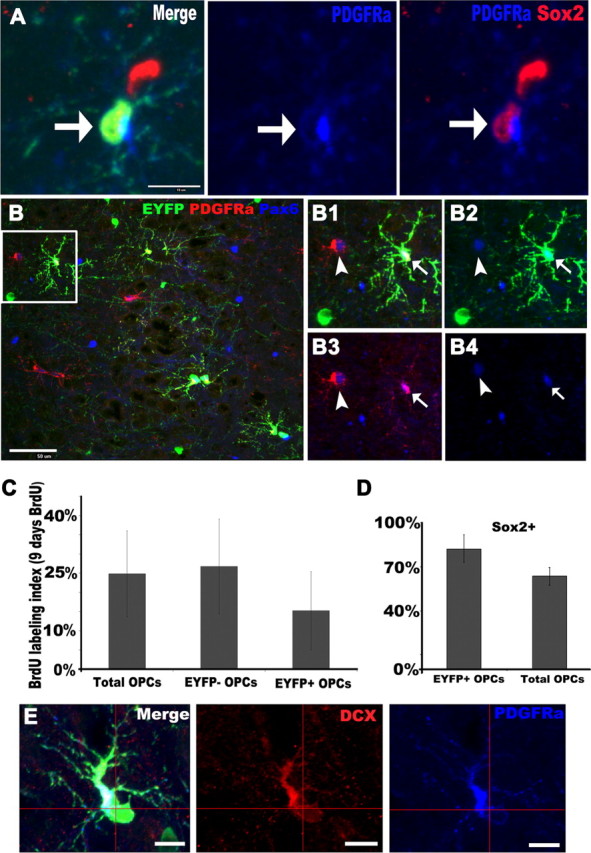
Phenotypic features of EYFP+ OPCs. A, Fluorescent micrographs depicting EYFP+ (green)/PDGFRα+ (blue) putative OPCs expressing the neural stem cell marker Sox2 (red). B, Triple staining for EYFP, PDGFRα (red), and Pax6 (blue) showing Pax6 expression in OPCs. The boxed area in B is shown at higher magnification in B1–B4. Both PDGFRα+ (arrowheads in B1–B4) and PDGFRα+/EYFP+ (arrows in B1–B4) displayed nuclear Pax6 immunoreactivity. C, BrdU labeling index in total OPCs, EYFP− OPCs, and EYFP+ OPCs, respectively, after 9 d BrdU administration in drinking water starting on P45. Note that the labeling index of EYFP+ OPCs was ∼10% lower than that of EYFP− OPCs. D, Percentages of EYFP+ OPCs and total OPCs that were Sox2+, respectively. E, EYFP+/ PDGFRα+ (blue) putative OPCs expressed DCX (red). Scale bars, 10 μm.
NSCs in the SGZ of the dentate gyrus, an established adult neurogenic area, express Sox2, an HMG box transcription factor characteristic of NSCs (Suh et al., 2007). Previous studies demonstrated that Sox2 is also expressed in a subpopulation of NG2+/PDGFRα+ progenitor cells not only in the SGZ (Hattiangady and Shetty, 2008) but also in Sox2–enhanced green fluorescent protein (EGFP) mice, in the SVZ and cerebral cortex (Brazel et al., 2005). To confirm and extend these evidences of Sox2 expression in cortical EYFP+/PDGFRα+ OPCs, we performed triple-immunofluorescence assays for Sox2, EYFP, and PDGFRα and identified Sox2+ cells that expressed EYFP and PDGFRα (Fig. 3A, arrows). In piriform cortex, 82.3% of EYFP+/PDGFRα+ cells and 63.6% of total PDGFRα+ cells expressed Sox2 (Fig. 3D).
In the developing brain, the transcription factor Pax6 is expressed in progenitors that are committed to give rise to glutamatergic neurons (Kallur et al., 2008). Intriguingly, we found that both PDGFRα+ cells (Fig. 3B1–B4, arrowheads) and EYFP+/PDGFRα+ cells (Fig. 3B1–B4, arrows) in piriform cortex displayed nuclear Pax6 immunoreactivity. The EYFP+/PDGFRα+ cells also expressed low-level DCX (compare Fig. 3E with Fig. 1B1–B3). The expression of DCX, Sox2, and Pax6 in OPCs was also consistent with previous gene microarray analyses (Dugas et al., 2006; Cahoy et al., 2008). Thus, EYFP+/PDGFRα+ progenitors in the piriform cortex display some features of neuronal progenitors. In contrast to NG2+ or PDGFRα+ OPCs, no PDGFRα−/Sox10+/EYFP+ mature oligodendrocytes expressed DCX, Sox2, or Pax6.
Generation of neurons from OPCs in the piriform cortex
Interestingly, at time points later than day 17 after TM treatment, increasing numbers of EYFP+ neurons became demonstrable in piriform cortex. The piriform cortex is a three-layer structure, layer II of which consists of packed principal neurons that receive sensory input from olfactory bulb (OB) via the lateral olfactory tract (Haberly, 2001). The EYFP+ neurons were located principally in layer II (Fig. 4A,B) and to a much less extent in layer III (Fig. 4B, wavy arrow), with no EYFP+ neurons in layer I. We used confocal z-sectioning to verify this colocalization of EYFP and neuronal markers. As shown in Figure 4A, the EYFP+ cell bodies were colabeled with HuCD at all levels of optical sections (Fig. 4A, boxed area, A1–A3, higher magnification). The presence of fate-mapped piriform neurons was validated and confirmed by EYFP and NeuN double staining (Fig. 4B). In some instances, only one of two closely apposed EYFP+ cell bodies was identified as a NeuN+ neuron (Fig. 4B1,B2), the other cell being NeuN negative (Fig. 4B3). To further confirm the presence of fate-mapped EYFP+ neurons, we double stained with SMI312, a pan-neurofilament antibody mixture that strongly labels axons (Soulika et al., 2009), and EYFP, which is expressed not only in soma but is also transported from the neuronal perikaryon to distal processes (Guo et al., 2009). As expected, some SMI312+ axons in piriform cortex were colabeled with EYFP (Fig. 4C3, box and higher magnification). Some SMI312 negative but EYFP+ apical dendrites (Fig. 4C, box and higher magnification), which expressed EYFP+ spines (Fig. 4C1, arrows) (see Fig. 8A1,A2), penetrated through layer II and layer Ib into layer Ia (Fig. 4C2), where they presumably formed synapses with axons extended from OB mitral cells (ul Quraish et al., 2004). The above data clearly demonstrated the presence of EYFP+ neurons in the piriform cortex.
Figure 4.

Generation of EYFP+ neurons from EYFP+ OPCs. A, EYFP+ and HuCD+ (red) double-positive neurons at 90 d after TM. A1–A3, Orthogonal images from confocal z-section levels of boxed cell in A showing definitive colocalization of EYFP and HuCD. B, Consistently, some EYFP+ cells were colabeled with NeuN (red) on 180 d after TM. Boxed area is shown in higher magnifications in orthogonal images of B1–B3. Wavy arrow in B points to a layer III EYFP+/NeuN+ neuron. Arrows in B1 and B2 show EYFP+/NeuN+ cells, whereas arrowheads in B3 depict EYFP+ cells that were NeuN negative. C, Double immunostaining for EYFP and SMI312 (red). White box is shown at higher magnification in C1 and C2. Arrows in C1 pointed to EYFP+ dendritic spines. C2, EYFP+/SMI312− dendrites with tiny spines extended through layer Ib into superficial layer Ia. C3–C6 showing EYFP+ neurites colocalized with SMI312 (arrows in C4–C6). D, Number of EYFP+/NeuN+ neuron neurons per 14-μm-thick section at different time points after TM. Note that there was an accumulation of EYFP+ neurons. E, At the same time, the percentage of EYFP+ OPCs among total OPCs decreased over time after TM. F, Quantification of NG2+ OPCs (cells/mm2) in 14 μm sections of piriform cortex during the ensuing days after TM. y-z and x-z in A1 and B1 means y–z and x–z two dimension, respectively. Scale bars, 50 μm.
Figure 8.

Evidences that OPC-derived piriform cortical neurons are functional. A1, EYFP and synapsin (Syn; red) double-fluorescent image shows many synapsin+ punctae (arrows) that were in close proximity to EYFP+ spines. A2, Gray image from A1 depicting the existence of many EYFP+ spines (arrows) along an EYFP+ dendrite. B1–B4, A preexisting NeuN+ (blue) neuron (arrows) expresses NR1 (red). Similarly, a newly generated EYFP+/NeuN+ neuron (arrowheads) displays NR1 immunoreactivity. C1, Triple-fluorescent image of EYFP, c-Fos (red), and NeuN (blue) depicting EYFP+/NeuN+ neuron that has nuclear c-Fos expression (arrow). C2, C3, Images of individual channels of cell indicated by arrow in C1. Ia, Layer Ia of piriform cortex; Ib, layer Ib. Scale bars, 10 μm.
Were these piriform cortical EYFP+ neurons ectopically expressed the PLP promoter (or alternatively Plp–Cre transgene) rather than having been derived from EYFP+ OPCs? If these neurons were generated from EYFP+ OPCs, (1) EYFP+ neurons should be absent from piriform cortex during the first few days or weeks after TM treatment, (2) the number of EYFP+ neurons in piriform cortex should gradually increase with time after TM treatment, and (3) EYFP+ neurons were negative for Cre immunoreactivity. All of these predictions proved to be correct. As shown in Figure 4D, there were no EYFP+ neurons in piriform cortex before 17 d after TM. From 17 d after TM, EYFP+ neurons began to appear in layer II of piriform cortex and increased 20-fold during the interval between days 17 and 180 after TM (Fig. 4D). Our quantification data showed that 0.4 ± 1.3, 3.35 ± 1.0, and 5.8 ± 1.6% of total EYFP+ cells expressed the neuronal marker NeuN on 17, 90, and 180 d after TM, respectively. During the same time interval, the percentage of EYFP+/NG2+ cells among total NG2+ cells dropped gradually, from 20.9% on day 17 after TM to 12.1% on 180 d after TM (Fig. 4E). We also quantified the frequency (cells per square millimeter) of piriform cortical NG2+ OPCs using immunohistochemistry and confocal imaging performed on 14 μm sections and found that this decreased during the 6 months after tamoxifen treatment (Fig. 4F). This reciprocal relationship between accumulation of EYFP+ neurons and decrease of EYFP+ OPCs strongly suggests that neurons are continuously being generated from OPCs in young adult mouse piriform cortex and that the OPCs involved in this process in the normal adult piriform cortex do not self-renew. Again, we did not see any Cre-immunoreactivity-positive NeuN+ or HuCD+ neurons (supplemental Fig. S3G,H, available at www.jneurosci.org as supplemental material) in piriform cortex at any of the time points we assessed.
Plp promoter activity has been reported in occasional hindbrain neurons (Miller et al., 2009). We evaluated Plp promoter activity distribution in adult forebrain using EYFP reporter and Cre expression in PCE/R mice based on the speculation that, if a cell expressed Plp promoter activity, it would be Cre immunoreactivity positive and become labeled with EYFP within the first several days after tamoxifen administration into these transgenic mice. At either 1 or 5 d after TM, we detected EYFP+ or Cre+ neurons in the caudate–putamen nucleus (CPu) (supplemental Fig. S3A–F, available at www.jneurosci.org as supplemental material), amygdalostriatal transition area (supplemental Fig. S3A–D, available at www.jneurosci.org as supplemental material), hypothalamic paraventricular and periventricular nucleus, and posteromedial cortical amygdaloid nucleus (data not shown), indicating that Plp promoter activity existed in neurons within these defined areas/nuclei. As expected, the numbers of these immediately after TM EYFP-labeled neurons did not change over time (supplemental Fig. S3, compare A, B, available at www.jneurosci.org as supplemental material) and were independent of age of the mouse (supplemental Fig. S3, compare C, D, available at www.jneurosci.org as supplemental material). However, in piriform cortex, in which we observed the generation of EYFP+ neurons, neither Cre-positive neurons nor EYFP+ neurons were detected shortly after TM treatment (supplemental Fig. S3G,H, available at www.jneurosci.org as supplemental material) and EYFP+/Cre− neurons progressively increased over time (Fig. 4D). These PLP promoter transgenic mouse results were consistent with Plp mRNA in situ hybridization data we obtained in adult wild-type mice (our unpublished data). Together, our data indicate that, unlike EYFP+/Cre+ neurons in CPu, EYFP+ neurons in piriform cortex were generated from EYFP+ OPCs.
Previous studies suggested that adult rodent and primate SVZ GFAP+ NSCs generate neurons that migrate to piriform cortex (Bernier et al., 2002; Shapiro et al., 2007). Were the piriform cortical EYFP+ neurons that we visualized also generated from SVZ NSCs? To address this issue, we analyzed EYFP expression in SVZ GFAP+ cells. Ten days after 5 d tamoxifen treatment, when recombination in OPCs had already reached a plateau level (Fig. 2D), there were no GFAP+ cells labeled with EYFP in the SVZ (at least four sections through dorsal and lateral SVZ from each of three mice) (Fig. 5A and higher magnification). Consistent with this observation, no DCX+ SVZ migrating neuroblasts expressed EYFP (Fig. 5B and higher magnification). As an additional means to exclude GFAP+ SVZ cells as the source for EYFP+ piriform neurons, we bred GFAP–Cre–ERT2/Rosa26–STOP–EYFP (GCE/R) double-transgenic mice (Ganat et al., 2006), and P60 GCE/R mice were treated using the same TM paradigm as that for PCE/R mice. No EYFP+ neurons were generated in the piriform cortex of these TM-treated GCE/R mice (supplemental Fig. S4E–E3, available at www.jneurosci.org as supplemental material), although SVZ GFAP+ cells were labeled with EYFP during TM treatment (supplemental Fig. S4D–D3, available at www.jneurosci.org as supplemental material). Collectively, our data excluded the possibility that the piriform cortical EYFP+ neurons originated from EYFP+ SVZ NSCs and indicated, instead, that, in young adult mice, EYFP+ neurons are generated in situ from EYFP+ OPCs.
Figure 5.

GFAP+ NSCs and DCX+ neuroblasts in SVZ are not labeled with EYFP. A, Fluorescent micrographs depicting the absence of EYFP expression in GFAP+ (red) neural stem cells of both dorsolateral and ventral tip of SVZ on day 10 after TM. Boxed area is shown at higher magnification in A1–A3. B, Consistently, no DCX++ (red) neuroblasts in SVZ expressed EYFP. B1–B3, Higher-magnification images of boxed area in B. CC, Corpus callosum; LV, lateral ventricle. Scale bars: A, B, 50 μm; B3, 30 μm.
OPCs generate immature neurons
To provide evidence that EYFP+ OPCs first generate immature EYFP+ neurons in piriform cortex, which then become mature EYFP+ neurons, we immunostained for EYFP together with DCX, HuCD, or NeuN. These studies demonstrated three distinct maturation states of EYFP+ cells in piriform cortex (Fig. 6A,B). EYFP+ progenitor cells expressed low-level DCX (Fig. 6A–A2) and were PDGFRα+ (Fig. 1B1–B3) but were negative for HuCD (Fig. 6A3). Some newly generated EYFP+ neurons had few or no fully developed neurites, colabeled with HuCD (Fig. 6B–B3, arrows), and expressed high-level DCX (Fig. 6B,B1, arrows), whereas mature neurons had downregulated DCX expression to undetectable levels and were positive for HuCD (Fig. 6B–B3, arrowheads and inserts) and NeuN (data not shown). To confirm the identity of immature EYFP+ neurons in piriform cortex, we demonstrated that the perikarya (Fig. 6C–C3, arrowheads) and neurites (Fig. 6C–C3, arrows) of these cells were immunolabeled with another immature neuronal marker, βIII-Tubulin (Tuj1), and that their nuclei were immunostained with Tbr1 (Fig. 6D–D3, arrows), a marker for postmitotic glutamatergic projection neurons (Englund et al., 2005). To gain additional insight into the time course of maturation of EYFP+ neurons after TM treatment, we measured the distance between the origin of the apical dendritic trunk and the termination of the apical dendritic tree and found that this distance progressively increased between 30 d (supplemental Fig. S5A,D, available at www.jneurosci.org as supplemental material), 90 d (supplemental Fig. S5B,D, available at www.jneurosci.org as supplemental material), and 150 d (supplemental Fig. S5C,D, available at www.jneurosci.org as supplemental material) after TM, respectively. To determine whether mitotically cycling or postmitotic OPCs were giving rise to EYFP+ neurons in piriform cortex, PCE/R mice were treated with BrdU in drinking water for 15 d, beginning simultaneously with initiation of intraperitoneal TM administration. We validated this BrdU labeling method by showing the presence of HuCD+/BrdU+ cells in neurogenic area SGZ (supplemental Fig. S6A, arrow, available at www.jneurosci.org as supplemental material). Although occasional EYFP+/NG2+ OPCs (supplemental Fig. S6B, available at www.jneurosci.org as supplemental material) and EYFP+/adenomatous polyposis coli-positive mature oligodendrocytes (supplemental Fig. S6C, available at www.jneurosci.org as supplemental material) were labeled with BrdU, we found that only two of a total of 320 EYFP+/HuCD+ neurons we assessed were labeled with BrdU (supplemental Fig. S6D, available at www.jneurosci.org as supplemental material), indicating that, with rare exceptions, EYFP+ neurons in the adult piriform cortex were derived from nonproliferating EYFP+ OPCs.
Figure 6.

OPCs generate immature neurons. A–A3, Triple-fluorescent confocal z-sections show an EYFP and low-level DCX (red) double-positive perineuronal progenitor that is adjacent to an HuCD+ (blue) neuron. B–B3, Arrows designating an immature neuron that expresses EYFP, HuCD (blue), and high-level DCX (red), with arrowheads and insets showing an example of mature neurons that display EYFP and HuCD (blue) expression and undetectable DCX (red). Cells pointed by arrowheads in B–B3 are shown as orthogonal views in corresponding insets. C–C3, Immature EYFP+ neurons are colabeled with Tuj1 (red) in both cell bodies (arrowheads) and neurites (arrows) in this single confocal slice. D–D3, EYFP+/HuCD+ (blue) neurons (arrows) show nuclear Tbr1 immunoreactivity (red). D1–D3, Single-channel view of image D. All pictures are taken from piriform cortex. Scale bars, 10 μm.
Morphology and phenotype of EYFP+ neurons
EYFP was expressed not only in the cell bodies of the labeled piriform neurons but also filled their proximal and distal processes, thus facilitating their morphological characterization. There are two major classes of excitatory principal neurons in piriform layer II and III, pyramidal neurons, and semilunar neurons (Suzuki and Bekkers, 2006). Essentially all EYFP+ neurons had the characteristic morphological features of pyramidal neurons. The NeuN+/EYFP+ neuron in Figure 7A displayed the typical morphology of a layer II pyramidal neuron: (1) a large cell body (usually >10 μm in diameter); (2) a single apical dendritic trunk with a diameter >1 μm (Fig. 7A, arrow) whose branches extend to superficial layer Ia; and (3) multiple basal dendrites extending to layer II and layer III (Fig. 7A, arrowheads). There was some variability in lengths of apical dendritic trunks of EYFP+ pyramidal neurons (Fig. 7B,C). Few if any EYFP+ neurons had the morphology of semilunar neurons, i.e., with fork-like apical dendrites and no basal dendrites.
Figure 7.

Morphology and phenotype of OPC-derived neurons. A, An EYFP+ neuron in layer II of piriform cortex displays typical morphology of pyramidal neurons. A single thick apical dendritic trunk (arrow) extending toward pial surface (top left) and branching at layer I (wavy arrow). Multiple basal dendrites (arrowheads) extending toward layers II and III. Inset in A shows EYFP and NeuN double immunostaining. B, C, EYFP fluorescence micrographs showing layer II pyramidal neurons with varied morphologies, including different lengths of apical dendritic trunks (arrows in B, C). Insets in B and C shows EYFP+/NeuN+ (red) cell bodies. D, An example of layer III EYFP+ large pyramidal neurons. E, Orthogonal view of EYFP and vGLUT1 (red) double-immunostaining micrograph. Note punctate vGLUT1 immunoreactivity in EYFP+ neuron (arrows). F, G, Large-sized EYFP+ neurons (arrows) were negative for GAD67 (red) and ChAT (red), respectively. Arrowheads in F point to GAD67+ cells. Inset in G shows a positive control of ChAT immunostaining from striatum area (Str). Scale bars: A–D, E, G, 10 μm; F, 50 μm.
To support our identification of EYFP+ adult OPC-derived piriform neurons as pyramidal neurons, we used immunohistology to examine their neurotransmitter specificities. Using confocal single optical slices, we localized punctate deposits of vesicular glutamate transporter 1 (vGLUT1) immunoreactivity to EYFP+ neurites (Fig. 7E, arrows). This is consistent with our previous observation that neonatal EYFP+ OPCs generated glutamatergic neurons that expressed vGLUT1 mRNA (Guo et al., 2009). We confirmed the glutamatergic phenotype of the EYFP+ neurons in adult piriform cortex by visualizing immunoreactive glutaminase (an enzyme responsible for converting glutamine to glutamate in glutamatergic neurons) in EYFP+/NeuN+ neurons (supplemental Fig. S7A, available at www.jneurosci.org as supplemental material). Also consistent with their glutamatergic nature, no EYFP+ piriform neurons expressed immunoreactive glutamic acid decarboxylase 67 kDa isoform (GAD67) (Fig. 7F, arrow), ChAT (Fig. 7G, arrow), or tyrosine hydroxylase (supplemental Fig. S5E, available at www.jneurosci.org as supplemental material), a dopaminergic neuron marker. Furthermore, none expressed interneurons markers, i.e., calretinin (supplemental Fig. S5B, available at www.jneurosci.org as supplemental material), somatostatin (supplemental Fig. S7C, available at www.jneurosci.org as supplemental material), or parvalbumin (supplemental Fig. S7D, available at www.jneurosci.org as supplemental material). Together, our data demonstrated that EYFP+ piriform neurons derived from adult OPCs were glutamatergic pyramidal neurons.
The extension of apical dendrites of the EYFP+ pyramidal neurons into superficial layer I (Fig. 7A–C), their expression of dendritic spines (Figs. 4C2, 8A2, arrows) and their long survival time (up to 300 d after TM) suggested that these OPC-derived neurons had become integrated into functional circuits. In support of this idea, we found that the EYFP+ spines were often in close proximity to punctate spots of synapsin, a presynaptic protein (Fig. 8A1, arrows), arguing that these EYFP+ neurons became synaptically integrated into the neuronal network (Jessberger et al., 2008). Because NMDA receptors play a role in controlling excitatory synaptic transmission, we explored whether these OPCs-derived neurons expressed NR1, an essential NMDA receptor subunit. Like their EYFP-negative counterparts (Fig. 8B2–B4, arrows), most piriform cortical EYFP+/NeuN+ neurons were NR1+ (Fig. 8B1–B4, arrowhead). To lend additional support to the hypothesis that these adult OPC-derived glutamatergic pyramidal neurons were functional, we immunostained for c-fos, an immediate early gene known to be expressed by newly generated neurons that have been integrated into neuronal circuits (Magavi et al., 2005; Brill et al., 2009; Ohira et al., 2010). The majority of OPC-derived EYFP+/NeuN+ neurons were colabeled with c-fos (Fig. 8C1, arrow and higher magnification).
Discussion
The present study demonstrates that, in young adult mice, NG2+/PDGFRα+ Plp PPEPs give rise to neurons in piriform cortex and provides novel information on both the expression of neurogenic markers by these cortical NG2+/PDGFRα+ PPEPs and on the phenotypes of the immature and mature neurons derived from this source. Although occasional neurons in other regions of the forebrain (e.g., CPu) expressed Plp promoter activity revealed by Cre immunoreactivity (supplemental Fig. S3F, available at www.jneurosci.org as supplemental material) and hence became EYFP+ early after initiation of tamoxifen injection to PCE/R double-transgenic mice (supplemental Fig. S3A–F, available at www.jneurosci.org as supplemental material), the lack of piriform cortex neuronal Plp promoter expression (supplemental Fig. S3G,H, available at www.jneurosci.org as supplemental material) and the kinetics of accumulation of EYFP+ neurons in the piriform cortex (Fig. 4D) were incompatible with the speculation that these EYFP+ neurons were derived from neurons that ectopically express EYFP, because there were virtually no EYFP+ neurons in piriform cortex before 17 d after TM (Fig. 2F,G), at which time point the recombination rate of OPCs had already reached a plateau level (Fig. 2D). Although we acknowledge that transgene activity does not necessarily equate to endogenous transcriptional activity, the observations that (1) all Cre+ cells were Sox10+ in piriform cortex (supplemental Fig. S3I–K, available at www.jneurosci.org as supplemental material), (2) no Cre+/HuCD+ or Cre+/NeuN+ cells were detected in piriform cortex at any of the time points we assessed (supplemental Fig. S3G,H, available at www.jneurosci.org as supplemental material), and (3) no EYFP+/NeuN+ (Fig. 2F) or EYFP+/HuCD+ (Fig. 2G) were detected shortly after TM treatment all argue for the fidelity with which the Plp–Cre transgene marked oligodendroglial lineage cells and not neurons in adult piriform cortex.
It is very unlikely that SVZ GFAP+ NSCs contributed to this adult cortical neurogenesis, because we did not detect any SVZ GFAP+ cells or DCX+ neuroblasts labeled with EYFP 10 d after TM treatment of PCE/R mice (Fig. 5), nor did we see EYFP+ piriform cortical neurons in GCE/R mice (supplemental Fig. S4D–E3, available at www.jneurosci.org as supplemental material). Furthermore, the EYFP+ neurons in adult piriform cortex in our study were glutamatergic pyramidal neurons rather than GABAergic interneurons, which are the most abundant neuronal type known to be derived from SVZ GFAP+ NSCs (Garcia et al., 2004; Inta et al., 2008). It has been shown that microglia can specifically fuse to apical dendrites of pyramidal neurons in retrovirus-mediated fate-mapping (Ackman et al., 2006). Bearing this in mind, we carefully assessed the EYFP expression in microglia and found no evidence of EYFP+/Iba-1+ (Fig. 2H) or EYFP+/CD11b+ (data not shown) microglia throughout all the time points.
EYFP+ neurons were much less common 60 d after TM (four EYFP+/NeuN+ cells of 1024 EYFP+ cells we counted from three mice) in piriform cortex of PCE/R mice in which tamoxifen was first administered to 100-d-old PCE/R mice (supplemental Fig. S4A–C, available at www.jneurosci.org as supplemental material). This result was consistent with the much lower number of EYFP+ OPCs in piriform cortex in these age mice (Fig. 2E), again supporting the conclusion that EYFP+ OPCs were the source of piriform cortical EYFP+ neurons.
The existence of adult neurogenesis in cerebral cortex from OPCs has been controversial. Zhu et al. (2008) reported that no neurons were fate-mapped from NG2+ progenitors in constitutive NG2–Cre mice. Their inability to detect fate-mapped cortical neurons in adult constitutive NG2–Cre mice, despite highly efficient recombination in the oligodendroglial lineage, may have been masked by a background of EYFP+ neurons resulting from ectopic Cre expression in cortex neurons (see The Jackson Laboratory website, mouse stock number 008533). Fate-mapping in adult Olig2–Cre–ERT2 mice also failed to demonstrate labeling of cortical neurons (Dimou et al., 2008), perhaps because they used older mice and a less robust tamoxifen treatment regimen than we used in the present study or, alternatively, because the Rosa26–EYFP reporter transgene is a better recombination indicator than Rosa26–EGFP or Z/EG transgenes (Young et al., 2010). In accord with our own results, fate-mapped piriform projection neurons were detected after intense tamoxifen treatment of young adult PDGFRα–Cre–ERT2 mice (Rivers et al., 2008).
High-level DCX is expressed by migrating and immature neurons in SVZ–rostral migratory stream–OB and SGZ of dentate gyrus, two well established adult neurogenic areas (Gage, 2000). DCX is also expressed in other forebrain areas, for example, cerebral cortex including neocortex and piriform cortex (Tamura et al., 2007; Gómez-Climent et al., 2008; Luzzati et al., 2009), corpus callosum and striatum (Yang et al., 2004), and hypothalamus (supplemental Fig. S2E, available at www.jneurosci.org as supplemental material). Although some of cortical DCX-expressing cells were identified as belonging to neuronal lineages, the identity of a large number of remnant cortical DCX+ cells is unknown (Yang et al., 2004; Walker et al., 2007). Here we present evidence that there are two populations of DCX+ cells in piriform cortex. As reported previously (Gómez-Climent et al., 2008), we confirmed that the high-level DCX+ cells are neuronal lineage (Fig. 1D–D3), whereas the low-level DCX-expressing subpopulation were positive for PDGFRα (Fig. 1A1–B3) and Sox10 (Fig. 1G1–G4), designating them as putative OPCs instead of neuronal progenitors (Aguirre and Gallo, 2004).
Few EYFP+ neurons incorporated BrdU (supplemental Fig. S4, available at www.jneurosci.org as supplemental material). This result is similar to the observation by Rivers et al. (2008) in PDGFRα–Cre–ERT2 mice. There are two possible explanations for the almost complete lack of EYFP+/BrdU+ neurons in adult piriform cortex despite prolonged administration of BrdU in drinking water. First, the EYFP+ neurons may have originated from predominantly postmitotic EYFP+ OPCs, which comprise ∼85% of total EYFP+ OPCs quantified in our study (Fig. 3C). This explanation would be consistent with our previous report (Guo et al., 2009) of substantial numbers of EYFP+/BrdU+ neurons when fate-mapping neonatal PCE/R mice, in which a much greater proportion of EYFP+ OPCs are mitotic than in adults. Alternatively, EYFP+ neurons may, in fact, be derived from mitotically cycling OPCs, but these cycling adult OPCs, although possible to label by intracerebroventricular administration of BrdU, are not efficiently labeled by systemically administered BrdU (Kokoeva et al., 2005, 2007).
The piriform cortex we analyzed spans ∼1.3 mm from bregma −2.30 mm to −1.06 mm. Approximately 0.98% of total layer II and III NeuN+ neurons expressed EYFP at 182 d after TM. By day 182 after TM, there were ∼17 EYFP+ neurons per 14 μm section (Fig. 4D). Approximately 0.1 EYFP+ neuron was added per 14 μm section of piriform cortex per day during the 180 d after tamoxifen treatment was initiated (17/182 = 0.093). Therefore, ∼10 [0.1 × (1300/14) = 9.3] FP+ neurons were added to adult piriform cortex daily, which would correspond to ∼46 total neurons added [17 ÷ 182 × (1300/14) ÷ 0.2 ≈ 46], if the ∼20% recombination rate in total NG2+/PDGFRα+ cells is taken into account. The discrepancy between our calculated result and previous data (24 neurons) (Rivers et al., 2008) may have been attributable to the location along the anteroposterior axis that was evaluated; our data were gathered from posterior piriform cortex, whereas they focused their study on anterior piriform cortex. Alternately, the rate of neuronogenesis from Pip promoter+/PDGFRα+ OPCs is greater than that in the overall pool of PDGFRα+ OPCs.
Our data strongly suggest that OPC-derived neurons became integrated into the neuronal network in adult piriform cortex. What is their functional role? The piriform cortex is not only the first and largest destination for input from the olfactory bulb but also acts as an association cortex that integrates sensory information from the environment with behavioral, contextual, and cognitive input (Haberly, 2001). Given the importance of layer II pyramidal neurons, the role of piriform cortex, and the continuous replacement of olfactory bulb interneurons, we hypothesize that the continued addition of OPC-derived neurons to piriform cortex during adulthood is important in preserving the capacity for olfactory discrimination learning and memory and is driven by continued olfactory bulb input. Consistent with this hypothesis, pyramidal neurons in piriform cortex selectively undergo apoptosis after total bulbectomy (Capurso et al., 1997). Together, our findings prove that PLP promoter-expressing OPCs continue to generate glutamatergic pyramidal neurons in the adult piriform cortex.
Footnotes
This work was supported by the Shriners Hospitals for Children (F.G., D.P.), the California Institute for Regenerative Medicine (F.G., J.M., D.P.), and National Institutes of Health Grant RO1NS025044 (D.P.).
References
- Ackman JB, Siddiqi F, Walikonis RS, LoTurco JJ. Fusion of microglia with pyramidal neurons after retroviral infection. J Neurosci. 2006;26:11413–11422. doi: 10.1523/JNEUROSCI.3340-06.2006. [DOI] [PMC free article] [PubMed] [Google Scholar]
- Aguirre A, Gallo V. Postnatal neurogenesis and gliogenesis in the olfactory bulb from NG2-expressing progenitors of the subventricular zone. J Neurosci. 2004;24:10530–10541. doi: 10.1523/JNEUROSCI.3572-04.2004. [DOI] [PMC free article] [PubMed] [Google Scholar]
- Aguirre AA, Chittajallu R, Belachew S, Gallo V. NG2-expressing cells in the subventricular zone are type C-like cells and contribute to interneuron generation in the postnatal hippocampus. J Cell Biol. 2004;165:575–589. doi: 10.1083/jcb.200311141. [DOI] [PMC free article] [PubMed] [Google Scholar]
- Arvidsson A, Collin T, Kirik D, Kokaia Z, Lindvall O. Neuronal replacement from endogenous precursors in the adult brain after stroke. Nat Med. 2002;8:963–970. doi: 10.1038/nm747. [DOI] [PubMed] [Google Scholar]
- Belachew S, Chittajallu R, Aguirre AA, Yuan X, Kirby M, Anderson S, Gallo V. Postnatal NG2 proteoglycan-expressing progenitor cells are intrinsically multipotent and generate functional neurons. J Cell Biol. 2003;161:169–186. doi: 10.1083/jcb.200210110. [DOI] [PMC free article] [PubMed] [Google Scholar]
- Bergles DE, Roberts JD, Somogyi P, Jahr CE. Glutamatergic synapses on oligodendrocyte precursor cells in the hippocampus. Nature. 2000;405:187–191. doi: 10.1038/35012083. [DOI] [PubMed] [Google Scholar]
- Bernier PJ, Bedard A, Vinet J, Levesque M, Parent A. Newly generated neurons in the amygdala and adjoining cortex of adult primates. Proc Natl Acad Sci U S A. 2002;99:11464–11469. doi: 10.1073/pnas.172403999. [DOI] [PMC free article] [PubMed] [Google Scholar]
- Brazel CY, Limke TL, Osborne JK, Miura T, Cai J, Pevny L, Rao MS. Sox2 expression defines a heterogeneous population of neurosphere-forming cells in the adult murine brain. Aging Cell. 2005;4:197–207. doi: 10.1111/j.1474-9726.2005.00158.x. [DOI] [PubMed] [Google Scholar]
- Brill MS, Ninkovic J, Winpenny E, Hodge RD, Ozen I, Yang R, Lepier A, Gascón S, Erdelyi F, Szabo G, Parras C, Guillemot F, Frotscher M, Berninger B, Hevner RF, Raineteau O, Götz M. Adult generation of glutamatergic olfactory bulb interneurons. Nat Neurosci. 2009;12:1524–1533. doi: 10.1038/nn.2416. [DOI] [PMC free article] [PubMed] [Google Scholar]
- Butt AM, Duncan A, Hornby MF, Kirvell SL, Hunter A, Levine JM, Berry M. Cells expressing the NG2 antigen contact nodes of Ranvier in adult CNS white matter. Glia. 1999;26:84–91. [PubMed] [Google Scholar]
- Cahoy JD, Emery B, Kaushal A, Foo LC, Zamanian JL, Christopherson KS, Xing Y, Lubischer JL, Krieg PA, Krupenko SA, Thompson WJ, Barres BA. A transcriptome database for astrocytes, neurons, and oligodendrocytes: a new resource for understanding brain development and function. J Neurosci. 2008;28:264–278. doi: 10.1523/JNEUROSCI.4178-07.2008. [DOI] [PMC free article] [PubMed] [Google Scholar]
- Capurso SA, Calhoun ME, Sukhov RR, Mouton PR, Price DL, Koliatsos VE. Deafferentation causes apoptosis in cortical sensory neurons in the adult rat. J Neurosci. 1997;17:7372–7384. doi: 10.1523/JNEUROSCI.17-19-07372.1997. [DOI] [PMC free article] [PubMed] [Google Scholar]
- Chittajallu R, Aguirre A, Gallo V. NG2-positive cells in the mouse white and grey matter display distinct physiological properties. J Physiol. 2004;561:109–122. doi: 10.1113/jphysiol.2004.074252. [DOI] [PMC free article] [PubMed] [Google Scholar]
- Dawson MR, Polito A, Levine JM, Reynolds R. NG2-expressing glial progenitor cells: an abundant and widespread population of cycling cells in the adult rat CNS. Mol Cell Neurosci. 2003;24:476–488. doi: 10.1016/s1044-7431(03)00210-0. [DOI] [PubMed] [Google Scholar]
- Dayer AG, Cleaver KM, Abouantoun T, Cameron HA. New GABAergic interneurons in the adult neocortex and striatum are generated from different precursors. J Cell Biol. 2005;168:415–427. doi: 10.1083/jcb.200407053. [DOI] [PMC free article] [PubMed] [Google Scholar]
- De Biase LM, Nishiyama A, Bergles DE. Excitability and synaptic communication within the oligodendrocyte lineage. J Neurosci. 2010;30:3600–3611. doi: 10.1523/JNEUROSCI.6000-09.2010. [DOI] [PMC free article] [PubMed] [Google Scholar]
- Dimou L, Simon C, Kirchhoff F, Takebayashi H, Götz M. Progeny of Olig2-expressing progenitors in the gray and white matter of the adult mouse cerebral cortex. J Neurosci. 2008;28:10434–10442. doi: 10.1523/JNEUROSCI.2831-08.2008. [DOI] [PMC free article] [PubMed] [Google Scholar]
- Doerflinger NH, Macklin WB, Popko B. Inducible site-specific recombination in myelinating cells. Genesis. 2003;35:63–72. doi: 10.1002/gene.10154. [DOI] [PubMed] [Google Scholar]
- Dugas JC, Tai YC, Speed TP, Ngai J, Barres BA. Functional genomic analysis of oligodendrocyte differentiation. J Neurosci. 2006;26:10967–10983. doi: 10.1523/JNEUROSCI.2572-06.2006. [DOI] [PMC free article] [PubMed] [Google Scholar]
- Englund C, Fink A, Lau C, Pham D, Daza RA, Bulfone A, Kowalczyk T, Hevner RF. Pax6, Tbr2, and Tbr1 are expressed sequentially by radial glia, intermediate progenitor cells, and postmitotic neurons in developing neocortex. J Neurosci. 2005;25:247–251. doi: 10.1523/JNEUROSCI.2899-04.2005. [DOI] [PMC free article] [PubMed] [Google Scholar]
- Etxeberria A, Mangin JM, Aguirre A, Gallo V. Adult-born SVZ progenitors receive transient synapses during remyelination in corpus callosum. Nat Neurosci. 2010;13:287–289. doi: 10.1038/nn.2500. [DOI] [PMC free article] [PubMed] [Google Scholar]
- Franklin KBJ, Paxinos G. Ed 3. San Diego: Academic; 2008. The mouse brain in stereotaxic coordinates. [Google Scholar]
- Gage FH. Mammalian neural stem cells. Science. 2000;287:1433–1438. doi: 10.1126/science.287.5457.1433. [DOI] [PubMed] [Google Scholar]
- Gallo V, Zhou JM, McBain CJ, Wright P, Knutson PL, Armstrong RC. Oligodendrocyte progenitor cell proliferation and lineage progression are regulated by glutamate receptor-mediated K+ channel block. J Neurosci. 1996;16:2659–2670. doi: 10.1523/JNEUROSCI.16-08-02659.1996. [DOI] [PMC free article] [PubMed] [Google Scholar]
- Ganat YM, Silbereis J, Cave C, Ngu H, Anderson GM, Ohkubo Y, Ment LR, Vaccarino FM. Early postnatal astroglial cells produce multilineage precursors and neural stem cells in vivo. J Neurosci. 2006;26:8609–8621. doi: 10.1523/JNEUROSCI.2532-06.2006. [DOI] [PMC free article] [PubMed] [Google Scholar]
- Garcia AD, Doan NB, Imura T, Bush TG, Sofroniew MV. GFAP-expressing progenitors are the principal source of constitutive neurogenesis in adult mouse forebrain. Nat Neurosci. 2004;7:1233–1241. doi: 10.1038/nn1340. [DOI] [PubMed] [Google Scholar]
- Gómez-Climent MA, Castillo-Gómez E, Varea E, Guirado R, Blasco-Ibáñez JM, Crespo C, Martínez-Guijarro FJ, Nácher J. A population of prenatally generated cells in the rat paleocortex maintains an immature neuronal phenotype into adulthood. Cereb Cortex. 2008;18:2229–2240. doi: 10.1093/cercor/bhm255. [DOI] [PubMed] [Google Scholar]
- Gould E. How widespread is adult neurogenesis in mammals? Nat Rev Neurosci. 2007;8:481–488. doi: 10.1038/nrn2147. [DOI] [PubMed] [Google Scholar]
- Gould E, Reeves AJ, Graziano MS, Gross CG. Neurogenesis in the neocortex of adult primates. Science. 1999;286:548–552. doi: 10.1126/science.286.5439.548. [DOI] [PubMed] [Google Scholar]
- Guo F, Ma J, McCauley E, Bannerman P, Pleasure D. Early postnatal proteolipid promoter-expressing progenitors produce multilineage cells in vivo. J Neurosci. 2009;29:7256–7270. doi: 10.1523/JNEUROSCI.5653-08.2009. [DOI] [PMC free article] [PubMed] [Google Scholar]
- Haberly LB. Parallel-distributed processing in olfactory cortex: new insights from morphological and physiological analysis of neuronal circuitry. Chem Senses. 2001;26:551–576. doi: 10.1093/chemse/26.5.551. [DOI] [PubMed] [Google Scholar]
- Hattiangady B, Shetty AK. Aging does not alter the number or phenotype of putative stem/progenitor cells in the neurogenic region of the hippocampus. Neurobiol Aging. 2008;29:129–147. doi: 10.1016/j.neurobiolaging.2006.09.015. [DOI] [PMC free article] [PubMed] [Google Scholar]
- Horiuchi M, Lindsten T, Pleasure D, Itoh T. Differing in vitro survival dependency of mouse and rat NG2(+) oligodendroglial progenitor cells. J Neurosci Res. 2010;88:957–970. doi: 10.1002/jnr.22262. [DOI] [PMC free article] [PubMed] [Google Scholar]
- Inta D, Alfonso J, von Engelhardt J, Kreuzberg MM, Meyer AH, van Hooft JA, Monyer H. Neurogenesis and widespread forebrain migration of distinct GABAergic neurons from the postnatal subventricular zone. Proc Natl Acad Sci U S A. 2008;105:20994–20999. doi: 10.1073/pnas.0807059105. [DOI] [PMC free article] [PubMed] [Google Scholar]
- Jessberger S, Aigner S, Clemenson GD, Jr, Toni N, Lie DC, Karalay O, Overall R, Kempermann G, Gage FH. Cdk5 regulates accurate maturation of newborn granule cells in the adult hippocampus. PLoS Biol. 2008;6:e272. doi: 10.1371/journal.pbio.0060272. [DOI] [PMC free article] [PubMed] [Google Scholar]
- Kallur T, Gisler R, Lindvall O, Kokaia Z. Pax6 promotes neurogenesis in human neural stem cells. Mol Cell Neurosci. 2008;38:616–628. doi: 10.1016/j.mcn.2008.05.010. [DOI] [PubMed] [Google Scholar]
- Káradóttir R, Hamilton NB, Bakiri Y, Attwell D. Spiking and nonspiking classes of oligodendrocyte precursor glia in CNS white matter. Nat Neurosci. 2008;11:450–456. doi: 10.1038/nn2060. [DOI] [PMC free article] [PubMed] [Google Scholar]
- Kokoeva MV, Yin H, Flier JS. Neurogenesis in the hypothalamus of adult mice: potential role in energy balance. Science. 2005;310:679–683. doi: 10.1126/science.1115360. [DOI] [PubMed] [Google Scholar]
- Kokoeva MV, Yin H, Flier JS. Evidence for constitutive neural cell proliferation in the adult murine hypothalamus. J Comp Neurol. 2007;505:209–220. doi: 10.1002/cne.21492. [DOI] [PubMed] [Google Scholar]
- Kondo T, Raff M. Oligodendrocyte precursor cells reprogrammed to become multipotential CNS stem cells. Science. 2000;289:1754–1757. doi: 10.1126/science.289.5485.1754. [DOI] [PubMed] [Google Scholar]
- Luzzati F, Bonfanti L, Fasolo A, Peretto P. DCX and PSA-NCAM expression identifies a population of neurons preferentially distributed in associative areas of different pallial derivatives and vertebrate species. Cereb Cortex. 2009;19:1028–1041. doi: 10.1093/cercor/bhn145. [DOI] [PubMed] [Google Scholar]
- Magavi SS, Leavitt BR, Macklis JD. Induction of neurogenesis in the neocortex of adult mice. Nature. 2000;405:951–955. doi: 10.1038/35016083. [DOI] [PubMed] [Google Scholar]
- Magavi SS, Mitchell BD, Szentirmai O, Carter BS, Macklis JD. Adult-born and preexisting olfactory granule neurons undergo distinct experience-dependent modifications of their olfactory responses in vivo. J Neurosci. 2005;25:10729–10739. doi: 10.1523/JNEUROSCI.2250-05.2005. [DOI] [PMC free article] [PubMed] [Google Scholar]
- Mallon BS, Shick HE, Kidd GJ, Macklin WB. Proteolipid promoter activity distinguishes two populations of NG2-positive cells throughout neonatal cortical development. J Neurosci. 2002;22:876–885. doi: 10.1523/JNEUROSCI.22-03-00876.2002. [DOI] [PMC free article] [PubMed] [Google Scholar]
- Mangin JM, Kunze A, Chittajallu R, Gallo V. Satellite NG2 progenitor cells share common glutamatergic inputs with associated interneurons in the mouse dentate gyrus. J Neurosci. 2008;28:7610–7623. doi: 10.1523/JNEUROSCI.1355-08.2008. [DOI] [PMC free article] [PubMed] [Google Scholar]
- Miller MJ, Kangas CD, Macklin WB. Neuronal expression of the proteolipid protein gene in the medulla of the mouse. J Neurosci Res. 2009;87:2842–2853. doi: 10.1002/jnr.22121. [DOI] [PubMed] [Google Scholar]
- Nowakowski RS, Lewin SB, Miller MW. Bromodeoxyuridine immunohistochemical determination of the lengths of the cell cycle and the DNA-synthetic phase for an anatomically defined population. J Neurocytol. 1989;18:311–318. doi: 10.1007/BF01190834. [DOI] [PubMed] [Google Scholar]
- Ohira K, Furuta T, Hioki H, Nakamura KC, Kuramoto E, Tanaka Y, Funatsu N, Shimizu K, Oishi T, Hayashi M, Miyakawa T, Kaneko T, Nakamura S. Ischemia-induced neurogenesis of neocortical layer 1 progenitor cells. Nat Neurosci. 2010;13:173–179. doi: 10.1038/nn.2473. [DOI] [PubMed] [Google Scholar]
- Raff MC, Miller RH, Noble M. A glial progenitor cell that develops in vitro into an astrocyte or an oligodendrocyte depending on culture medium. Nature. 1983;303:390–396. doi: 10.1038/303390a0. [DOI] [PubMed] [Google Scholar]
- Rivers LE, Young KM, Rizzi M, Jamen F, Psachoulia K, Wade A, Kessaris N, Richardson WD. PDGFRA/NG2 glia generate myelinating oligodendrocytes and piriform projection neurons in adult mice. Nat Neurosci. 2008;11:1392–1401. doi: 10.1038/nn.2220. [DOI] [PMC free article] [PubMed] [Google Scholar]
- Shapiro LA, Ng KL, Kinyamu R, Whitaker-Azmitia P, Geisert EE, Blurton-Jones M, Zhou QY, Ribak CE. Origin, migration and fate of newly generated neurons in the adult rodent piriform cortex. Brain Struct Funct. 2007;212:133–148. doi: 10.1007/s00429-007-0151-3. [DOI] [PubMed] [Google Scholar]
- Soulika AM, Lee E, McCauley E, Miers L, Bannerman P, Pleasure D. Initiation and progression of axonopathy in experimental autoimmune encephalomyelitis. J Neurosci. 2009;29:14965–14979. doi: 10.1523/JNEUROSCI.3794-09.2009. [DOI] [PMC free article] [PubMed] [Google Scholar]
- Srinivas S, Watanabe T, Lin CS, William CM, Tanabe Y, Jessell TM, Costantini F. Cre reporter strains produced by targeted insertion of EYFP and ECFP into the ROSA26 locus. BMC Dev Biol. 2001;1:4. doi: 10.1186/1471-213X-1-4. [DOI] [PMC free article] [PubMed] [Google Scholar]
- Suh H, Consiglio A, Ray J, Sawai T, D'Amour KA, Gage FH. In vivo fate analysis reveals the multipotent and self-renewal capacities of Sox2+ neural stem cells in the adult hippocampus. Cell Stem Cell. 2007;1:515–528. doi: 10.1016/j.stem.2007.09.002. [DOI] [PMC free article] [PubMed] [Google Scholar]
- Suzuki N, Bekkers JM. Neural coding by two classes of principal cells in the mouse piriform cortex. J Neurosci. 2006;26:11938–11947. doi: 10.1523/JNEUROSCI.3473-06.2006. [DOI] [PMC free article] [PubMed] [Google Scholar]
- Tamura Y, Kataoka Y, Cui Y, Takamori Y, Watanabe Y, Yamada H. Multi-directional differentiation of doublecortin- and NG2-immunopositive progenitor cells in the adult rat neocortex in vivo. Eur J Neurosci. 2007;25:3489–3498. doi: 10.1111/j.1460-9568.2007.05617.x. [DOI] [PubMed] [Google Scholar]
- Tsai PT, Ohab JJ, Kertesz N, Groszer M, Matter C, Gao J, Liu X, Wu H, Carmichael ST. A critical role of erythropoietin receptor in neurogenesis and post-stroke recovery. J Neurosci. 2006;26:1269–1274. doi: 10.1523/JNEUROSCI.4480-05.2006. [DOI] [PMC free article] [PubMed] [Google Scholar]
- ul Quraish A, Yang J, Murakami K, Oda S, Takayanagi M, Kimura A, Kakuta S, Kishi K. Quantitative analysis of axon collaterals of single superficial pyramidal cells in layer IIb of the piriform cortex of the guinea pig. Brain Res. 2004;1026:84–94. doi: 10.1016/j.brainres.2004.07.085. [DOI] [PubMed] [Google Scholar]
- Walker TL, Yasuda T, Adams DJ, Bartlett PF. The doublecortin-expressing population in the developing and adult brain contains multipotential precursors in addition to neuronal-lineage cells. J Neurosci. 2007;27:3734–3742. doi: 10.1523/JNEUROSCI.5060-06.2007. [DOI] [PMC free article] [PubMed] [Google Scholar]
- Yang HK, Sundholm-Peters NL, Goings GE, Walker AS, Hyland K, Szele FG. Distribution of doublecortin expressing cells near the lateral ventricles in the adult mouse brain. J Neurosci Res. 2004;76:282–295. doi: 10.1002/jnr.20071. [DOI] [PubMed] [Google Scholar]
- Young KM, Mitsumori T, Pringle N, Grist M, Kessaris N, Richardson WD. An Fgfr3-iCreER(T2) transgenic mouse line for studies of neural stem cells and astrocytes. Glia. 2010;58:943–953. doi: 10.1002/glia.20976. [DOI] [PMC free article] [PubMed] [Google Scholar]
- Yuan X, Eisen AM, McBain CJ, Gallo V. A role for glutamate and its receptors in the regulation of oligodendrocyte development in cerebellar tissue slices. Development. 1998;125:2901–2914. doi: 10.1242/dev.125.15.2901. [DOI] [PubMed] [Google Scholar]
- Zhu X, Bergles DE, Nishiyama A. NG2 cells generate both oligodendrocytes and gray matter astrocytes. Development. 2008;135:145–157. doi: 10.1242/dev.004895. [DOI] [PubMed] [Google Scholar]