Abstract
Chronic shoulder impingement is a common problem for manual wheelchair users. The loading associated with performing manual wheelchair activities of daily living is substantial and often at a high frequency. Musculoskeletal modeling and optimization techniques can be used to estimate the joint contact forces occurring at the shoulder to assess the soft tissue loading during an activity and to possibly identify activities and strategies that place manual wheelchair users at risk for shoulder injuries. The purpose of this study was to validate an upper extremity musculoskeletal model and apply the model to wheelchair activities for analysis of the estimated joint contact forces. Upper extremity kinematics and handrim wheelchair kinetics were measured over three conditions: level propulsion, ramp propulsion, and a weight relief lift. The experimental data were used as input to a subject-specific musculoskeletal model utilizing optimization to predict joint contact forces of the shoulder during all conditions. The model was validated using a mean absolute error calculation. Model results confirmed that ramp propulsion and weight relief lifts place the shoulder under significantly higher joint contact loading than level propulsion. In addition, they exhibit large superior contact forces that could contribute to impingement. This study highlights the potential impingement risk associated with both the ramp and weight relief lift activities. Level propulsion was shown to have a low relative risk of causing injury, but with consideration of the frequency with which propulsion is performed, this observation is not conclusive.
Keywords: Wheelchair, Musculoskeletal model, Joint contact forces, Shoulder
1. Introduction
It is well established that individuals with spinal cord injury (SCI) have a high prevalence of shoulder pain. The most common etiology of shoulder pain is reported to be chronic impingement syndrome (Bayley et al., 1987; Sie et al., 1992; Requejo and Mulrouy, 2008). Investigators have previously attributed shoulder pathology in individuals with SCI to long duration wheelchair propulsion and high load activities such as transfers and weight-relief activities (Mercer et al., 2006). In a study by Curtis et al. (1999), over 200 manual wheelchair users completed the Wheelchair User’s Shoulder Pain Index, and the highest intensities of shoulder pain were reported during manual wheelchair propulsion on inclines and for propulsion longer than 10 min.
Numerous studies have documented high mechanical loads on the upper extremity (UE) during handrim wheelchair propulsion (Rodgers et al., 1994; Robertson et al., 1996; Boninger et al., 1997, 1999, 2000, 2002; Kulig et al., 1998; Veeger et al., 2002; Rozendaal and Veeger, 2003) using primarily inverse dynamics to aid in explaining the link between propulsion activities and pain. While providing useful data and insights, the clinical interpretation made from model-estimated intersegmental forces and moments calculated from inverse dynamics is limited. The forces do not estimate joint surface loading (joint contact force), and the joint moment is only an estimate of the net activity of all muscle groups crossing a particular joint. As it is unfeasible to measure in vivo joint contact forces without an invasive procedure (Bergmann et al., 2007; Westerhoff et al., 2009), more complex musculoskeletal modeling and optimization techniques are required to estimate the contact forces and individual muscle contributions to the joint moment. To that end, there have been investigations utilizing optimization methods to solve the indeterminate muscle force distribution problem at the shoulder joint during wheelchair propulsion (Veeger et al., 2002; Lin et al., 2004; van Drongelen et al., 2005, 2006; Dubowsky et al., 2008). The initial focus of this research was to characterize muscle activation patterns and joint loading during level propulsion and eventually it expanded to include more demanding tasks such as weight relief lifting, reaching, and alterations to wheelchair axle placement.
The purpose of this study was to validate an upper extremity musculoskeletal model and apply the model to wheelchair activities for analysis of the estimated glenohumeral joint contact forces. Three activities were analyzed in this study: level propulsion, ramp propulsion, and weight relief lifts. These three wheelchair conditions have yet to be compared within the same model, and this is the first study to investigate the joint loading during ramp propulsion. The focus of the analysis was on addressing relative magnitudes of detrimental compressive contact forces that potentially contribute to shoulder impingement syndrome.
2. Methods
2.1. Subjects
Twelve experienced manual wheelchair users without any current upper extremity injury were recruited for study participation (Morrow et al., 2009). All participants were between 29 and 56 years old (average age of 43 ± 6.4 years) and had a minimum of one year of experience as a manual wheelchair user (average 18 ± 9.0 years of experience, range of 1–29 years). The study protocol was approved by the Mayo Clinic Institutional Review Board and informed consent was obtained from all research participants before initiating test procedures.
2.2. Instrumentation and data collection
Handrim kinetic data were collected using SmartWheel devices (Three Rivers Holdings, Mesa, AZ) and upper extremity kinematic data were recorded using a 10 camera Real-time Eagle Motion Analysis system (Motion Analysis Corp., Santa Rosa, CA) as described by Morrow et al. (2009). Shoulder muscle activities were collected with EMG surface electrodes (Motion Labs, MA-300, Baton Rouge, LA) unilaterally on seven muscle groups of the right arm: biceps brachii, triceps brachii, anterior deltoid, middle deltoid, posterior deltoid, pectoralis major, and latissimus dorsi. For each muscle, a quiescent trial and maximum voluntary contraction (MVC) were collected. EMG data were bandpass filtered from 10 to 1000 Hz before they were sampled at 2400 Hz. All EMG data were synchronized with kinematic data, and post-processed with custom-written software as described by Ringleb et al. (2007). Three dynamic conditions were evaluated in the following order: level propulsion, ramp propulsion up a 1:12 incline, and during a weight relief maneuver as described by Morrow et al. (2009).
2.3. Model description
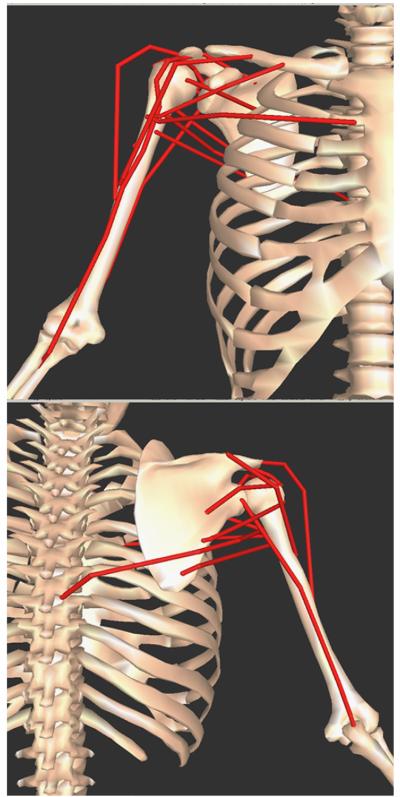
A three-dimensional rigid body model and inverse dynamics model of the right UE (trunk, upper arm, forearm, and hand) was developed using Visual3D (C-Motion Inc., Germantown, MD) (Morrow et al., 2009). The inverse dynamics results were used as input into an UE musculoskeletal and optimization model comprised of 13 muscle bundles crossing the right shoulder complex (Fig. 1). The shoulder is assumed to be a frictionless ball and socket joint (Lin et al., 2004). Kinematics for the condition trials were input into SIMM (Software for Interactive Muskuloskeletal Modeling; Musculographics, Inc., Santa Rosa, CA) (Holzbaur et al., 2005) where a validated subject-specific (based on marker locations and body mass) model of the UE was constructed to define muscle attachment points relative to local coordinate systems of the humerus, scapula, and thorax. Instantaneous muscle lengths (l), fiber lengths, and muscle orientations were calculated in SIMM over the propulsion cycle using known joint orientations. The muscle orientation and length data in addition to the intersegmental shoulder kinetics served as input into a custom optimization muscle model developed in MATLAB (Mathworks Inc., Natick, MA.). For calculating the muscle geometries in SIMM an assumed scapular rhythm is used to describe scapular motion relative to humeral motion (Holzbaur et al., 2005).
Fig. 1.
Musculoskeletal upper extremity model of the right shoulder from SIMM (Holzbaur et al., 2005). Top: anterior view; Bottom: posterior view. Muscle paths (red lines) represented: anterior deltoid, middle deltoid, posterior deltoid, supraspinatus, infraspinatus, subscapularis, teres minor, teres major, pectoralis major (clavicle attachment), pectoralis major (sternum attachment), latissimus dorsi, triceps long head, and biceps long head. (For interpretation of the references to colour in this figure legend, the reader is referred to the web version of this article.)
The optimization muscle model determined the distribution of muscle forces and joint contact forces given defined optimization criteria. The Hill-type muscle model was used to define each muscle actuator with its respective active and passive elements (Zajac, 1989). Muscle specific parameters such as physiological cross-sectional area (PCSA), index of architecture (ia), and optimal muscle length (lo) were used as reported by Langenderfer et al. (2004). In addition, fiber type compositions of the muscles represented in the model were determined by Srinivasan et al. (2007), and the maximum shortening velocity for each muscle was further defined based on the velocities for each fiber type from Larsson and Moss (1993). The remaining required parameters of muscle length (l), fiber length, and muscle orientation were provided by SIMM.
The active or contractile element of each muscle was modeled using the length–tension and force–velocity relationships for each muscle. The length–tension relationship, developed by Kaufman et al. (1989), incorporates the effects of differing muscle architecture and the asymmetry of the length force property of muscles (Kaufman et al., 1991). To account for the force–velocity properties of contractile elements, a continuous relationship first described by Hatze (1981) was incorporated that provides for a range of shortening and lengthening velocities. To solve the indeterminate system at the shoulder, equilibrium and inequality constraints were used. The muscle force inequality constraint requires that the muscle force is above zero and less than an upper limit as expressed as described by Kaufman et al. (1991). The equilibrium constraints balance the external force system with the internal force system acting on a limb as expressed as
where FP, MP is the intersegmental force and moment due to the external force system; FMi the muscle force of the ith muscle; FJ the joint constraint force; τi the unit force vector of the ith muscle; and ri the location of the ith muscle insertion with respect to the joint center.
For the validation, three optimal criteria were chosen for determination of the cost function:
- linear minimization of α, muscle activation (Kaufman et al., 1991):
- minimax formulation minimizing the maximum muscle stress (An et al., 1984):
- nonlinear minimization of the sum of the muscle stress cubed (Lin et al., 2004):
The final results from the model were individual muscle forces and joint contact forces expressed in the thorax coordinate system.
2.4. Model validation
To validate the model, the simulation results were compared with the experimental EMG data for each subject for level propulsion trials (Crowninshield, 1978) using the mean absolute error (MAE) between the EMG muscle activity envelope and the predicted muscle activity from the model (Dubowsky et al,. 2008). The MAE is calculated by
where n the number of frames within a propulsion cycle; MAi the measured EMG muscle activity as a percentage of maximum voluntary contraction on frame i; EAi the model estimated muscle activity as a percentage of maximum muscle force on frame i.
An average MAE of less than 0.1 represents an excellent quantitative correlation, while a value between 0.1 and 0.2 represents a good correlation, and an MAE value above 0.2 represents a poor correlation (Dubowsky et al., 2008).
To assess differences between MEA for the differing cost functions, an ANOVA with one repeated measure (cost function: linear, minimax stress, and nonlinear) was performed for the average MEA value for each objective function over all muscles and for each muscle group (α=0.05). When significant main effects were observed, post-hoc Tukey pairwise comparisons (α=0.05) were performed. All statistical analyses were performed in SAS (SAS Institute, Cary, NC).
2.5. Joint contact force analysis
Based on the validation, the successfully validated and computationally inexpensive linear minimization of muscle activation objective function was chosen for further analysis. The first and last trials for all conditions were disregarded and not analyzed. For the remaining three trials, a starting and ending event was defined for each condition to extract the data of interest for running through the model (Morrow et al., 2009). After model application, the peak and mean shoulder contact forces were identified for each trial. A subject average (for peak and mean contact force) was determined for each condition based on the average for the three analyzed trials. A cohort peak and mean contact force was calculated for each condition from the average values from the individual subject averages. Subsequent statistical analysis was performed on the cohort peak and mean shoulder contact forces. A two-factor (subject, condition) ANOVA with one repeated measure (condition: level, ramp, weight relief) was performed for each joint contact force variable of interest (α=0.05). Post-hoc Tukey pairwise comparisons (α=0.05) were performed to compare the means of each variable between each condition when appropriate.
3. Results
A representative comparison of the model estimated muscle activity to the EMG for the anterior deltoid is shown in Fig. 2. When comparing the MEA values over all subjects and muscles for each objective functions, no significant differences were observed (Table 1). All mean values corresponded to a good correlation (MEA value between 0.1 and 0.2) between the model results and subject-specific EMG data.
Fig. 2.
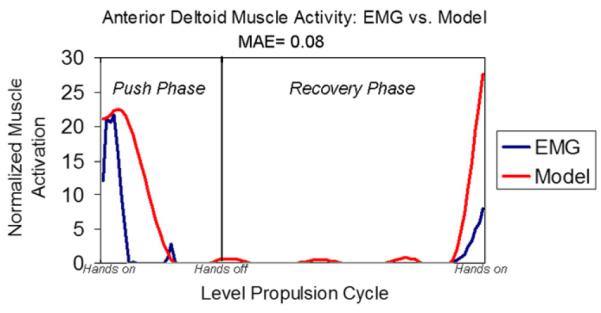
Representative data from validation of model estimated forces with experimental EMG data for anterior deltoid muscle. The resulting MAE validation value is displayed.
Table 1.
MEA values for validated muscles for each objective function.
| Validated muscles | Linear | Minimax stress | Nonlinear | p-value |
|---|---|---|---|---|
| Adelt | 0.15±0.16 | 0.12±0.09 | 0.14±0.14 | 0.89 |
| Mdelt | 0.10±0.03 | 0.11±0.03 | 0.10±0.02 | 0.72 |
| Pdelt | 0.17±0.05 | 0.17±0.06 | 0.17±0.06 | 0.99 |
| PecMaj | 0.06±0.03 | 0.09±0.03 | 0.07±0.03 | 0.06 |
| LatDo | 0.13±0.07 | 0.12±0.06 | 0.12±0.06 | 0.97 |
| TricL | 0.09±0.03 | 0.09±0.04 | 0.09±0.04 | 0.99 |
| BicepL | 0.05±0.03 | 0.05±0.03 | 0.05±0.03 | 0.99 |
| Mean | 0.11±0.03 | 0.11±0.03 | 0.10±0.03 | 0.95 |
Significance was set at α= 0.05
Representative examples of measured handrim and estimated contact forces show the differences in timing of the maximum handrim and shoulder joint contact forces for each condition (Figs. 3–5). There was a significant main effect of condition for all mean joint contact force components: posterior medial, superior, and resultant (Fig. 6). Post-hoc analysis indicated that level propulsion had significantly smaller mean joint contact forces than the ramp propulsion and weight relief conditions for all force components except in the posterior force direction where ramp and level were equivalent. The weight relief and ramp conditions were statistically equivalent in the mean medial force component as well as the mean superior force component. The weight relief mean posterior force component and mean resultant force were significantly higher than the ramp propulsion magnitudes.
Fig. 3.
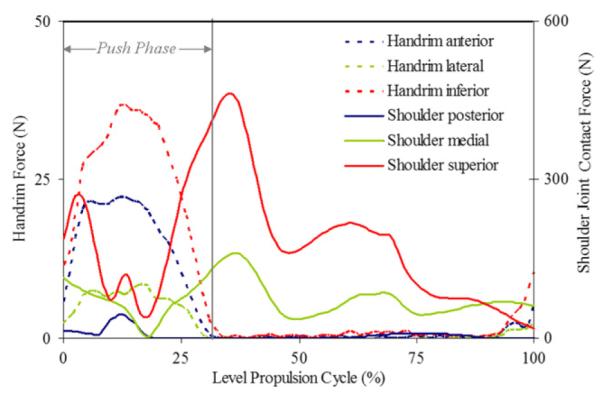
Representative handrim forces and model estimated shoulder joint contact forces during level propulsion cycle.
Fig. 5.
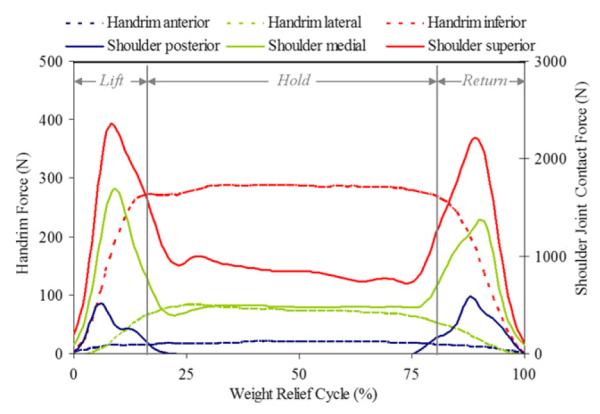
Representative handrim forces and model estimated shoulder joint contact forces during weight relief maneuver.
Fig. 6.
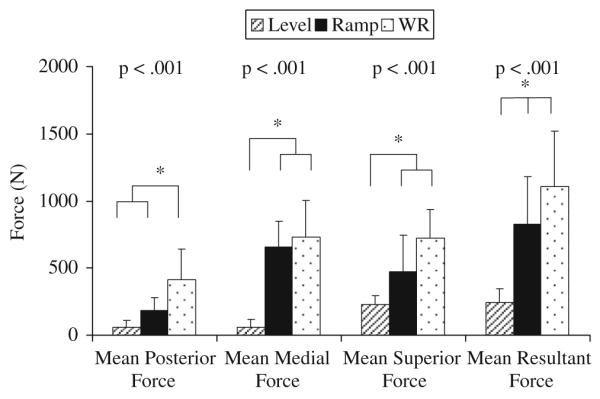
Mean shoulder joint contact forces for each component of the resultant force. Statistical significance was set at α=0.05. * indicates statistically significant post-hoc results.
Analysis of the peak joint contact force components revealed significant main effects of condition for all components: posterior, medial, superior, and resultant (Fig. 7). Post-hoc analysis indicated that level propulsion had significantly smaller peak joint contact forces than the ramp propulsion and weight relief conditions for all force components as well as the resultant force. The weight relief and ramp conditions were statistically equivalent in the peak medial force component, peak superior force component, and the peak resultant force. The ramp peak posterior force component was significantly higher than the weight relief magnitude.
Fig. 7.
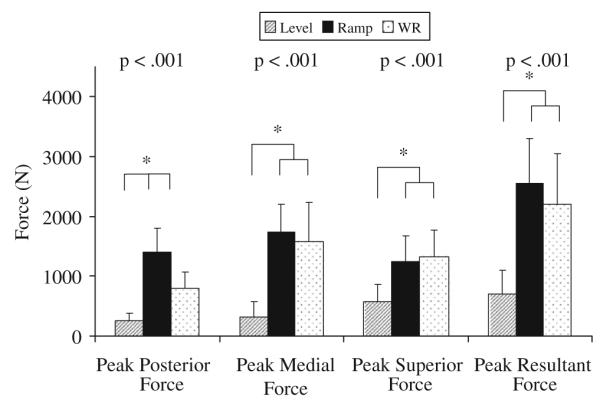
Peak shoulder joint contact forces for each component of the resultant force. Statistical significance was set at α=0.05. *i ndicates statistically significant post-hoc results.
4. Discussion
The UE musculoskeletal and optimization model presented here incorporates physiologically based constraints to effectively predict the muscle force contributions during manual wheelchair activities. The purpose of this investigation was to validate the subject-specific model described here, and to assess the potential of level wheelchair propulsion, ramp propulsion and weight relief lifts to exhibit joint contact forces that could contribute to the development of shoulder impingement syndrome.
The model results for each of the three objective functions utilized resulted in very similar good correlations with the subject-specific EMG based on the MAE calculation. Based on the results presented here, all three objective functions are reasonable and appropriate choices for further application of this UE musculoskeletal and optimization model. In consideration of the statistically equivalent results and computation time related to the three methods, we chose to use the linear approach. While it is promising that all the optimal criteria are reasonable choices for the model formulation, careful consideration must be given to the validation results. The validation performed used an indirect method and the assumption of a linear relationship between EMG and muscle force is unfounded (Hof, 1997). That being said, results from this study compare favorably with previous investigations of successful musculoskeletal model validations using the MEA calculation (Dubowsky et al., 2008).
The mean and peak level propulsion joint contact forces were low for all force directions, and except for the mean posterior force, level propulsion was significantly smaller than both the ramp and weight relief lift conditions. The level peak resultant force (702 N) compares with in vivo forces, measured with an instrumented humeral head prosthesis, during steering and hair combing (Bergmann et al., 2007). In the in vivo study by Bergmann et al. (2007), the overwhelming majority of activities tested resulted in larger peak resultant forces than those predicted by this model for level propulsion. The mean ramp propulsion forces were consistently smaller in magnitude than the weight relief forces. Contrary to the mean forces, the peak forces during ramp propulsion were larger in magnitude than the weight relief forces except in the medial direction. The ramp peak resultant force (2555 N) and the weight relief peak resultant force (2207 N) were at least twice the magnitude as the activities measured in the in vivo study (Bergmann et al., 2007) and were the same relative magnitude as reported for able-bodied subjects going from sit-to-stand (2075 N) (van Drongelen et al., 2005).
In regards to potential impingement, the focus was on a large compression force in the superior direction (Sharkey and Marder, 1995). The level propulsion peak resultant force was primarily in the superior direction, but was significantly less than ramp propulsion and weight relief (Fig. 7). In addition, in the ramp and weight relief conditions, the superior joint contact force remains above 500 N for the majority of the cycle (Figs. 4 and 5) while during level propulsion, the superior joint contact force is above 500 N only briefly at the observed peak (Fig. 3). When compared with in vivo measurements of common UE activities of an ablebodied subject, the level propulsion peak superior component (573 N) is on par with common activities not associated with impingement risk. In contrast to level propulsion, both ramp propulsion and weight relief exhibited mean and peak superior and resultant forces of impressive magnitudes. As weight relief lifts are recommended to be performed every fifteen minutes by the Agency for Health Care Policy and Research (1992) and ramp propulsion of varying inclines is a part of daily home and community ambulation, the frequency of performance of these extremely high load activities adds further evidence that point to the their potential risk.
Fig. 4.
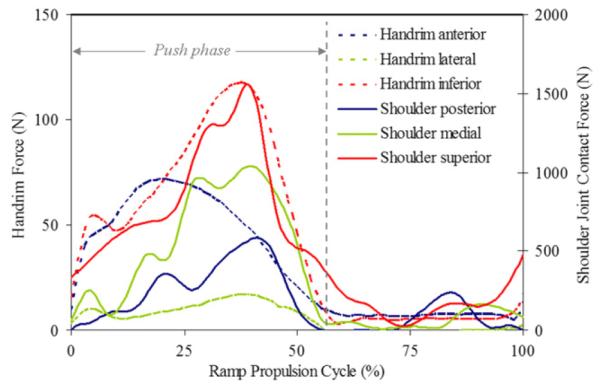
Representative handrim forces and model estimated shoulder joint contact forces during ramp propulsion cycle.
In the two propulsion conditions, there were differences in the timing of the peak shoulder contact forces. The ramp condition peak joint contact forces followed closely with the timing of the handrim forces (Fig. 4), while the peak superior and medial contact forces during level propulsion occurred well after the peak handrim forces (Fig. 3). The late peaks (after push phase) of the shoulder contact forces coincide with late peaks in intersegmental forces and are dependent on the joint posture, among other variables. At the end of the push phase of level propulsion, the humerus is at a maximum flexion angle. During ramp propulsion, the joint excursion is much smaller than during level propulsion due to the shorter push angle and smaller push frequency (Richter et al., 2007) necessary to effectively propel against gravity. Hence, the contact force peaks coincide with handrim force peaks. The peak forces of weight relief occurred before the peak handrim forces due to the joint angles adopted during the lift and return phases (Fig. 5). In the hold phase, the humerus position is a neutral posture with internal rotation. The timing associated with the peak weight relief joint contact forces highlights the increased potential of high loads when joint excursion is high.
In comparing to previous models, level propulsion has been the most widely studied with optimization techniques. The peak resultant joint contact forces compared well for level propulsion between previous studies (Table 2) despite some groups performing the propulsion on an ergometer to control for power and/or speed. For the weight relief lift, the two studies by van Drongelen et al. (2005, 2006) report lower peak contact forces at approximately 1500 N compared to the reported 2207 N in this study (Table 2) which could be explained by model alternations for the tetraplegic population used in the other investigations.
Table 2.
Comparison of present study and previous.studies on model estimated peak contact forces
| Veeger et al. (2002) | Lin et al. (2004) | van Drongelen et al. (2005) | van Drongelen et al. (2006) | Present study | |
|---|---|---|---|---|---|
| Peak force (N) | |||||
| Level | 800 (10 W, 3 km/h) | 679 (SS) | 250 (4.6 W) | - | 702 (SS) |
| Weight relief | - | - | 1500 | 1656 | 2207 |
| Ramp | - | - | - | - | 2555 (SS) |
ss=self-selected speed; W=watts (power).
The musculoskeletal and optimization model presented here had limitations. Only a subset of the shoulder musculature was modeled for this application. In addition, the model only includes muscles and does not include other soft tissues such as ligaments. The shoulder joint is assumed to be frictionless although it has been shown in vivo using a shoulder endoprosthesis that the contact moments for some activities are non-negligible (Bergmann et al., 2007). The optimization is quasi-static and although the motions are dynamic, the analysis is performed on a frame-by-frame basis. For shoulder impingement, major limitations are the assumed rhythm of the scapula in the musculoskeletal model and the expression of the results in the thorax coordinate system. This allows for a probable conclusion on the direction of the joint contact force on the glenoid surface, but does not allow for any definitive conclusions due to a lack of accuracy.
In conclusion, the data presented in this study highlights the potential impingement risk associated with both the ramp and weight relief lift activities. Level propulsion was shown to have a low relative risk of causing injury, but with consideration of the frequency with which propulsion is performed, this observation is not conclusive. Future work should be focused on discovering successful environmental, training, and rehabilitative interventions to aid in shoulder impingement prevention.
Acknowledgements
The authors acknowledge Kathie Bernhardt and Diana Hansen for their assistance with subject testing and data processing. All aspects of this study were funded by a grant from the National Institutes of Health (R01HD48781).
Footnotes
Conflict of interest statement The authors have no conflicts of interest to disclose.
References
- Agency for Health Care Policy and Research Pressure ulcers in adults: prediction and prevention. Clin. Pract. Guidel. Quick Ref. Guide Clin. 1992:1–15. [PubMed] [Google Scholar]
- An KN, Kwak BM, Chao EY, Morrey BF. Determination of muscle and joint forces: a new technique to solve the indeterminate problem. J. Biomech. Eng. 1984;106:364–367. doi: 10.1115/1.3138507. [DOI] [PubMed] [Google Scholar]
- Bayley JC, Cochran TP, Sledge CB. The weight-bearing shoulder. The impingement syndrome in paraplegics. J. Bone Joint Surg. 1987;69:676–678. [PubMed] [Google Scholar]
- Bergmann G, Graichen F, Bender A, Kaab M, Rohlmann A, Westerhoff P. In vivo glenohumeral contact forces—measurements in the first patient 7 months postoperatively. J. Biomech. 2007;40:2139–2149. doi: 10.1016/j.jbiomech.2006.10.037. [DOI] [PubMed] [Google Scholar]
- Boninger ML, Baldwin M, Cooper RA, Koontz A, Chan L. Manual wheelchair pushrim biomechanics and axle position. Arch. Phys. Med. Rehabil. 2000;81:608–613. doi: 10.1016/s0003-9993(00)90043-1. [DOI] [PubMed] [Google Scholar]
- Boninger ML, Cooper RA, Baldwin MA, Shimada SD, Koontz A. Wheelchair pushrim kinetics: body weight and median nerve function. Arch. Phys. Med. Rehabil. 1999;80:910–915. doi: 10.1016/s0003-9993(99)90082-5. [DOI] [PubMed] [Google Scholar]
- Boninger ML, Cooper RA, Robertson RN, Rudy TE. Wrist biomechanics during two speeds of wheelchair propulsion: an analysis using a local coordinate system. Arch. Phys. Med. Rehabil. 1997;78:364–372. doi: 10.1016/s0003-9993(97)90227-6. [DOI] [PubMed] [Google Scholar]
- Boninger ML, Souza AL, Cooper RA, Fitzgerald SG, Koontz AM, Fay BT. Propulsion patterns and pushrim biomechanics in manual wheelchair propulsion. Arch. Phys. Med. Rehabil. 2002;83:718–723. doi: 10.1053/apmr.2002.32455. [DOI] [PubMed] [Google Scholar]
- Crowninshield RD. Use of optimization techniques to predict muscle forces. J. Biomech. Eng. 1978;100:88–91. [Google Scholar]
- Curtis KA, Drysdale GA, Lanza RD, Kolber M, Vitolo RS, West R. Shoulder pain in wheelchair users with tetraplegia and paraplegia. Arch. Phys. Med. Rehabil. 1999 April;4:453–457. doi: 10.1016/s0003-9993(99)90285-x. 4, 453–45780. 1999. [DOI] [PubMed] [Google Scholar]
- Dubowsky SR, Rasmussen J, Sisto SA, Langrana NA. Validation of a musculoskeletal model of wheelchair propulsion and its application to minimizing shoulder joint forces. J. Biomech. 2008;41:2981–2988. doi: 10.1016/j.jbiomech.2008.07.032. [DOI] [PubMed] [Google Scholar]
- Hatze H. Myocybernetic control models of skeletal muscle. University of South Africa; Pretoria: 1981. [Google Scholar]
- Hof AL. The relationship between electromyogram and muscle force. Sportverletz Sportschaden. 1997;11:79–86. doi: 10.1055/s-2007-993372. [DOI] [PubMed] [Google Scholar]
- Holzbaur KR, Murray WM, Delp SL. A model of the upper extremity for simulating musculoskeletal surgery and analyzing neuromuscular control. Ann. Biomed. Eng. 2005;33:829–840. doi: 10.1007/s10439-005-3320-7. [DOI] [PubMed] [Google Scholar]
- Kaufman K, An K, Litchy W, Chao E. Physiological prediction of muscle forces—I theoretical formulation. Neuroscience. 1991;40:781–792. doi: 10.1016/0306-4522(91)90012-d. [DOI] [PubMed] [Google Scholar]
- Kaufman KR, An KN, Chao EYS. Incorporation of muscle architecture into the muscle length tension relationship. J. Biomech. 1989;22:943–949. doi: 10.1016/0021-9290(89)90078-x. [DOI] [PubMed] [Google Scholar]
- Kulig K, Rao SS, Mulroy SJ, Newsam CJ, Gronley JK, Bontrager EL, Perry J. Shoulder joint kinetics during the push phase of wheelchair propulsion. Clin. Orthop. Relat. Res. 1998:132–143. doi: 10.1097/00003086-199809000-00016. [DOI] [PubMed] [Google Scholar]
- Langenderfer J, Jerabek SA, Thangamani VB, Kuhn JE, Hughes RE. Musculoskeletal parameters of muscles crossing the shoulder and elbow and the effect of sarcomere length sample size on estimation of optimal muscle length. Clin. Biomech. (Bristol, Avon) 2004;19:664–670. doi: 10.1016/j.clinbiomech.2004.04.009. [DOI] [PubMed] [Google Scholar]
- Larsson L, Moss RL. Maximum velocity of shortening in relation to myosin isoform composition in single fibres from human skeletal muscles. J. Physiol. 1993;472:595–614. doi: 10.1113/jphysiol.1993.sp019964. [DOI] [PMC free article] [PubMed] [Google Scholar]
- Lin HT, Su FC, Wu HW, An KN. Muscle forces analysis in the shoulder mechanism during wheelchair propulsion. Proc. Inst. Mech. Eng. [H] 2004;218:213–221. doi: 10.1243/0954411041561027. [DOI] [PubMed] [Google Scholar]
- Mercer JL, Boninger M, Koontz A, Ren D, Dyson-Hudson T, Cooper R. Shoulder joint kinetics and pathology in manual wheelchair users. Clin. Biomech. (Bristol, Avon) 2006;21:781–789. doi: 10.1016/j.clinbiomech.2006.04.010. [DOI] [PubMed] [Google Scholar]
- Morrow MM, Hurd WJ, Kaufman KR, An KN. Shoulder demands in manual wheelchair users across a spectrum of activities. J. Electromyogr. Kinesiol. 2009 doi: 10.1016/j.jelekin.2009.02.001. [DOI] [PMC free article] [PubMed] [Google Scholar]
- Requejo PS, Mulrouy SJ. Evidence-based strategies to preserve shoulder function in manual wheelchair users with spinal cord injury. Top. Spinal Cord Inj. Rehabil. 2008 Spring13:86–119. [Google Scholar]
- Richter WM, Rodriguez R, Woods KR, Axelson PW. Stroke pattern and handrim biomechanics for level and uphill wheelchair propulsion at self-selected speeds. Arch. Phys. Med. Rehabil. 2007;88:81–87. doi: 10.1016/j.apmr.2006.09.017. [DOI] [PubMed] [Google Scholar]
- Ringleb SI, Kavros SJ, Kotajarvi BR, Hansen DK, Kitaoka HB, Kaufman KR. Changes in gait associated with acute stage II posterior tibial tendon dysfunction. Gait Posture. 2007;25:555–564. doi: 10.1016/j.gaitpost.2006.06.008. [DOI] [PubMed] [Google Scholar]
- Robertson RN, Boninger ML, Cooper RA, Shimada SD. Pushrim forces and joint kinetics during wheelchair propulsion. Arch. Phys. Med. Rehabil. 1996;77:856–864. doi: 10.1016/s0003-9993(96)90270-1. [DOI] [PubMed] [Google Scholar]
- Rodgers MM, Gayle GW, Figoni SF, Kobayashi M, Lieh J, Glaser RM. Biomechanics of wheelchair propulsion during fatigue. Arch. Phys. Med. Rehabil. 1994;75:85–93. [PubMed] [Google Scholar]
- Rozendaal LA, Veeger HEJ. The pushrim force pattern in manual wheelchair propulsion as a balance between cost and effect. J. Biomech. 2003;36:239–247. doi: 10.1016/s0021-9290(02)00320-2. [DOI] [PubMed] [Google Scholar]
- Sharkey NA, Marder RA. The rotator cuff opposes superior translation of the humeral head. Am. J. Sports Med. 1995;23:270–275. doi: 10.1177/036354659502300303. [DOI] [PubMed] [Google Scholar]
- Sie IH, Waters RL, Adkins RH, Gellman H. Upper extremity pain in the postrehabilitation spinal cord injured patient. Arch. Phys. Med. Rehabil. 1992;73:44–48. [PubMed] [Google Scholar]
- Srinivasan RC, Lungren MP, Langenderfer JE, Hughes RE. Fiber type composition and maximum shortening velocity of muscles crossing the human shoulder. Clin. Anat. 2007;20:144–149. doi: 10.1002/ca.20349. [DOI] [PubMed] [Google Scholar]
- van Drongelen S, van der Woude LH, Janssen TW, Angenot EL, Chadwick EK, Veeger DH. Glenohumeral contact forces and muscle forces evaluated in wheelchair-related activities of daily living in able-bodied subjects versus subjects with paraplegia and tetraplegia. Arch. Phys. Med. Rehabil. 2005;86:1434–1440. doi: 10.1016/j.apmr.2005.03.014. [DOI] [PubMed] [Google Scholar]
- van Drongelen S, van der Woude LH, Janssen TW, Angenot EL, Chadwick EK, Veeger HE. Glenohumeral joint loading in tetraplegia during weight relief lifting: a simulation study. Clin. Biomech. (Bristol, Avon) 2006;21:128–137. doi: 10.1016/j.clinbiomech.2005.09.003. [DOI] [PubMed] [Google Scholar]
- Veeger HE, Rozendaal LA, van der Helm FC. Load on the shoulder in low intensity wheelchair propulsion. Clin. Biomech. (Bristol, Avon) 2002;17:211–218. doi: 10.1016/s0268-0033(02)00008-6. [DOI] [PubMed] [Google Scholar]
- Westerhoff P, Graichen F, Bender A, Rohlmann A, Bergmann G. An instrumented implant for in vivo measurement of contact forces and contact moments in the shoulder joint. Med. Eng. Phys. 2009;31:207–213. doi: 10.1016/j.medengphy.2008.07.011. [DOI] [PubMed] [Google Scholar]
- Zajac FE. Muscle and tendon: properties, models, scaling, and application to biomechanics and motor control. Crit. Rev. Biomed. Eng. 1989;17:359–411. [PubMed] [Google Scholar]


