Abstract
Interaction of myeloma cells with the bone marrow microenvironment is mediated in large part through different cytokines, especially VEGF and IL6. These cytokines, especially IL6, leads to up-regulation of the JAK/STAT pathway in myeloma cell, contributing to increased proliferation, decreased apoptosis and acquired drug resistance. Here, we examined the pre-clinical activity of a novel JAK2 inhibitor TG101209. TG101209 induced dose and time dependent cytotoxicity in a variety of MM cell lines. The induction of cytotoxicity was associated with inhibition of cell cycle progression and induction of apoptosis in myeloma cell lines and patient derived plasma cells. Evaluation of U266 cell lines and patient cells, which have a mix of CD45 positive and negative cells, demonstrated more profound cytotoxicity and anti-proliferative activity of the drug on the CD45+ population relative to the CD45− cells. Exploring the mechanism of action of TG101209 indicated down regulation of pJak2, pStat3 and Bcl-xl levels with up-regulation of pErk and pAkt levels indicating cross talk between signaling pathways. TG101209 when used in combination with the PI3K inhibitor LY294002 demonstrated synergistic cytotoxicity against myeloma cells. Our results provide the rationale for clinical evaluation of TG101209 alone or in combination with PI3K/Akt inhibitors in multiple myeloma.
Keywords: myeloma, microenvironment, apoptosis, proliferation, cell cycle arrest, Jak/Stat
INTRODUCTION
Multiple myeloma (MM) remains incurable with current therapies and novel approaches targeting the molecular mechanisms of the disease are needed. In the absence of a single unifying molecular genetic event leading to the disease manifestation, the focus of new therapies should be based on biological pathways critical to tumor survival(1),(2),(3). Interactions between the myeloma cell and the marrow microenvironment leads to increased cytokine secretion both by the myeloma cells as well as the cells of the microenvironment, in particular VEGF, IL6 and IGF(4),(5),(6),(7),(8),(9),(10),(11),(12). The increased cytokine levels lead to an up-regulation of signaling pathways within myeloma cells that ultimately results in increased transcription of proliferation related genes and decreased transcription of apoptosis promoting genes. Cytokine induced signaling pathways include the Jak/Stat3, PI3K/Akt, and Ras/MEK/MAPK pathways(13), (14), (15), (16). Jak/Stat pathway is critical for proliferation and survival of MM cells and is stimulated by cytokines, especially IL6. High incidence of constitutively active Stat3 has been reported in CD138 cells and BMSCs from MM patients(17),(18). The increase in activated Stat3 causes induction of anti-apoptotic proteins Mcl-1 and Bcl-xl(18),(19). MM cell line U266 has constitutively active Stat3 which leads to increased levels of Bcl-xl and resistance to apoptosis(18). Inhibition of the Jak/Stat pathway by non-specific inhibitors have been shown to induce apoptosis and sensitize MM cells to apoptosis induced by common therapeutic agents (20),(21),(22),(23),(24). Previous studies with Jak specific inhibitors AG490 and pyridone 6 showed that AG490 was able to induce apoptosis of myeloma cell lines only in high micromolar concentrations and pyridone 6 was able to cause cell death only in cells with constitutively activated Jak/Stat pathway (25).
TG101209 and TG101348, both small molecule Jak2 selective inhibitors, were identified by structure based drug design and have been found to be potent inhibitors of JAK2V617F and MPLW515L/K mutations commonly associated with polycythemia vera (PV) and primary myelofibrosis (PMF) respectively(26), (27), (28), (29). TG101348 is currently under clinical evaluation for treatment of PMF patients(30). Due to the importance of the Jak/Stat pathway in MM disease biology and given the potential of a specific inhibitor of this pathway as an anti-MM agent, we investigated the effect of TG101209, a specific inhibitor of this pathway on myeloma cell lines and patient plasma cells in vitro. TG101209 was able to induce apoptosis in all MM cell lines irrespective of Jak2 activation status. Even more importantly, TG101209 was highly cytotoxic to the CD45+ myeloma cells, the subpopulation that is considered the more proliferative compartment in myeloma. Based on the results obtained from our mechanistic studies, we tested TG101209 in combination with the PI3K inhibitor LY294002 and observed synergistic cytotoxicity in MM cell lines and patient samples.
MATERIALS AND METHODS
Multiple myeloma cell lines, patient plasma cells and stromal cells
MM1.S (Dexamethasone sensitive), MM1.R (Dexamethasone resistant), DOX 40 (Doxorubicin resistant), LR5 (melphalan resistant), RPMI 8226, OPM-2, NCI-H929 and U266 human MM cell lines were used for the current study. All the cell lines were cultured in RPMI 1640 media (Sigma Chemical, St. Louis, MO) that contained 10% fetal bovine serum, 2 mM L-glutamine (GIBCO, Grand Island, NY), 100 U/mL penicillin, and 100 μg/mL streptomycin. Freshly obtained BM aspirates were subjected to Ficoll-Paque gradient separation, and the mononuclear cells were placed in 25mm2 culture flasks in RPMI 1640 media containing 20% fetal bovine serum, 2 mM L-glutamine, 100 U/mL penicillin, and 100 μg/mL streptomycin. Once the adherent stromal cells (BMSC) were confluent, they were trypsinized and passaged as needed.
TG101209
TG101209 (N-tert-butyl-3-(5-methyl-2-[4-(4-methyl-piperazin-1-yl)-phenylamino]-pyrimidin-4-ylamino)-benzenesulfonamide) was synthesized and provided by TargeGen Inc. (San Diego, CA, USA) under a Material Transfer Agreement. Stock solutions were made in DMSO at a concentration of 5mM, aliquoted and stored at −20 °C. The drug was subsequently diluted in RPMI-1640 medium at the desired concentration prior to use.
Cell viability and proliferation assays
Myeloma cells were incubated with the indicated concentrations of TG101209 in a 96 well flat bottomed culture tray for 24-72 hours. Post incubation, viability was measured using the 3-(4, 5-dimethylthiazol-2-yl)-2, 5-diphenyl tetrasodium bromide (MTT) (Chemicon International Inc., Temecula, CA) colorimetric assay as previously described (31),(32). Proliferation assays were performed by measuring tritiated thymidine uptake as described earlier (31),(32). Briefly, cells were incubated with indicated concentrations of TG101209 in a 96 well flat bottomed culture tray for 48 hours cells and pulsed with 3H-TdR during the last 16 hours of 48-hour cultures, harvested on filters using a harvester and incorporated radioactivity determined using a scintillation counter (PerkinElmer, Waltham, MA, USA). For co-culture studies with myeloma cells and bone marrow stromal cells (BMSCs) or cytokines, we incubated myeloma cells in the presence or absence of BMSCs or cytokines with the indicated concentration of the drug for 48 hours. Proliferation assays were performed as described above. All experiments were performed in triplicate.
Apoptosis measurement
Apoptosis of MM cell lines was assayed as described before (31),(32). Briefly, cells were harvested, washed one time in annexin binding buffer (ABB, 10 mM HEPES pH 7.4, 140 mM NaCl, 2.5 mM CaCl2), and incubated with 3μl of annexin fitc (Cat# ANNEXIN01-3, Invitrogen) for 15 minutes at room temperature in the dark. For experiments on the separate CD45 subsets in the U266 cell line, 5μl CD45 APC (Cat# 340943, BD Biosciences) was added at the same time as the annexin reagent. Two ml of ABB was added and the tubes were spun for 5 minutes at 300g. The pellets were resuspended in 0.5 ml of ABB plus 5ul of 1mg/ml propidium iodide (PI Cat#P-4170 Sigma). The samples were run on a Canto flow cytometer (BD Biosciences, San Jose, CA.). For patient cells, fresh bone marrow cells were subjected to ACK lyse, washed, resuspended in RPMI/10% FCS and plated in 24 well tissue culture plates with and without drug. The cultures were harvested, washed one time in PBS (phosphate buffered saline) and resuspended in 1 ml PBS/3% BSA (bovine serum albumin). One hundred microliters of the cell suspension was washed in ABB and stained with 3μl of annexin V- FITC, 5ul of CD45 APC, and 10ul of CD38 PeCy7 (Cat#335808 BD Biosciences) and processed as above. Plasma cells were identified by their characteristic CD38 bright/45 staining pattern.
Caspase assay
Levels of caspase 3, 8, and 9 were indirectly determined by the production of FL1 fluorescence by cleaved substrate using kits from OncoImmunin (Gaithersburg, MD, USA). PhiPhiLux G1D2 (catalog# A304R1G-3) was used for the detection of caspase 3, while CaspaLux 8 L1D2 (catalog# CPL8R1L-3) and CaspaLux 9 M1D2 (catalog# CPL9R1M-3) were used for the detection of caspases 8 and 9. Samples were run on the Canto flow cytometer.
Cell Cycle
Cells were incubated with TG101209 as indicated. Cells were harvested, counted, and washed with PBS. With the tube mixing on the vortex, two ml of cold 85% ETOH was slowly added to the dry pellet. The tubes were capped and left at 4 degrees overnight. The tubes were spun and the pellets washed twice with PBS. The pellet was resuspended in 0.1 ml RNase (5ug/ml cat# R7884, Sigma, St.Louis, MO.) and incubated at 37 degrees. 0.9 ml PBS was added to each tube and mixed. 10μl of PI (1mg/ml) was added to each tube, mixed and held at 4 degrees until run on the Canto flow cytometer. Cell cycle statistics were calculated using the cell cycle platform analysis, FlowJo software (Tree Star, Inc. Ashland, OR).
BrdU Assay and Cell Cycle analysis
After treating cells with the drug, cells were harvested, washed one time in staining buffer (SB, 1% BSA/PBS) and resuspended in 1 ml of culture media plus 10μl of BrdU (APC BrdU Flow Kit Cat# 552598, BD Biosciences) for a one hour incubation. After harvest, the cells were processed and stained as per the manufacturer's instructions. In brief, cells were washed with PBS, stained for surface CD45 fitc (Cat# 340664, BD Biosciences) fixed and permeabilized per kit reagents, incubated with DNase for 60 minutes at 37 degrees, and incubated with anti-BRDU or isotype control for 30 minutes. Cells were washed one time and resuspended in 0.5 ml SB. The samples were run on a Canto flow cytometer. CD45 positive and negative gates were set using the natural break between the populations. Isotype control was used to set markers for BRDU staining.
After collecting events for BRDU/45 analysis, 20 ul of 2 mg per ml AAD (ActinomycinD 7- Amino, Calbiochem # 129935) was added to each tube. The tubes were held at 4 degrees for one hour, then run on the canto flow cytometer for determination of cell cycle arrest. The cell cycle platform in FlowJo Software (Tree Star, Inc, Ashland , OR) was used to model the cell cycle analysis
Western Blotting
Cells were treated with indicated concentrations of TG101209 for the indicated time points. Cells were harvested and lysed with RIPA buffer (50mM HEPES (pH 7.4), 150mM NaCl, 1% Triton X-100, 30mM sodium pyrophosphate, 5mM EDTA, 2mM Na3VO4, 5mM NaF, 1mM phenylmethyl-sulfonyl-fluoride (PMSF) and protease inhibitor cocktail). Protein lysate concentrations were measured using BCA assay (Pierce, Rockford, IL, USA). Equal amounts of protein were loaded on 12% Tris-Glycine gels and transferred onto nitrocellulose membranes. Membranes were probed with pJak2, Jak2, pStat3, Stat3, pAkt, Akt, pErk, Erk, Mcl-1, Bcl-2, Bcl-Xl, Cdk2, Cdk4, p21, p27 and Xiap (Cell Signaling Technology, Daverns, MA, USA). Blots were stripped and re probed with anti- beta actin antibody (Cell signaling Technology) as a control.
Isobologram analysis
The interaction between TG101209 and LY294002 was analyzed using the CalcuSyn™ software program (Biosoft, Ferguson, MO). This program is based upon the Chou-Talalay method, which calculates a combination index (CI), and analysis is performed based on the following equation: CI = (D)1/(Dx)1 + (D)2/(Dx)2 + (D)1(D)2/(Dx)1(Dx)2, where (D)1 and (D)2 are the doses of drug 1 and drug 2 that have x effect when used in combination, and (Dx)1 and (Dx)2 are the doses of drug 1 and drug 2 that have the same x effect when used alone (33). Data from the MTT viability assay was expressed as the fraction of cells killed by the individual drug or the combination in drug-treated cells compared with untreated cells. A CI of 1.0 indicates an additive effect, whereas CI values below 1.0 indicate synergism.
RESULTS
TG101209 inhibits proliferation and induces cytotoxicity in myeloma patient cells and cell lines
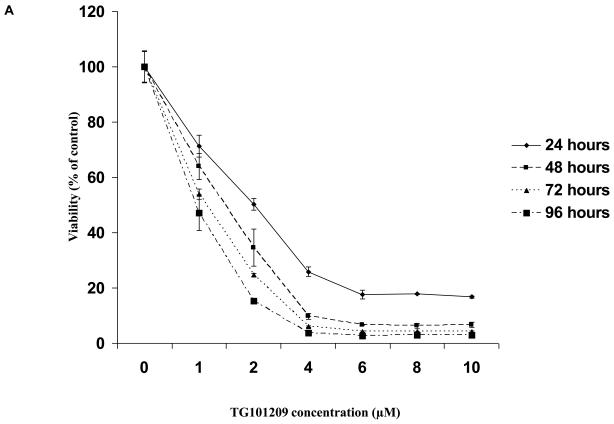
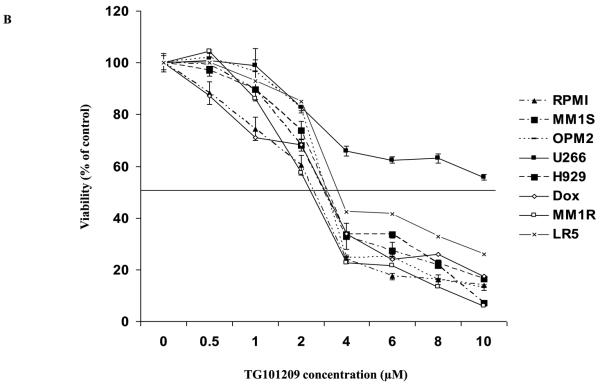
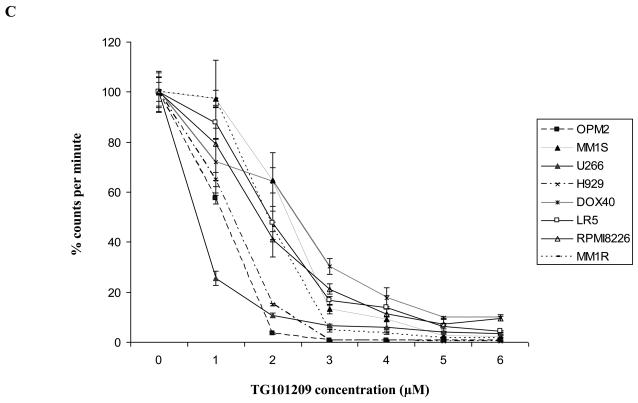
First, we tested the cytotoxic effect of TG101209 on a variety (8 cell lines listed in methods section) of cell lines. For this, we incubated each of the 8 cell lines with indicated concentrations of the drug for 24, 48, 72 or 96 hours and measured drug induced cytotoxicity by MTT assays. We observed that the drug was potent in inducing cytotoxicity by 48 hours with minimal increase in cytotoxicity after that (Figure 1A and data not shown). The IC50 values for seven out of eight cell lines measured by MTT assays after 48 hours of incubation with the drug was in the range of 2-5μM (Figure 1B). The cell line that was least sensitive to the drug on the viability assay was U266. We then proceeded to study the ability of TG101209 to inhibit proliferation of myeloma cells in vitro. When the same cell lines were incubated with the drug we observed a clear dose dependent inhibition of proliferation in all cell lines tested (Figure 1C). The inhibitory effect on proliferation was evident at a lower dose than was observed in the cytotoxicity assays. In particular, the effect of the drug on proliferation of U266 cells was comparable to that seen with other cell lines unlike the cytotoxicity assays, likely a reflection of early cell cycle arrest in response to the drug.
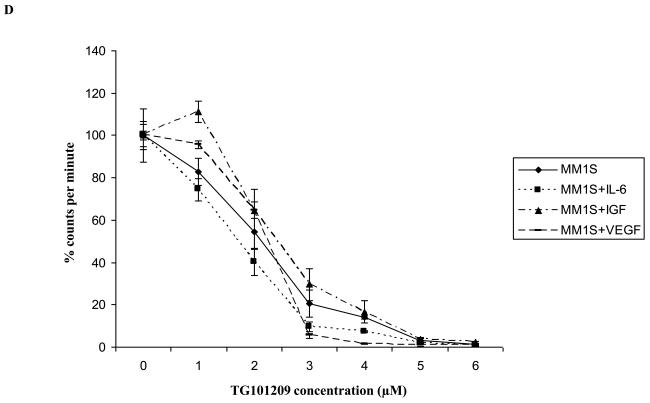
Figure 1. TG101209 is cytotoxic to MM cell lines and overcomes proliferative effect of BMSCs and cytokines.
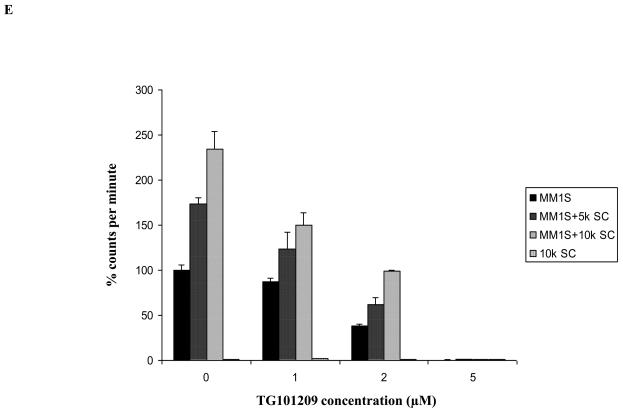
A) When MM1S cells were incubated with TG101209 for increasing time points (24, 48, 72 and 96 hours) we observed dose dependent increase in cytotoxicity. There was a time dependent increase in cytotoxicity observed till 48 hours with minimal increase beyond this time point. Drug concentrations (μM) are indicated on the X-axis and viability (% of control) is indicated on the Y axis. Error bars represent one standard deviation. B) When various MM cell lines were incubated with TG101209 for 48 hours we observed dose dependent decrease in viability in all cell lines except U266. IC50 values were found to be in the range of 2-5μM. Drug concentrations are indicated on the X axis and viability (% of control) is indicated on the Y axis. Error bars represent one standard deviation. C) When various MM cell lines were incubated with TG101209 for 48 hours we observed dose dependent inhibition of proliferation measured by thymidine uptake. Drug concentrations are indicated on the X-axis and thymidine uptake expressed as percent counts per minute of control is indicated on Y-axis. Error bars represent one standard deviation. D) When MM1S cells cultured with VEGF (50ng/ml), IGF-1 (50ng/ml) or IL6 (25ng/ml) were incubated with TG101209 for 48 hours, we observed dose dependent inhibition of proliferation measured by thymidine uptake. Drug concentrations are indicated on the X-axis and thymidine uptake expressed as percent counts per minute of control (MM1S cells cultured without cytokines) is indicated on the Y-axis. Error bars represent one standard deviation. E) When MM1S cells were co-cultured with bone marrow stromal cells (BMSCs), we observed increase in proliferation measured by increase in thymidine uptake. This increase in proliferation is dependent on stromal cell numbers. TG101209 treatment is able to inhibit this increase in proliferation. Drug concentrations are indicated on X-axis and thymidine uptake expressed as percent counts per minute of control (MM1S alone without BMSCs) is indicated on the Y-axis. Error bars represent one standard deviation.
TG101209 overcomes the protective effects of the tumor microenvironment
It is well accepted that constituents of the bone marrow microenvironment are essential in MM disease progression and drug resistance. We wanted to test if TG101209 was able to overcome the protective effects of the microenvironment and induce cytotoxicity in MM cells in vitro. For this, we cultured MM1S cells in the presence of cytokines (IL6, IGF or VEGF) or bone marrow stromal cells (BMSC). We observed TG101209 to inhibit proliferation of MM1S cells at similar concentrations in the presence or absence of constituents of the microenvironment indicating the potential for the drug to overcome microenvironment mediated resistance in the in vitro setting (Figure 1D and 1E). While some protection was offered by the marrow stromal cells, this was completely abrogated at highest dose of the drug.
TG101209 induces apoptosis in MM cell lines and patient cells
Since we observed induction of cytotoxicity on MM cells, we then wanted to examine if this cytotoxic effect was in fact mediated through induction of apoptosis. We incubated MM1S or RPMI 8226 cells with 5μM of the drug for 6, 24 or 48 hours. Following the incubation, we monitored for cells undergoing apoptosis by performing annexin/PI staining and flow cytometry. We observed a marked increase in apoptotic cells after 24 hours of drug incubation with minimal increase before that. Continued incubation with drug showed an almost complete loss of viability with only 1% of cells alive at 48 hours of drug treatment (Figure 2A). TG101209 also induced similar changes in RPMI 8226 cells though to a lesser extent when compared to MM1S cells. After 48 hour of drug incubation we observed that 29% cells were viable in RPMI 8226 cells (Figure 2B).
Figure 2. TG101209 induces apoptosis in MM cell lines and patient samples.
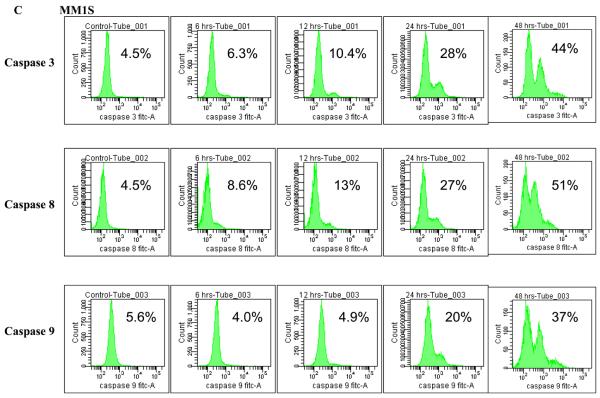
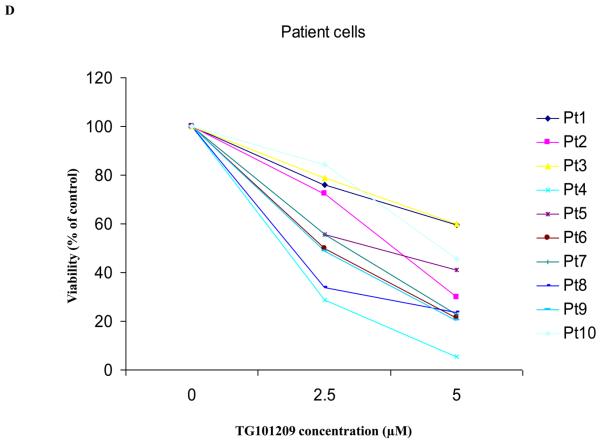
A) When MM1S or B) RPMI 8226 cells were incubated with TG101209 (5μM) we observed time dependent increase in apoptosis. Annexin V-FITC staining is represented on the X-axis and propidium iodide (PI) staining is represented on the Y-axis. Percent cells in viable quadrant are indicated. C) When MM1.S MM cells were treated with TG101209 (5 μM), induction of apoptosis in MM cells was accompanied by a time-dependent (0, 6, 12, 24 and 48 hours) cleavage of caspase 3, caspase 8, and caspase 9 as demonstrated by flow cytometry. Annexin V-FITC staining is represented on the X-axis and propidium iodide (PI) staining is represented on the Y-axis. Percent cells in viable quadrant are indicated. D) TG101209 induces apoptosis of freshly isolated patient MM cells when cultured with the indicated drug concentrations for 48 hours as measured using Annexin/PI staining and flow cytometry. TG101209 concentrations (μM) are indicated on the X-axis and % of viable cells (annexin and PI negative) is indicated on the Y-axis.
We next wanted to examine whether the induction of apoptosis involved caspase activity. For this, we incubated MM1S cells with 5μM of TG101209 and measured the active (cleaved) levels of initiator caspases (caspases 8 and 9) and an effector caspase (caspase 3). We were able to observe clear activation of all three caspases measured indicating caspase dependent apoptosis induced by the drug (Figure 2C).
We then wanted to test the effect of TG101209 treatment on patient derived CD138+ primary cells in vitro. Of the 10 patients tested, the drug was able to induce potent apoptosis in 8 patients (Figure 2D).
TG101209 induces G2-M cell cycle arrest
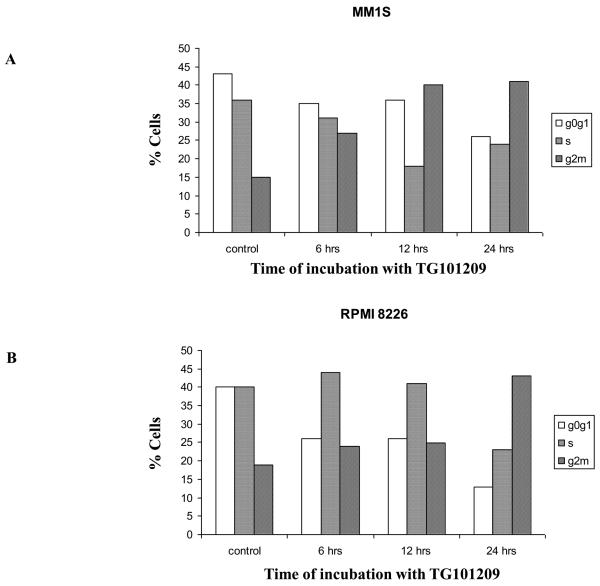
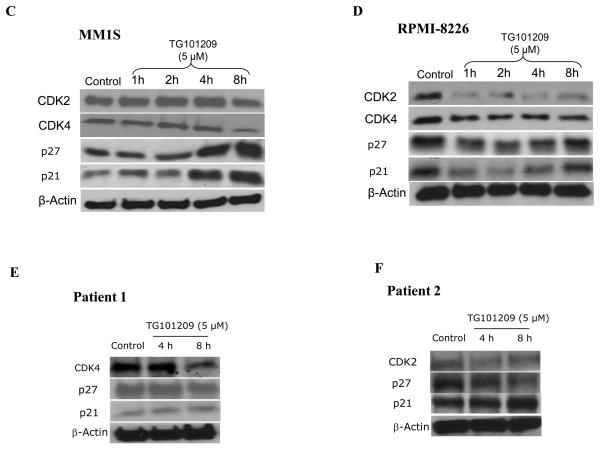
From the above results it became clear that TG101209 was efficient in inhibiting proliferation and inducing apoptosis of myeloma cells. We then wished to examine if TG101209 induced cell cycle arrest which then led to the observed increase in apoptosis. For this, we treated MM1S and RPMI 8226 cells with 5μM of the drug for 6, 12 or 24 hours. Following the incubation, we measured the population of cells in the different stages of the cell cycle. In control MM1S cells, the percentage of cells in G0/G1, S and G2/M stages were 43, 36 and 15% respectively. After 24 hours of drug incubation, the percentage of cells in G0/G1, S and G2/M stages were 26, 24 and 41% respectively (Figure 3A). Similarly in RPMI 8226 cell line, percentage of cells in G2/M stage among control and 24 hour drug treated cells were found to be 19 and 43% respectively (Figure 3B). Cyclin dependent kinases 2 and 4 (Cdk2 and Cdk4) are proteins important for cell cycle progression. In order to better understand the mechanism of TG101209 induced cell cycle arrest, we treated MM1S and RPMI 8226 cells with TG101209 (5μM) for 1, 2, 4 or 8 hours and examined expression levels of Cdk2 and Cdk4. In addition, we also examined expression levels of inhibitors of Cdks, namely p27 and p21 post drug treatment. In both MM1S and RPMI 8226 cells, we observed down regulation of both Cdks (Figure 3C and 3D). However, we were able to observe up-regulation in levels of p27 and p21 only in MM1S cells (Figure 3C and 3D). p27 was found to be down regulated in RPMI 8226 cells and also in both patient samples tested (Figure 3D-F). In addition p21 was initially down regulated in RPMI 8226 cells post drug treatment followed by an increase at 8 hrs of drug treatment. Patient 1 did not express any observable basal levels of Cdk2 and no detectable levels of Cdk2 were observed post drug treatment (data not shown). In the second patient, a down regulation of cdk2 was seen, especially at 4 hours of incubation. Cdk4 down regulation was seen in patient-1, but we were un able to perform western blotting for Cdk4 in patient 2 due to limited amount of sample. In patient 1 there was minimal increase in p21 levels whereas patient 2 showed a clear increase in p21 levels. Both p21 and p27 have been shown to have a more complex function than being just tumor suppressors (34), (35). It has been shown that both these proteins might also be oncogenic and hence might perform different functions within individual cell lines and patient cells.
Figure 3. TG101209 inhibits cell cycle progression by inducing G2/M arrest.
TG101209 treatment (5μM) leads to accumulation of cells in G2/M stage of cell cycle. We treated A) MM1S or B) RPMI 8226 cells with TG101209 (5μM) for either 6, 12 or 24 hours and observed time dependent increase of cells in G2/M stage indicating growth arrest. Time of incubation with TG101209 is indicated on the X-axis and percent cells are indicated on the Y-axis. Next, we examined changes in expression levels of cell cycle related proteins post treatment with TG101209. We treated C) MM1S or D) RPMI 8226 cells with TG101209 (5μM) for 1, 2, 4 or 8 hours. Post treatment we made lysates and checked for expression levels of Cdk2, Cdk4, p27 and p21. β-actin was used as a loading control. We show clear down regulation of Cdk2 and Cdk4 in both cell lines and increase in p21 and p27 in MM1S cells. We also incubated two patient derived CD138+ cells with 5μM of TG101209 for 4 or 8 hours. E) Patient 1 samples showed reduction in levels of Cdk4 with no observable change in p21. p27 was down regulated at 8 hrs of incubation with the drug. F) Patient 2 samples showed reduction in levels of Cdk2 and p27. p21 was up-regulated post drug treatment.
TG101209 induces preferential cytotoxicity of CD45+ myeloma cells
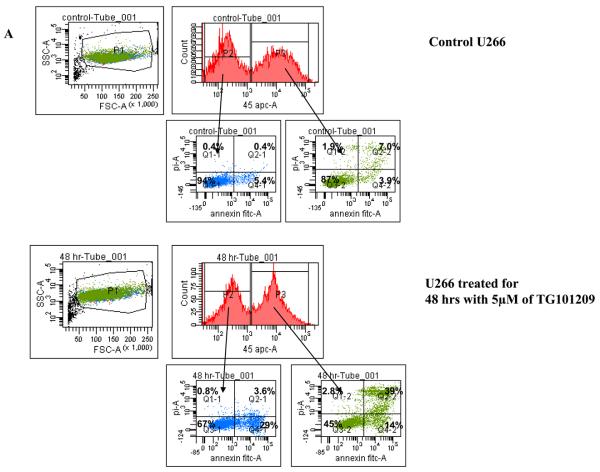
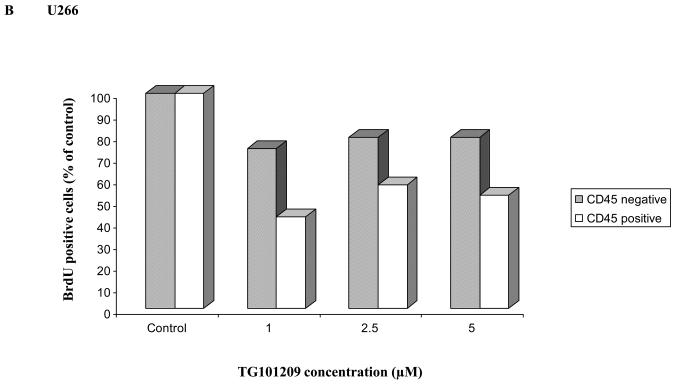
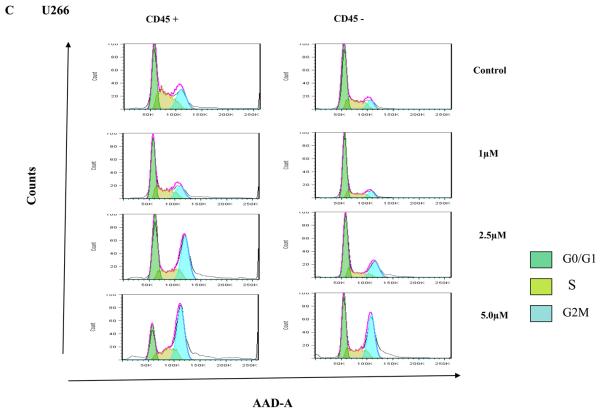
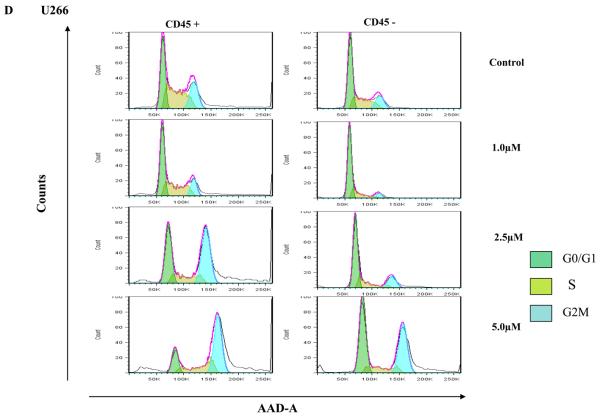
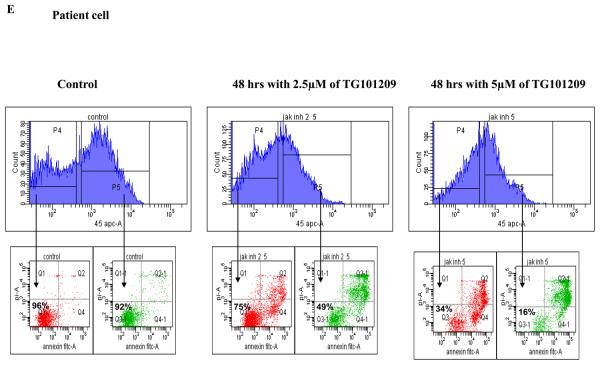
Clonal plasma cells in patients with MM are known to be heterogeneous in terms of their expression of CD45(36),(37). CD45+ plasma cells have been shown to be more proliferative compared to CD45− plasma cells, and the proportion of 45+ cells correlates with disease stage and outcome. Given that the CD45+ cells are more responsive to the proliferative cytokines, we speculated that TG101209 induced cytotoxicity might be dependent on CD45 expression patterns. In order to study this, we first examined the effects of TG101209 treatment on U266 cells, which like patient cells are also heterogeneous in their expression of CD45. As hypothesized, our results clearly indicate preferential killing of CD45+ U266 cells by TG101209 (Figure 4A) as demonstrated by annexin/PI staining and flow cytometry. The proportion of viable CD45+ cells decreased from 87% to 45% after 48 hours of drug treatment. U266 cells lacking CD45 expression were less sensitive to TG101209 treatment with percentage of viable cells decreasing from 94% to 67%. We next examined the inhibitory effect of TG101209 treatment on proliferation of CD45+ and CD45− U266 cells. After 24 hours of incubation with the drug, the anti-proliferative effect was more pronounced in the CD45+ population of U266 cells (Figure 4B). The drug was able to inhibit proliferation of CD45+ cells by 50% while it was able to inhibit proliferation of CD45− cells only by about 20%. However, by 48 hours of incubation with TG101209, the drug was able to inhibit proliferation of both the CD45+ and CD45− populations at similar levels (data not shown) consistent with results obtained in Figure 1C. Examining cell cycle arrest induced by the drug on CD45+ and − cells again indicated increased sensitivity of CD45+ population to the drug. As shown in Figure 4C, 24 hr incubation of TG101209 was able to induce more potent G2M arrest in CD45 expressing U266 cells when compared to cells lacking CD45 expression. We also examined cell cycle arrest induced by TG101209 on the two populations after incubating for 48 hours with the drug. TG101209 at 1 and 2.5μM was still able to induce more profound G2M arrest in CD45+ cells (Figure 4D). Next, we wished to determine if TG101209 induced preferential killing of CD45+ cells observed in U266 cells was also true in MM patient samples. For this, we incubated patient bone marrow primary cells with 2.5 and 5μM of the drug for 48 hours. Following the treatment, we monitored for induction in apoptosis in both CD45+ and CD45− populations and observed preferential killing of CD45+ population (Figure 4E).
Figure 4. Preferential killing of CD45+ cells by TG101209.
A) We incubated U266 cells with 5μM of TG101209 for 48 hours. At the end of the incubation cells were harvested, washed one time in annexin binding buffer (ABB) and incubated with annexin FITC and CD45 APC. We monitored for drug induced apoptosis in CD45+ and CD45− populations. The panel on top within each group (control and drug incubated samples) indicates the gating done to discriminate between CD45+ and CD45− populations. The bottom panel indicates the apoptosis in cells selected based on CD45 expression. In the Annexin V-FITC staining is represented on the X-axis and propidium iodide (PI) staining is represented on the Y-axis. Percent cells in viable quadrant are indicated. B) U266 cells were incubated with 1, 2.5 or 5μM of TG101209 for 24 hrs. Post incubation, cells were harvested, washed one time in staining buffer (SB) and re suspended in 1 ml of culture media plus 10μl of BRDU. Cells positive for BRDU indicate the proliferative fraction. As shown in B), proliferation of CD45+ population is inhibited by 50% while proliferation of CD45− population is inhibited by only 20% after 24 hours of drug treatment. TG101209 concentration is indicated on the X-axis and cells positive for BRDU (% of control) is indicated on the Y-axis. U266 cells were incubated with 1, 2.5 or 5μM of TG101209 for C) 24 or D) 48 hrs. Post incubation, cells were treated with AAD and cell cycle arrest measured. E) We incubated CD138+ cells from bone marrow of patients with 2.5μM or 5μM of TG101209 for 48 hours. At the end of the incubation, cells were harvested, washed one time in annexin binding buffer (ABB) and incubated with annexin FITC and CD45 APC. We monitored for drug induced apoptosis in CD45+ and CD45− populations. The panel on top within each group (control and drug incubated samples) indicates the gating done to discriminate between CD45+ and CD45− populations. The bottom panel indicates the apoptosis in cells selected based on CD45 expression. In the Annexin V-FITC staining is represented on the X-axis and propidium iodide (PI) staining is represented on the Y-axis. Percent cells in viable quadrant are indicated.
Mechanism of action of TG101209
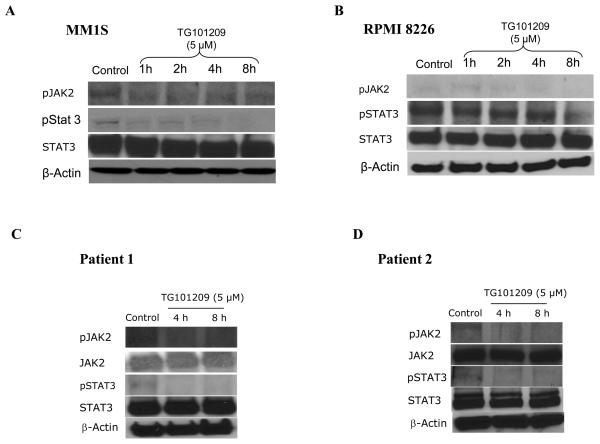
Based on our above results, it became clear that TG101209 treatment leads to increased apoptosis in both MM cell lines and patient cells in vitro. We next wished to gain better insights into the mechanism of action of the drug for which we performed western blotting. For this, we first treated MM1S and RPMI 8226 cells with 5μM of the drug for various time points. Following this, we examined the expression levels of activated Jak2 (pJak2) and activated Stat3 (pStat3), given the known target for the drug. Consistent with TG101209's effect on the Jak/Stat pathway, we observed down regulation of both Jak2 and Stat3 phosphorylation (Figure 5A and 5B). We then tested the effect of TG101209 treatment on two patient derived CD138+ primary cells and observed similar down regulation of both pJak2 and pStat3 (Figure 5C and 5D).
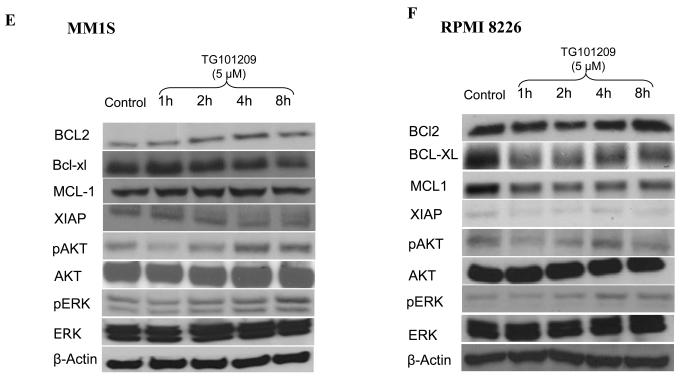
Figure 5. Mechanism of action of TG101209.
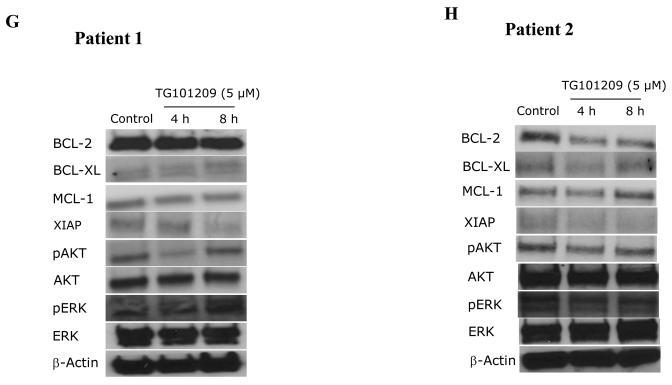
We incubated cells with TG101209 (5μM) and monitored for differences in signaling and apoptotic proteins. A) MM1S cells and B) RPMI 8226 cells were treated with TG101209 (5μM) for 1, 2, 4 or 8 hours. We observed down regulation of pJak2 and pStat3 with no change in total Jak2 and Stat3 levels. β-actin was used as control. C) Patient 1 and D) Patient 2 samples were treated with TG101209 (5μM) for 4 or 8 hours. We observed down regulation of pJak2 and pStat3 with no change in total Jak2 and Stat3 levels. β-actin was used as control. E) MM1S cells and F) RPMI 8226 cells were treated with TG101209 (5μM) for 1, 2, 4 or 8 hours and performed western blotting for Bcl2, Bcl-xl, Mcl1, Xiap, pAkt and pErk. We observed down regulation of Bcl-xl in both cell lines. Mcl1 was down regulated in RPMI 8226 cells and Xiap levels were decreased in both cell lines post drug treatment. We observed up-regulation of pAkt and pErk protein levels post treatment with the drug indicating cross talk between pathways. β-actin was used as control. G) Patient 1 and H) Patient 2 samples were treated with TG101209 (5μM) for 4 or 8 hours and performed western blotting for Bcl2, Bcl-xl, Mcl1, Xiap, pAkt and pErk. We observed down regulation of Xiap in both patient samples post drug treatment. Mcl 1 was down regulated in patient 1. pAkt was down regulated at 4 hrs which was abolished at 8 hrs of drug treatment. pErk levels were up regulated following drug treatment. Bcl2 and Bcl-xl levels did not show any observable changes. Bcl2, BclXl and Mcl1, pAkt showed down regulation post drug treatment in patient 2. There was no significant difference in pErk levels in patient 2.
We next studied the levels of anti-apoptotic proteins down stream of the Jak/Stat pathway and those implicated in MM disease progression namely Mcl1, Bcl2, Bcl-xl and Xiap. In addition, we also wanted to examine expression levels of proteins involved in other important signaling pathways implicated in MM, namely PI3K/Akt and Raf/MEK/ERK pathways. In MM1S cells TG101209 treatment led to down regulation of Bcl-xl and XIAP protein levels with no difference observed in Mcl1 and Bcl-2 (Figure 5E). In RPMI 8226 cells, TG101209 treatment led to down regulation of Bcl-xl, Mcl1 and XIAP protein levels. However, we observed a slight up-regulation of Bcl-2 protein level (Figure 5F). Cells derived from patient 1 showed no observable decrease in Bcl-xl and Bcl-2 with a slight decrease in Mcl1 expression levels post drug treatment. The only anti-apoptotic protein we studied that showed a clear down regulation was XIAP (Figure 5G). Patient 2 derived cells showed reduction in the levels of Bcl2, Bcl-xl and XIAP levels. Mcl1 expression level was down regulated at 4 hours post drug treatment. However, this down regulation was not sustained at 8 hours of drug treatment indicating that multiple pathways might regulate the expression of Mcl1 in MM (Figure 5H).
It became obvious from our above results that though the drug was able to induce apoptosis in MM cell lines and patient cells, there could be different mechanism in play in different cell lines and patients, which might be due to potential cross-talk with other pathways. In order to address this, we tested the effect of TG101209 on pAkt and pErk levels. In both MM1S and RPMI 8226 cells, TG101209 led to increase in pAkt and pErk which might partially explain the lack of a more pronounced down regulation of anti-apoptotic proteins studied (Figure 5E and 5F). Like in both the cell lines, in patient 1 we observed an increase in pAkt and pErk levels post drug treatment (Figure 5G). However, in patient 2 TG101209 treatment led to down regulation of pAkt and pErk levels (Figure 5H).
TG101209 synergizes with LY294002 in killing MM cells in vitro
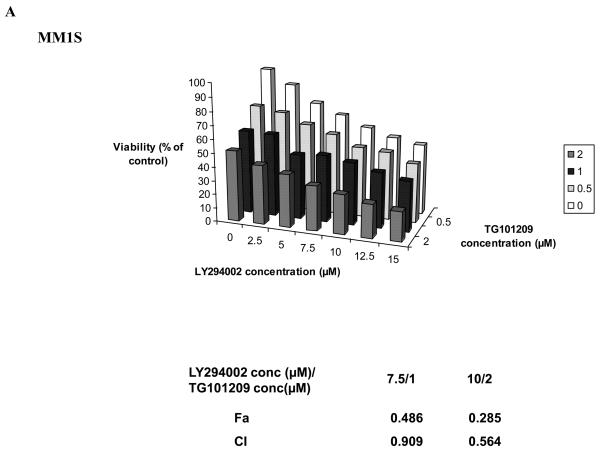
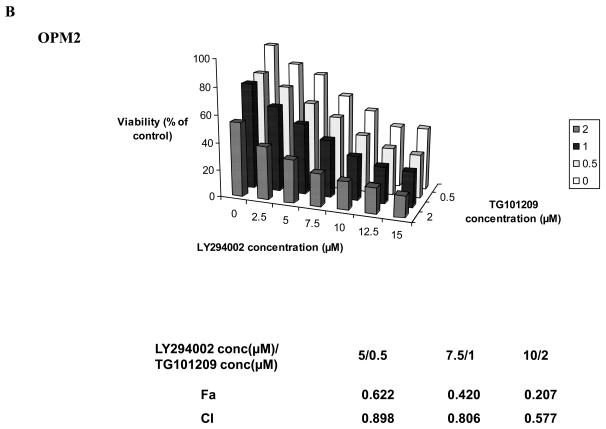
Based on our mechanistic studies, we observed that in MM cell lines and in one patient sample tested, TG101209 treatment led to up-regulation of pAkt. This prompted us to investigate the efficacy of TG101209 in combination with a PI3K inhibitor. LY294002, a commercially available PI3K inhibitor has been found to inhibit MM cell growth and proliferation in vitro. We used this in combination with TG101209 and observed synergistic toxicity in two MM cell lines tested (Figure 6A and 6B) confirming the functional importance of the cross talk between different signaling pathways.
Figure 6. TG101209 synergizes with PI3K inhibitor LY294002 in killing myeloma cells.
Synergistic killing was observed when TG101209 was used in combination with LY294002. We incubated A) MM1S cells or B) OPM2 cells with indicated concentrations of the drugs for 48 hrs and observed dose dependent increase in cytotoxicity. LY294002 concentrations (μM) are indicated on the X-axis, TG101209 concentrations (μM) are indicated on the Y-axis and percent viability (% viability of control) is indicated on the Z-axis. The combination indices (CI) are shown below the graphs.
DISCUSSION
Both cellular and non-cellular members of the tumor microenvironment play an essential role in MM disease progression (38). Elevated levels of cytokines IL6, VEGF and IGF-1 in the microenvironment lead to aberrant activation of signaling pathways that induce survival and proliferation and inhibit apoptosis of MM cells. Increased IL6 in the tumor micro-environment leads to an up regulation of multiple signaling pathways including the Jak/Stat, PI3K/Akt and Raf/Mek/Erk pathways(39),(38). Increase in IL6 in the tumor microenvironment is largely due to MM cell adhesion with other cellular components of the microenvironment which then stimulates secretion of the cytokine by bone marrow stromal cells (38). Furthermore, MM cells secrete copious amounts of Vascular Endothelial Growth Factor (VEGF), Tumor Necrosis Factor- α (TNF-α) and Transforming Growth Factor- β (TGF-β) (8), (10), (40), (41), (42). These cytokines then further promote adhesion of MM cell to BMSCs which in turn stimulate secretion of IL6 by BMSCs. Increased IL6 leads to up regulation of the above mentioned signaling pathways leading to further MM cell proliferation and decreased apoptosis. Thus, IL6 mediated signaling pathways including Jak/Stat pathway holds considerable promise as targets for anti-MM therapy.
Here, we have shown significant pre clinical in vitro activity of TG101209 as an anti-MM agent in a variety of MM cell lines and patient samples. The drug was cytotoxic to all MM cell lines tested except U266, a cell line with constitutively active Stat3 signaling. However, TG101209 was still able to inhibit proliferation of U266 cells. It has been reported earlier that MM patient cells expressing CD45 are predominant in early stages of the disease and decrease with disease progression(43). Furthermore, CD45 expressing MM plasma cells have been found to be the proliferative fraction when compared to the CD45− population and also appear to have higher density of cytokine receptors such as VEGF receptors(44). CD45− population found more commonly in advanced MM, on the other hand have been thought to be more resistant to apoptosis. Bcl2, an anti-apoptotic protein has been observed to be up-regulated in CD45− population (36). U266 cell line, like MM patients is heterogenous for CD45 expression (36), (37). Hence, we examined the effect of TG101209 on CD45+ and CD45− populations of U266 cells. We observed preferential killing of cells expressing CD45 by the drug. The inhibition of proliferation observed (Figure 1B) in U266 cells could be due to the effect of TG101209 in inhibiting CD45+ population. However, we were able to observe TG101209 induced apoptosis in all the patient samples tested. Further studies with TG101209 using primary cells derived from patients across disease stages are planned which will provide us with more information on anti-MM activity of TG101209 and its association with CD45 expression.
Cell cycle machinery has been found to be commonly de-regulated in MM. At least one cyclin D (D1, D2 or D3) is deregulated in all MM patients and expressed at significantly higher levels than in normal cells (45). In addition two of the common IgH translocations involve cyclin D abnormalities, namely 11q13 (cyclin D1) and 6p21 (cyclin D3) (46). Compounds that block cell cycle progression have been found to have potential as anti-MM agents (47), (48). We tested the ability of TG101209 to inhibit cell cycle progression on MM1S and RPMI 8226 cells and observed accumulation of cells in G2/M stage post drug treatment. We observed that TG101209 leads to inhibition of both Cdk2 and Cdk4.
We observed down regulation of pJak2 and pStat3 in both the myeloma cell lines and patient samples tested (Figure 5A-D). A study using pyridine 6 (P6) and AG490, both Jak2 specific inhibitors reported the inability of P6 to induce apoptosis in H929 and RPMI 8226 cells (25). AG490 on the other hand was able to induce apoptosis in both these cell lines. The authors were not able to observe expression of activated Jak2 and hence concluded that AG490 could inhibit other targets in addition to Jak2. In our studies using TG101209, we were able to observe drug induced cytotoxicity in H929 and RPMI 8226 cells. We used MM1S cells and RPMI 8226 for further studies and observed induction of apoptosis in both lines with a more potent increase in apoptosis in MM1S cells. We evaluated basal expression levels of pJak2 and reduction in pJak2 levels post drug treatment. We did observe faint levels of expression of pJak2 and it's down regulation with TG101209 treatment. However we were able to demonstrate clear down regulation of pStat3 which might be an indication of pJak2 inhibition. We observed up-regulation of pAkt and pErk indicating possible cross talk between signaling pathways. From our studies, we conclude that the anti-MM effects exerted by TG101209 is due to its ability to inhibit Jak2 though we cannot exclude the possibility that TG101209 could act on other targets.
We observed reduction in levels of Bcl-xl in both the myeloma cell lines and in one patient sample post drug treatment (Figure 5E-H). Bcl2 level was reduced in only one patient and was not observed in either of the myeloma cell line tested (Figure 5E-H). Similarly Mcl1 was down regulated in only RPMI 8226 cell line and one patient (patient 2 4hr time point). XIAP was the only anti-apoptotic protein studied that showed consistent down regulation post drug treatment in both the myeloma cell lines and patient sample (Figure 5E-H). Taken together, it is clear that there are differences in the mechanism of action of the drug between different MM cell lines and patient cells. However, it is clear that TG101209 has significant potential as an anti-MM agent.
The increase in pAkt and pErk levels in both the MM cell lines tested and in one patient sample prompted us to use TG101209 in combination with available inhibitors of PI3K/Akt pathway and Raf/Mek/Erk pathway on MM cell lines. We used the Mek inhibitor PD98059 and the PI3K inhibitor LY294002 for this. Using TG101209 with PD98059 on MM cell lines did not result in observable synergy in our hands (data not shown). However, when TG101209 was used in combination with LY294002 we observed marked synergy in inducing cytotoxicity in MM1S and OPM2 cells. Taken together, our studies clearly demonstrate the ability of TG101209 to induce cytotoxicity, inhibit proliferation, induce cell cycle arrest and apoptosis in MM cell line and patient derived plasma cells. TG101209 either as single agent or in combination with inhibitors of PI3K/Akt pathway should be taken up for clinical trials in a MM setting.
ACKNOWLEDGEMENT
We would like to acknowledge Kimberly Henderson, Roberta DeGoey and Steven Zincke for their assistance with processing of tumor cells and all of the patients who provided us with the tumor samples.
Financial Support: This study was supported in part by Hematological Malignancies Program (Mayo Clinic Cancer Center); and CA90628 (SK) from National Cancer Institute.
AP acknowledges research support to Mayo Clinic for conduct of clinical trials in myelofibrosis from TargeGen.
Footnotes
Disclosure of Conflicts of Interest
The other authors have no disclosures.
REFERENCES
- 1.Zhan F, Hardin J, Kordsmeier B, Bumm K, Zheng M, Tian E, Sanderson R, Yang Y, Wilson C, Zangari M, Anaissie E, Morris C, Muwalla F, van Rhee F, Fassas A, Crowley J, Tricot G, Barlogie B, Shaughnessy J., Jr. Global gene expression profiling of multiple myeloma, monoclonal gammopathy of undetermined significance, and normal bone marrow plasma cells. Blood. 2002;99:1745–1757. doi: 10.1182/blood.v99.5.1745. [DOI] [PubMed] [Google Scholar]
- 2.Fonseca R, Bailey RJ, Ahmann GJ, Rajkumar SV, Hoyer JD, Lust JA, Kyle RA, Gertz MA, Greipp PR, Dewald GW. Genomic abnormalities in monoclonal gammopathy of undetermined significance. Blood. 2002;100:1417–1424. [PubMed] [Google Scholar]
- 3.Chng WJ, Glebov O, Bergsagel PL, Kuehl WM. Genetic events in the pathogenesis of multiple myeloma. Best Pract Res Clin Haematol. 2007;20:571–596. doi: 10.1016/j.beha.2007.08.004. [DOI] [PMC free article] [PubMed] [Google Scholar]
- 4.Kawano M, Hirano T, Matsuda T, Taga T, Horii Y, Iwato K, Asaoku H, Tang B, Tanabe O, Tanaka H, et al. Autocrine generation and requirement of BSF-2/IL-6 for human multiple myelomas. Nature. 1988;332:83–85. doi: 10.1038/332083a0. [DOI] [PubMed] [Google Scholar]
- 5.Klein B, Zhang XG, Jourdan M, Content J, Houssiau F, Aarden L, Piechaczyk M, Bataille R. Paracrine rather than autocrine regulation of myeloma-cell growth and differentiation by interleukin-6. Blood. 1989;73:517–526. [PubMed] [Google Scholar]
- 6.Klein B, Tarte K, Jourdan M, Mathouk K, Moreaux J, Jourdan E, Legouffe E, De Vos J, Rossi JF. Survival and proliferation factors of normal and malignant plasma cells. Int J Hematol. 2003;78:106–113. doi: 10.1007/BF02983377. [DOI] [PMC free article] [PubMed] [Google Scholar]
- 7.Bellamy WT, Richter L, Frutiger Y, Grogan TM. Expression of vascular endothelial growth factor and its receptors in hematopoietic malignancies. Cancer Res. 1999;59:728–733. [PubMed] [Google Scholar]
- 8.Dankbar B, Padro T, Leo R, Feldmann B, Kropff M, Mesters RM, Serve H, Berdel WE, Kienast J. Vascular endothelial growth factor and interleukin-6 in paracrine tumor-stromal cell interactions in multiple myeloma. Blood. 2000;95:2630–2636. [PubMed] [Google Scholar]
- 9.Kimlinger T, Kline M, Kumar S, Lust J, Witzig T, Rajkumar SV. Differential expression of vascular endothelial growth factors and their receptors in multiple myeloma. Haematologica. 2006;91:1033–1040. [PubMed] [Google Scholar]
- 10.Kumar S, Witzig TE, Timm M, Haug J, Wellik L, Fonseca R, Greipp PR, Rajkumar SV. Expression of VEGF and its receptors by myeloma cells. Leukemia. 2003;17:2025–2031. doi: 10.1038/sj.leu.2403084. [DOI] [PubMed] [Google Scholar]
- 11.Jelinek DF, Witzig TE, Arendt BK. A role for insulin-like growth factor in the regulation of IL-6-responsive human myeloma cell line growth. J Immunol. 1997;159:487–496. [PubMed] [Google Scholar]
- 12.Ge NL, Rudikoff S. Insulin-like growth factor I is a dual effector of multiple myeloma cell growth. Blood. 2000;96:2856–2861. [PubMed] [Google Scholar]
- 13.Hideshima T, Nakamura N, Chauhan D, Anderson KC. Biologic sequelae of interleukin-6 induced PI3-K/Akt signaling in multiple myeloma. Oncogene. 2001;20:5991–6000. doi: 10.1038/sj.onc.1204833. [DOI] [PubMed] [Google Scholar]
- 14.Mitsiades CS, Mitsiades N, Poulaki V, Schlossman R, Akiyama M, Chauhan D, Hideshima T, Treon SP, Munshi NC, Richardson PG, Anderson KC. Activation of NF-kappaB and upregulation of intracellular anti-apoptotic proteins via the IGF-1/Akt signaling in human multiple myeloma cells: therapeutic implications. Oncogene. 2002;21:5673–5683. doi: 10.1038/sj.onc.1205664. [DOI] [PubMed] [Google Scholar]
- 15.Podar K, Tai YT, Davies FE, Lentzsch S, Sattler M, Hideshima T, Lin BK, Gupta D, Shima Y, Chauhan D, Mitsiades C, Raje N, Richardson P, Anderson KC. Vascular endothelial growth factor triggers signaling cascades mediating multiple myeloma cell growth and migration. Blood. 2001;98:428–435. doi: 10.1182/blood.v98.2.428. [DOI] [PubMed] [Google Scholar]
- 16.Ferlin M, Noraz N, Hertogh C, Brochier J, Taylor N, Klein B. Insulin-like growth factor induces the survival and proliferation of myeloma cells through an interleukin-6-independent transduction pathway. Br J Haematol. 2000;111:626–634. doi: 10.1046/j.1365-2141.2000.02364.x. [DOI] [PubMed] [Google Scholar]
- 17.Bharti AC, Shishodia S, Reuben JM, Weber D, Alexanian R, Raj-Vadhan S, Estrov Z, Talpaz M, Aggarwal BB. Nuclear factor-kappaB and STAT3 are constitutively active in CD138+ cells derived from multiple myeloma patients, and suppression of these transcription factors leads to apoptosis. Blood. 2004;103:3175–3184. doi: 10.1182/blood-2003-06-2151. [DOI] [PubMed] [Google Scholar]
- 18.Catlett-Falcone R, Landowski TH, Oshiro MM, Turkson J, Levitzki A, Savino R, Ciliberto G, Moscinski L, Fernandez-Luna JL, Nunez G, Dalton WS, Jove R. Constitutive activation of Stat3 signaling confers resistance to apoptosis in human U266 myeloma cells. Immunity. 1999;10:105–115. doi: 10.1016/s1074-7613(00)80011-4. [DOI] [PubMed] [Google Scholar]
- 19.Puthier D, Bataille R, Amiot M. IL-6 up-regulates mcl-1 in human myeloma cells through JAK / STAT rather than ras / MAP kinase pathway. Eur J Immunol. 1999;29:3945–3950. doi: 10.1002/(SICI)1521-4141(199912)29:12<3945::AID-IMMU3945>3.0.CO;2-O. [DOI] [PubMed] [Google Scholar]
- 20.Bharti AC, Donato N, Aggarwal BB. Curcumin (diferuloylmethane) inhibits constitutive and IL-6-inducible STAT3 phosphorylation in human multiple myeloma cells. J Immunol. 2003;171:3863–3871. doi: 10.4049/jimmunol.171.7.3863. [DOI] [PubMed] [Google Scholar]
- 21.Amit-Vazina M, Shishodia S, Harris D, Van Q, Wang M, Weber D, Alexanian R, Talpaz M, Aggarwal BB, Estrov Z. Atiprimod blocks STAT3 phosphorylation and induces apoptosis in multiple myeloma cells. Br J Cancer. 2005;93:70–80. doi: 10.1038/sj.bjc.6602637. [DOI] [PMC free article] [PubMed] [Google Scholar]
- 22.Hamasaki M, Hideshima T, Tassone P, Neri P, Ishitsuka K, Yasui H, Shiraishi N, Raje N, Kumar S, Picker DH, Jacob GS, Richardson PG, Munshi NC, Anderson KC. Azaspirane (N-N-diethyl-8,8-dipropyl-2-azaspiro [4.5] decane-2-propanamine) inhibits human multiple myeloma cell growth in the bone marrow milieu in vitro and in vivo. Blood. 2005;105:4470–4476. doi: 10.1182/blood-2004-09-3794. [DOI] [PMC free article] [PubMed] [Google Scholar]
- 23.Haridas V, Nishimura G, Xu ZX, Connolly F, Hanausek M, Walaszek Z, Zoltaszek R, Gutterman JU. Avicin D: a protein reactive plant isoprenoid dephosphorylates Stat 3 by regulating both kinase and phosphatase activities. PLoS One. 2009;4:e5578. doi: 10.1371/journal.pone.0005578. [DOI] [PMC free article] [PubMed] [Google Scholar]
- 24.Kunnumakkara AB, Nair AS, Sung B, Pandey MK, Aggarwal BB. Boswellic acid blocks signal transducers and activators of transcription 3 signaling, proliferation, and survival of multiple myeloma via the protein tyrosine phosphatase SHP-1. Mol Cancer Res. 2009;7:118–128. doi: 10.1158/1541-7786.MCR-08-0154. [DOI] [PMC free article] [PubMed] [Google Scholar] [Retracted]
- 25.Pedranzini L, Dechow T, Berishaj M, Comenzo R, Zhou P, Azare J, Bornmann W, Bromberg J. Pyridone 6, a pan-Janus-activated kinase inhibitor, induces growth inhibition of multiple myeloma cells. Cancer Res. 2006;66:9714–9721. doi: 10.1158/0008-5472.CAN-05-4280. [DOI] [PubMed] [Google Scholar]
- 26.Pardanani A, Hood J, Lasho T, Levine RL, Martin MB, Noronha G, Finke C, Mak CC, Mesa R, Zhu H, Soll R, Gilliland DG, Tefferi A. TG101209, a small molecule JAK2-selective kinase inhibitor potently inhibits myeloproliferative disorder-associated JAK2V617F and MPLW515L/K mutations. Leukemia. 2007;21:1658–1668. doi: 10.1038/sj.leu.2404750. [DOI] [PubMed] [Google Scholar]
- 27.Wernig G, Kharas MG, Okabe R, Moore SA, Leeman DS, Cullen DE, Gozo M, McDowell EP, Levine RL, Doukas J, Mak CC, Noronha G, Martin M, Ko YD, Lee BH, Soll RM, Tefferi A, Hood JD, Gilliland DG. Efficacy of TG101348, a selective JAK2 inhibitor, in treatment of a murine model of JAK2V617F-induced polycythemia vera. Cancer Cell. 2008;13:311–320. doi: 10.1016/j.ccr.2008.02.009. [DOI] [PubMed] [Google Scholar]
- 28.Geron I, Abrahamsson AE, Barroga CF, Kavalerchik E, Gotlib J, Hood JD, Durocher J, Mak CC, Noronha G, Soll RM, Tefferi A, Kaushansky K, Jamieson CH. Selective inhibition of JAK2-driven erythroid differentiation of polycythemia vera progenitors. Cancer Cell. 2008;13:321–330. doi: 10.1016/j.ccr.2008.02.017. [DOI] [PubMed] [Google Scholar]
- 29.Wang Y, Fiskus W, Chong DG, Buckley KM, Natarajan K, Rao R, Joshi A, Balusu R, Koul S, Chen J, Savoie A, Ustun C, Jillella AP, Atadja P, Levine RL, Bhalla KN. Cotreatment with panobinostat and JAK2 inhibitor TG101209 attenuates JAK2V617F levels and signaling and exerts synergistic cytotoxic effects against human myeloproliferative neoplastic cells. Blood. 2009;114:5024–5033. doi: 10.1182/blood-2009-05-222133. [DOI] [PMC free article] [PubMed] [Google Scholar]
- 30.Lasho TL, Tefferi A, Hood JD, Verstovsek S, Gilliland DG, Pardanani A. TG101348, a JAK2-selective antagonist, inhibits primary hematopoietic cells derived from myeloproliferative disorder patients with JAK2V617F, MPLW515K or JAK2 exon 12 mutations as well as mutation negative patients. Leukemia. 2008;22:1790–1792. doi: 10.1038/leu.2008.56. [DOI] [PubMed] [Google Scholar]
- 31.Kumar S, Raje N, Hideshima T, Ishitsuka K, Roccaro A, Shiraishi N, Hamasaki M, Yasui H, Munshi NC, Richardson P, Figg WD, Anderson KC. Antimyeloma activity of two novel N-substituted and tetraflourinated thalidomide analogs. Leukemia. 2005;19:1253–1261. doi: 10.1038/sj.leu.2403776. [DOI] [PubMed] [Google Scholar]
- 32.Raje N, Kumar S, Hideshima T, Ishitsuka K, Chauhan D, Mitsiades C, Podar K, Le Gouill S, Richardson P, Munshi NC, Stirling DI, Antin JH, Anderson KC. Combination of the mTOR inhibitor rapamycin and CC-5013 has synergistic activity in multiple myeloma. Blood. 2004;104:4188–4193. doi: 10.1182/blood-2004-06-2281. [DOI] [PubMed] [Google Scholar]
- 33.Chou TC, Talalay P. Quantitative analysis of dose-effect relationships: the combined effects of multiple drugs or enzyme inhibitors. Adv Enzyme Regul. 1984;22:27–55. doi: 10.1016/0065-2571(84)90007-4. [DOI] [PubMed] [Google Scholar]
- 34.Lee J, Kim SS. The function of p27 KIP1 during tumor development. Exp Mol Med. 2009;41:765–771. doi: 10.3858/emm.2009.41.11.102. [DOI] [PMC free article] [PubMed] [Google Scholar]
- 35.Gartel AL, Tyner AL. The role of the cyclin-dependent kinase inhibitor p21 in apoptosis. Mol Cancer Ther. 2002;1:639–649. [PubMed] [Google Scholar]
- 36.Pellat-Deceunynck C, Bataille R. Normal and malignant human plasma cells: proliferation, differentiation, and expansions in relation to CD45 expression. Blood Cells Mol Dis. 2004;32:293–301. doi: 10.1016/j.bcmd.2003.12.001. [DOI] [PubMed] [Google Scholar]
- 37.Asosingh K, De Raeve H, Van Riet I, Van Camp B, Vanderkerken K. Multiple myeloma tumor progression in the 5T2MM murine model is a multistage and dynamic process of differentiation, proliferation, invasion, and apoptosis. Blood. 2003;101:3136–3141. doi: 10.1182/blood-2002-10-3000. [DOI] [PubMed] [Google Scholar]
- 38.Podar K, Chauhan D, Anderson KC. Bone marrow microenvironment and the identification of new targets for myeloma therapy. Leukemia. 2009;23:10–24. doi: 10.1038/leu.2008.259. [DOI] [PMC free article] [PubMed] [Google Scholar]
- 39.Hideshima T, Mitsiades C, Tonon G, Richardson PG, Anderson KC. Understanding multiple myeloma pathogenesis in the bone marrow to identify new therapeutic targets. Nat Rev Cancer. 2007;7:585–598. doi: 10.1038/nrc2189. [DOI] [PubMed] [Google Scholar]
- 40.Gupta D, Treon SP, Shima Y, Hideshima T, Podar K, Tai YT, Lin B, Lentzsch S, Davies FE, Chauhan D, Schlossman RL, Richardson P, Ralph P, Wu L, Payvandi F, Muller G, Stirling DI, Anderson KC. Adherence of multiple myeloma cells to bone marrow stromal cells upregulates vascular endothelial growth factor secretion: therapeutic applications. Leukemia. 2001;15:1950–1961. doi: 10.1038/sj.leu.2402295. [DOI] [PubMed] [Google Scholar]
- 41.Urashima M, Ogata A, Chauhan D, Hatziyanni M, Vidriales MB, Dedera DA, Schlossman RL, Anderson KC. Transforming growth factor-beta1: differential effects on multiple myeloma versus normal B cells. Blood. 1996;87:1928–1938. [PubMed] [Google Scholar]
- 42.Hideshima T, Chauhan D, Schlossman R, Richardson P, Anderson KC. The role of tumor necrosis factor alpha in the pathophysiology of human multiple myeloma: therapeutic applications. Oncogene. 2001;20:4519–4527. doi: 10.1038/sj.onc.1204623. [DOI] [PubMed] [Google Scholar]
- 43.Kumar S, Rajkumar SV, Kimlinger T, Greipp PR, Witzig TE. CD45 expression by bone marrow plasma cells in multiple myeloma: clinical and biological correlations. Leukemia. 2005;19:1466–1470. doi: 10.1038/sj.leu.2403823. [DOI] [PubMed] [Google Scholar]
- 44.Pope B, Brown R, Gibson J, Joshua D. The bone marrow plasma cell labeling index by flow cytometry. Cytometry. 1999;38:286–292. doi: 10.1002/(sici)1097-0320(19991215)38:6<286::aid-cyto5>3.0.co;2-7. [DOI] [PubMed] [Google Scholar]
- 45.Bergsagel PL, Kuehl WM. Critical roles for immunoglobulin translocations and cyclin D dysregulation in multiple myeloma. Immunol Rev. 2003;194:96–104. doi: 10.1034/j.1600-065x.2003.00052.x. [DOI] [PubMed] [Google Scholar]
- 46.Hideshima T, Bergsagel PL, Kuehl WM, Anderson KC. Advances in biology of multiple myeloma: clinical applications. Blood. 2004;104:607–618. doi: 10.1182/blood-2004-01-0037. [DOI] [PubMed] [Google Scholar]
- 47.Shi Y, Reiman T, Li W, Maxwell CA, Sen S, Pilarski L, Daniels TR, Penichet ML, Feldman R, Lichtenstein A. Targeting aurora kinases as therapy in multiple myeloma. Blood. 2007;109:3915–3921. doi: 10.1182/blood-2006-07-037671. [DOI] [PMC free article] [PubMed] [Google Scholar]
- 48.Evans RP, Naber C, Steffler T, Checkland T, Maxwell CA, Keats JJ, Belch AR, Pilarski LM, Lai R, Reiman T. The selective Aurora B kinase inhibitor AZD1152 is a potential new treatment for multiple myeloma. Br J Haematol. 2008;140:295–302. doi: 10.1111/j.1365-2141.2007.06913.x. [DOI] [PubMed] [Google Scholar]


