

Abstract
We present a new approach for studying individual protein domains within the nuclear pore complex (NPC) using fluorescence polarization microscopy. The NPC is a large macromolecular complex, the size and complexity of which presents experimental challenges. Using fluorescence anisotropy and exploiting the symmetry of the NPC and its organization in the nuclear envelope, we have resolved order and disorder of individual protein domains. Fluorescently tagging specific domains of individual nucleoporins revealed both rigid and flexible domains: the tips of the FG domains are disordered, whereas the NPC-anchored domains are ordered. Our technique allows the collection of structural information in vivo, providing the ability to probe the organization of protein domains within the NPC. This has particular relevance for the FG domain nucleoporins, which are crucial for nucleocytoplasmic transport.
Introduction
Fluorescence anisotropy is a powerful tool which can be used to probe a protein's environment, determine the size or mobility of molecules, reveal the rotational diffusion of membrane proteins (1,2), or quantify the proximity or interactions between proteins with Förster resonance energy transfer (FRET) (3,4). Microscopy provides an additional measurement of spatial variations in fluorescence anisotropy.
Anisotropy also allows the detailed study of higher-order organization. For example, the orientation of fluorophores embedded in a biological membrane has been revealed by fluorescence polarization microscopy (5). Anisotropy has been used to probe the relative degree of order and disorder of different protein domains within the MHC complex (6). It has also been used to study the arrangement and symmetry of yeast septin proteins during septation (7). In these studies, anisotropy established the organization of a fluorophore relative to a greater structure (i.e., the plasma membrane, and the septin hourglass and ring structures). Anisotropy microscopy allows the measurement of the order and dynamics of membrane-bound or macromolecular structures, which are otherwise difficult to study.
The nuclear pore complex (NPC) is a large proteinaceous channel embedded in pores within the nuclear envelope (NE). It is present in all eukaryotic cells, where it mediates transport between the nucleus and cytoplasm (8). Recent structural studies have revealed some atomic detail of NPC architecture (8), but the dynamics and molecular mechanism of this central machinery of life are still largely unknown. High-resolution structures of several nucleoporins (nups) have been solved using crystallography (9) and single-particle electron microscopy (10). However, these techniques do not address how nups are arranged or behave in the context of the NPC and are not applicable for nups with flexible or dynamic structures (9).
Approximately one-third of nups have large natively unfolded regions, called FG domains because of the phenylalanine-glycine motifs they contain (11). FG domains are crucial for the transport function of the NPC. They fill the central channel, extending into the nucleus and cytoplasm, and act as a diffusion barrier for nonspecific molecules. This barrier excludes molecules larger than 40 kDa from diffusing passively between the nucleus and cytoplasm, while simultaneously allowing receptor-mediated transport of much larger cargo molecules, such as ribosomal subunits. Different mechanisms for this selective transport have been proposed. In the virtual gating model, movement of FG domains excludes nonspecific molecules while allowing specific cargo access through FG interactions (12). In the selective phase model, the FG domains are static, cross-linked with each other in a hydrophobic meshwork (13). The dual-gate model is a combination of the two: mobile nups at the periphery present an entropic barrier, while a central meshwork forms a hydrophobic barrier (14). Thus, the models make different predictions for the dynamics of the FG domains. These models are primarily based on in vitro studies; the dynamics of the FG domains have not been studied in live cells, where their behavior may be affected by their geometry and dense packing within the NPC. Due to their disordered nature, FG domains are not easily studied by classical methods.
We developed a fluorescence anisotropy method to study proteins within the NPC in vivo, which utilizes the symmetry of this macromolecular complex and its organization in the NE. We show that fluorescence anisotropy measurements of GFP-tagged nups can resolve the state of order or disorder of protein domains in live budding yeast and that there are differences between different domains of the same protein. Further, it can reveal information about the physical arrangement of individual protein domains within the NPC, allowing assessment of pore structure in real time. Understanding the in vivo dynamics and environment of nups may help differentiate between the models of nucleocytoplasmic transport.
Materials and Methods
Yeast strains
Yeast strains were constructed in an ADE2+ genetic background to reduce background fluorescence. Using standard methods (15,16), nups were genomically tagged with EGFP in three different regions with respect to the FG domains: at the terminus of the folded domain, nup-GFPfolded; at the junction between the folded and the FG domain, nup-GFPboundary; and at the end of the FG domain, nup-GFPtip (Table S1). (Details of plasmids and oligonucleotides are available on request.)
Sample preparation
Yeast were grown in log phase for >24 h by sequential dilution at 30°C in low-fluorescence medium (16). Cells were harvested from 1 to 3 mL of suspension culture by centrifugation, and resuspended in low-fluorescence medium. A quantity of 1 μL of this suspension was dispensed onto a glass slide, and a coverslip (No. 1.5; VWR, West Chester, PA) was applied with slight pressure. Images were collected immediately at room temperature.
Microscope setup
Polarized fluorescence images were acquired using an Olympus IX70 microscope and a 60× 1.45 NA objective (Olympus, Center Valley, PA). The sample was excited with a 488-nm argon laser (SpectraPhysics, now Newport, Irvine, CA). The excitation light passed though a cleanup polarizer and a half-wave plate (ThorLabs, Newton, NJ). Rotation of the half-wave plate controlled the direction of polarization of the excitation light allowing for fine alignment. The microscope was equipped with a 500-lp dichroic mirror and an ET535/30 emission filter. Fluorescence emission was split into two channels based on polarization with an Optosplit III (Cairn Research, Faversham, England). One emission channel collected light parallel to the excitation polarization (I∥), the other perpendicular (I⊥), each with a cleanup polarizer. The two channels were imaged simultaneously side by side on an OrcaER charge-coupled device camera (Hamamatsu, Hamamatsu City, Japan). The camera and excitation were controlled with Metamorph (Molecular Devices, Downington, PA). Exposure time was 2 s. All filters, dichroics, and polarizers were from Chroma (Bellows Falls, VT).
Microscope G-factor
A system-dependent factor, G, accounting for differences in sensitivity in the detection channels I∥ and I⊥, was determined. A deep-well solution of dilute fluorescein was imaged with both excitation polarizations and averaged to give G.
Corrections for large NA
The excitation light is y polarized, and in an ideal system I∥ = Iy and I⊥ = Ix. In our experimental system, the sample was observed with a high NA objective lens. This causes a mixing of polarization because at high angles of collection there is a z-polarization component mixed in to both I∥ and I⊥. With the z axis corresponding to the optical axis, the observed intensities are given by
| (1) |
where Ix, Iy, and Iz are the intensities observed with a polarizer oriented along the x, y, or z axis as detected by a small aperture (5). Ix and Iy, the corrected I∥ and I⊥, can be calculated using weighing factors derived for our system of Ka = 0.385, Kb = 1.006, Kc = 0.030, and the simplifying assumption Ix = Iz as in a randomly oriented system.
Microscope calibration
The system was calibrated by measuring the steady-state anisotropies of small inorganic dyes in dilute solution as well as monomeric GFP expressed in the cytoplasm of living cells (17). The anisotropy of these fluorophores was measured with both horizontal and vertical excitation polarizations. The fluorescent dyes used, their lifetimes (τ), and measured anisotropy were: Rose Bengal (τ = 76 ps; r = 0.28 ± 0.01), Erythrosin B (τ = 75 ps r = 0.27 ± 0.004), and fluoroscein (τ = 4 ns r = 0.019 ± 0.002) (Sigma-Aldrich, St. Louis, MO) (17). For monomeric GFP expressed in the cytosol of HeLa cells, r = 0.326 ± 0.008; this agrees with previously published values (6,18,19). These values were not sensitive to the polarization of the exciting light.
Data analysis
Data analysis was semiautomated for individual data sets (Fig. S1). Analysis routines were implemented in MATLAB (The MathWorks, Natick, MA) unless otherwise noted.
Initial corrections were applied to the entire image. Imedium, an image of only cell culture medium with the same acquisition parameters as the sample, was subtracted and the image was corrected for transmission differences and spatial differences:
| (2) |
Individual cells were identified for further analysis, allowing exclusion of cells not in focus, sick cells, or cells with aberrantly shaped nuclei. A rough overlay of I∥ and I⊥ is achieved with standard x-y shift values. I∥ and I⊥ pairs of individual nuclei were exported to SPIDER for alignment (20). Correct registration is critical in ratio techniques. The image pairs were read into SPIDER and registered using a translational subpixel alignment based on image cross-correlation.
To correct for the high NA objective, Eq. 1 was applied on a pixel-by-pixel basis as described above.
The level of background fluorescence varied between cells and was corrected on a cell-by-cell basis. A cytoplasmic region was selected manually and its average intensity was the cell background; this was calculated for I∥ and I⊥.
A mask was created for each aligned pair to allow analysis of the NE. The image I∥+2I⊥ was processed with the imopen function in MATLAB and subtracted from I∥+2I⊥. The resultant image was thresholded: the 200 brightest pixels were used to generate the mask. The mask was processed to remove any single pixels, and blocks of pixels that touched the image boundary. This yielded Imask and only pixels within this mask were analyzed. This routine robustly and reproducibly selected the NE.
Anisotropy (Ir) was then calculated pixel-by-pixel as
| (3) |
To quantify the population, sectors corresponding to NE position were determined by creating a mask of individual sectors of a circle, Isector j (j = 1–32), which was applied to Ir. Pixels within Isector j and Imask were assigned to sector j. This was repeated for each individual nucleus, generating an anisotropy list for each sector j. The average and standard error of the mean of these values were assigned to the sector position. The sector mask was then rotated by 11.25° and the routine repeated.
Simulation of background subtraction
A MATLAB simulation explored the effects of background subtraction. A stack with 200 planes each containing a circle with 32 segments was created for I∥ and I⊥. First, an intensity which varied around 200 with a Gaussian of width 0.1 was assigned to each plane in I⊥. Then, the anisotropy and modulation of anisotropy were defined and I∥ was created from I⊥. A background (I∥ = 100 and I⊥ = 45) was added to each image and I⊥ was altered to simulate G. Poisson-distributed photon noise was added depending on intensity. The simulation data was then analyzed as described, with the exception that the background subtracted was 0, 100, or 200 for I∥,and 0, 45, or 90 for I⊥.
Theory
The analysis of the GFP-tagged nups took into account the orientation of GFP within the NPC, the angle between the absorption and emission dipoles, the organization of the NPC within the NE, and the number of copies of the nup within the NPC.
NPC symmetry and dimensions
The NPC has an eightfold symmetry around its nucleocytoplasmic axis and the central core has a twofold dyad symmetry across the NE (Fig. 1 A). In budding yeast, the diameter of the NPC is up to 100 nm, the diameter of the central channel is ∼40 nm, and its length along the nucleo-cytoplasmic axis is ∼30 nm (21). One NPC can have 8, 16, or 32 copies of a given nup.
Figure 1.

NPC geometry and coordinate systems. (A) Distribution of nups in the NPC. Nups are arranged in rings containing eight copies, creating an eightfold symmetry axis. Sixteen copies arranged in two rings of eight are related by a pseudo-twofold symmetry axis. (B) A cross section of the yeast NE in the xyz microscope-fixed coordinate system. The position of an NPC in the NE is defined by the angle γ between N and the y axis. (C) A single fluorophore dipole, μ, in the NPQ coordinate system. The dipole μ is characterized by two angles, α and β. NPQ can be transformed into xyz by a rotation of γ around P.
Orientation dependent anisotropy
The coordinate system xyz was defined with respect to the microscope where z is the optical axis, the xy plane is the imaging plane, and y is the direction of the electric field dipole of the polarized excitation light. The nuclear cross-section which is imaged lies in the xy plane. N, the nucleo-cytoplasmic axis, lies in the xy plane and is always normal to the NE. The position of an individual NPC in the NE can be described by the angle γ between N and y (Fig. 1 B).
The coordinate system NPQ was defined with respect to the NPC (Fig. 1 C). P is parallel to z and Q lies in the xy plane. PQ is the plane of the NE.
The excitation and emission dipoles of a fluorophore rigidly held in the NPC can be defined in either the NPQ or xyz coordinate system. The excitation and emission dipoles have been shown to be virtually identical for GFP, and are treated as such (22). The dipole μ of a fluorophore rigidly attached to the NPC can be defined by two angles: α, the polar angle between μ and N, and β, the azimuthal angle, describing the orientation in NE plane (Fig. 1 C).
To illustrate the approach, consider one ring with eight copies of a GFP-tagged nup with the eight dipoles, μj (j = 1–8) ordered symmetrically within the NPC. Because of symmetry, the dipoles all have the same relation to N, and therefore are defined by a single α. The dipole orientation in the plane of the NE for each GFP, βj, is defined as βj = β1 + (j–1) π/4. In the xyz coordinate system, β describes the projection of the dipole in z. Four possible orientations of GFP in the NPC illustrate this (Fig. 2).
Figure 2.
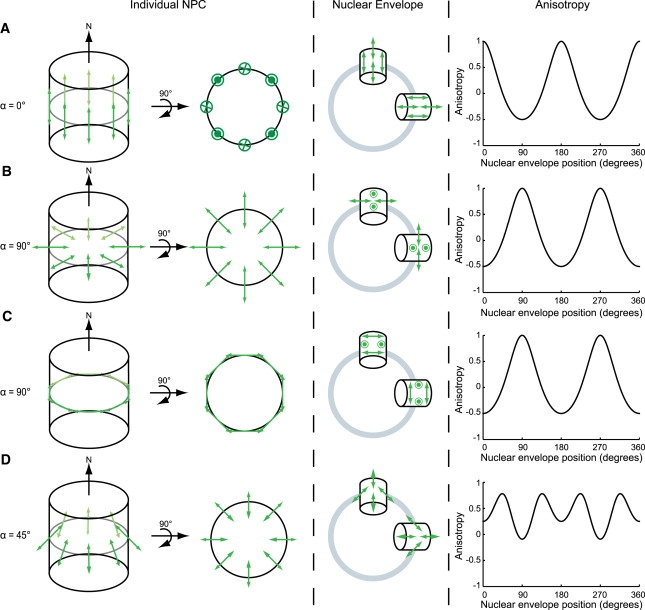
Fluorophores ordered in the NPC lead to modulation of NE anisotropy. Four different possible orientations of GFP within the NPC are depicted: (A) α = 0°, (B) α = 90°, (C) α = 90°, and (D) α = 45°.
Case A, α = 0°
All eight GFP dipoles are parallel to N, arranged like a picket fence around the NPC. This is depicted in two views: the NPC from the side, and rotated 90° and viewed down N (Fig. 2 A). All the dipoles in a single NPC are parallel and β = 0°. The NPC at the top of the NE is positioned at γ = 0° (middle panel, Fig. 2 A; for clarity only four of the eight dipoles per NPC are depicted). All eight dipoles are parallel to the excitation polarization. As γ increases, the angle between the excitation polarization and N increases, and the efficiency of excitation, as well as the polarization of emitted light, is modulated by a factor of cos2(γ). When γ = 90°, as shown with the NPC on the side of the NE, the dipoles are all perpendicular to the excitation polarization and will not be excited. The predicted anisotropy is plotted as a function of position around the NE.
Case B, α = 90°
The GFP dipoles are oriented pointing into the NPC, like spokes of a wheel (Fig. 2 B). Each dipole is at 90° to N, and β varies between dipoles by π/4 as defined above. At γ = 0° none of the dipoles are aligned with the excitation polarization (in contrast to Case A). One pair of dipoles is parallel to z, cannot be excited, and will not contribute to the fluorescence signal at any γ. Another pair is parallel to x and cannot be excited at γ = 0°. The four dipoles not shown all lie in the xz plane and cannot be excited. As γ increases, the component of the dipoles in x is rotated in the xy plane and the excitation probability increases. The projections in z do not change with γ. At γ = 90° the dipoles are maximally aligned to the excitation polarization. The predicted anisotropy is plotted as a function of position around the NE.
Case C, α = 90°
In this case, the GFP dipoles are oriented tangential to the perimeter of the NPC, like a ring (Fig. 2 C). At γ = 0°, none of the dipoles are parallel with the excitation polarization. As γ increases, the orientation of the dipoles increases until it is maximum at γ = 90°. Although the distribution of the dipoles in the NPC looks different from case B, the predicted anisotropy is the same. Since the anisotropy measurement is macroscopic, it detects the same alignment of the dipoles and is insensitive to the internal organization of these dipoles. Case B and C differ only in the angle β. The dipoles for an individual NPC in case C can be rearranged within the NE plane, without altering their orientation, to form the distribution shown in case B (Fig. 2, B and C). Thus, β does not contribute to the NE anisotropy as a function of γ. As with case B, the predicted anisotropy as a function of NE position is maximal at γ = 90°, 270°, and minimal at γ = 0°, 180°.
Case D, α = 45°
The GFP dipoles are arranged at 45° to N (Fig. 2 D). This can be seen clearly in the side view of the NPC. When considering the orientation of the dipoles with respect to both the NE and excitation polarization, the result is more complicated. Any component of the dipoles in z remains in z regardless of position on the NE, while those in the xy plane have different excitation probabilities depending on γ. This results in a more complex predicted anisotropy, which is nonetheless similar to the first cases in that anisotropy is characterized by a modulation with respect to NE position.
If there are 16 symmetrical nups, one ring of eight is related to the other by a rotation of 180° around an axis within the plane of the NE. The dipole μ is invariant with respect to rotation by 180°(α = α+180), and therefore the anisotropy as a function of NE position will not be altered.
The predicted anisotropies were obtained by formalizing the orientation of the excitation/emission dipoles with respect to the NE using Mathematica (Wolfram Research, Champaign, IL) (Fig. 2). The fluorophore excitation/emission dipole, μ, can be written in the microscope coordinate system xyz:
| (4) |
The probability of excitation for an individual fluorophore is proportional to μy2. As discussed above, β does not affect the fraction of excited fluorophores.
Assuming the fluorophore is rigidly held, not rotating during its excited lifetime, the squares of the excitation/emission dipole components are proportional to the emission intensities. To obtain the fluorescence intensity, the emission intensity is multiplied by the probability of excitation (μy2) and integrated over β to obtain I as a function of α and γ,
| (5) |
Having determined the emission intensities, the anisotropy was calculated from Eq. 3.
For the orientations of GFP in the NPC discussed, the anisotropy varies with γ. The modulation of anisotropy is periodic and occurs for all possible GFP orientations (M. Kampmann, C. E. Atkinson, A. L. Mattheyses, and S. M. Simon, unpublished).
Experimental considerations
We examined the following considerations with respect to the integrity of the data: the high NA objective correction; homo-FRET; and optical axial resolution limit.
Correction for high NA
The polarization of the observed fluorescence is distorted by collection with a high NA objective, and correction factors were applied to all data. This is an important step for recovering anisotropy values from isotropically distributed fluorophores. This correction assumes equal fluorescence in the two perpendicular channels Ix = Iz, which is correct for isotropically oriented fluorophores but not for those which are ordered.
To test the effect of this assumption on ordered data, we compared theoretical anisotropies that were: ideal; mixed by the high NA collection; mixed by the high NA collection and corrected by the Axelrod correction factor. In the ideal case, I∥ = Ix and I⊥ = Iy. To mimic collected polarizations mixed by the high NA collection, I∥ and I⊥ were calculated by combing the correction factors in Eq. 1 and the intensities Ix, Iy, and Iz (Eq. 5).
These I∥ and I⊥ values were then treated like experimental data and an unmixing step (see Materials and Methods) was applied. The anisotropy from all three treatments was shown to have the same shape, and varied only slightly in amplitude from the ideal anisotropy (Fig. S2). We therefore concluded that the high NA correction has a small impact on observed anisotropies; however, it is not hindering the observation of anisotropy patterns or data analysis.
Homo-FRET
Homo-FRET is a nonradiative transfer of energy between two like fluorophores. The efficiency of homo-FRET depends on physical parameters of the fluorophores, the distance between the fluorophores, and their relative orientations. We examined two extreme situations: randomly distributed GFPs, and ordered GFPs. Homo-FRET efficiency is given by
| (6) |
where R is the distance between the fluorophores and R0 is the Förster radius. R0 depends on physical parameters including the refractive index of the medium, the overlap integral, and the dipole orientations, described by κ2.
First, we considered fluorophores that are ordered with respect to the NPC. The smallest possible distance R between two GFPs in one ring based on the geometry of the NPC (assuming central channel r = 20 nm) is R = 153 Å. The probability of energy transfer is dependent on the orientation of GFP within the NPC. In the most favorable orientation for energy transfer, α = 0, and κ2 = 1, the efficiency of homo-FRET is 0.1%. However, in this configuration, homo-FRET will not lead to depolarization because the dipoles share the same orientation, and therefore the emission polarization will be the same with or without energy transfer. As the angle between the dipoles increases, the depolarization increases while the efficiency of homo-FRET decreases. For an ordered system, the effects of homo-FRET on anisotropy patterns measured from oriented fluorophores are negligible.
Second, we considered fluorophores that are randomly distributed with respect to the NPC. There are two possible scenarios: GFP attached to the folded domain and positioned at a specific location in the barrel of the NPC, or GFP attached to the unstructured FG domain and occupying the central channel. The minimum distance R between GFPs in one ring is R = 153 Å, as calculated above. In a randomly oriented system, κ2 = 2/3 and R0 = 47 Å, the Förster radius for GFP (3). In this case, a negligible FRET efficiency, E = 0.8%, is predicted. If there are more than eight copies of the protein and therefore multiple rings, the homo-FRET efficiency will depend on the distance between the rings and their register.
If the GFP is attached to the tip of the flexible domain, we assumed the GFPs to be randomly and isotopically distributed in the central channel. Under these conditions, the concentration of GFP calculated according to copy number is: 0.035 mM (eight copies); 0.7 mM (16 copies); and 1.4 mM (32 copies). This is a reasonable assumption, considering the length and flexibility of the FG protein domains, and is conservative for some FG domains, which have been shown to extend beyond the central channel into the nucleoplasm or cytoplasm (thereby decreasing their effective concentration and thus the homo-FRET efficiency). The critical concentration at which E = 50% is 3.8 mM (3,4). If a GFP-tagged nup is present in 16 or 32 copies, depolarization due to homo-FRET is possible.
Axial resolution
The predicted anisotropy is based on a single optical section containing NPCs with N restricted to the xy plane (Fig. 1 B). However, there are NPCs throughout the NE, both above and below the xy plane. To address depolarization from out of plane NPCs, we estimated the curvature of the NE over the focal depth. The depth of focus of a 1.45 NA objective is ∼350 nm and the nuclear diameter is 2 μm. If the plane imaged is in the center of the NE, the angle, ɛ, between N and the xy plane within the depth of focus is ɛ = ±10°. For a fluorophore ordered with respect to the NPC, this will dampen the amplitude of the anisotropy change as a function of NE position. For a fluorophore not ordered with respect to the NPC, there will be no change in the anisotropy measurement.
Results
Data collection and anisotropy measurement
We developed a method to distinguish disordered and ordered domains of nups in vivo. Endogenous nups were genomically tagged with GFP, on different domains. Only fusion proteins that fully complemented the function of the endogenous protein were used for analysis. These fusion proteins included no extra amino acids between the GFP and the nup; the anisotropy of the GFP should reflect the order/disorder of the tagged domain. If GFP is ordered within the NPC, the observed anisotropy of the NE will vary (Fig. 2). If GFP is randomly oriented within the NPC, the anisotropy of the NE will be constant. When the anisotropy varies around the NE, it is due to the orientation of GFP and NPC with respect to the NE; it is not because the mobility of the GFP is variable. The technique does not distinguish between a domain that is disordered and rigidly held and one that is disordered and flexible.
We investigated the FG domain nups, which consist of two distinct domains, one structured and one disordered. The structured, or folded, domains associate with other structured nups and form part of the inner channel of the NPC. The unfolded regions can occupy space within the central channel as well as extend into the nucleoplasm or cytoplasm. These regions have FG repeats which can interact with each other and also contain binding sites for soluble nuclear import and export factors (14,23). These interactions mediate the transport of molecules though the pore.
The FG protein Nup57 is anchored to the NPC via a folded domain that has been shown to be in a complex with Nsp1 and Nup49 (24). We investigated two yeast strains expressing GFP-tagged endogenous Nup57 constructs, with GFP at either the C-terminus (Nup57-GFPfolded), or the N-terminus (Nup57-GFPtip). The excitation light was polarized vertically in the xy plane, and the fluorescence emission was collected and split into two channels, I∥ (parallel; vertical) and I⊥ (perpendicular; horizontal) for Nup57-GFPfolded (Fig. 3 A) and Nup57-GFPtip (Fig. 3 B). Simultaneous collection of the fluorescence from both channels is important to prevent artifacts caused by movement of the sample and photobleaching between sequential exposures.
Figure 3.

Measurement of anisotropy in individual yeast nuclei. Cells expressing (A) Nup57-GFPfolded or (B) Nup57-GFPtip. Images of individual nuclei are shown in I∥ and I⊥. I⊥ is always lower than I∥ (grayscale). The calculated anisotropy (r), with the NE mask applied (pseudocolor scale). (C) Schematic of population analysis.
The intensity around the perimeter of the NE in the cells expressing Nup57-GFPtip is fairly uniform in both images (Fig. 3 B). In contrast, the Nup57-GFPfolded I∥ intensity varies with NE position (Fig. 3 A). This variation in intensity is sometimes obscured by an unequal distribution of fluorescence. However, the anisotropy measurement is not affected by the fluorescence intensity and a modulation of anisotropy around the NE of single cells is evident. The anisotropy of Nup57-GFPfolded is higher on the top and bottom of the NE and lower at the sides (Fig. 3 A). In contrast, the anisotropy of Nup57-GFPtip is fairly consistent around the NE (Fig. 3 B).
Although anisotropy patterns were detected in individual nuclei, it was beneficial to calculate the anisotropy as a function of γ for a population of cells to overcome low signal levels and gaps in NE fluorescence (Fig. 3, A and B, and Fig. S3 and Fig. S4). We used a high-throughput analysis, beginning with two sets of images: anisotropy images and masks selecting the NE (Fig. 3 C). To quantify the anisotropy as a function of NE position, the values of only those pixels which fall within both the 11.25° sector mask and the NE mask were recorded (Fig. 3 C). This was repeated for all the individual cells resulting in a list of anisotropy values. Each pixel was given equal weight regardless of which cell it originated from, because the number of pixels in a sector can vary widely from cell to cell. The average anisotropy and standard error of the mean were calculated, and assigned to the NE position corresponding to the sector. This was repeated for each sector rotation to generate anisotropy values for the 32 sectors which were plotted as a function of NE position.
The result of the population analysis supports the single cell observations. The anisotropy of Nup57-GFPfolded varies with position around the NE (n = 128 cells) (Fig. 4 A). The order score (the amplitude of the curve divided by the standard deviation of the error) is 1.44. The periodic variation in the pattern indicates that the orientation of the GFP with respect to the NPC is consistent in all cells, and the orientation of the dipoles depends upon the position of the NPC in the NE. As γ changes, the excitation probability and emission polarization are changing. This is also displayed as a mapping of the pseudocolored anisotropy values on a representation of the NE (Fig. 4 A). The excitation light was polarized vertically. If it is rotated by 90°, the anisotropy pattern maintains its shape, but is phase-shifted by 90° (Fig. S5). In contrast, the anisotropy of Nup57-GFPtip is invariant with NE position (n = 75) (Fig. 4 B). This indicates that Nup57-GFPtip is randomly oriented with respect to the NPC. The order score is 0.37. The smaller order score arises from both a smaller amplitude and larger error bars, indicating that the anisotropy values between sectors are more closely related but the range of anisotropy values within each sector is broader. There are several features of Nup57-GFPtip that are distinct from the ordered Nup57-GFPfolded. There is not a uniform or smooth modulation of the anisotropy with Nup57-GFPtip, which can be clearly visualized on the pseudocolored representation (Fig. 4 B). This result is not consistent with a rigidly ordered GFP but is consistent with a random orientation of GFP relative to the NPC and the NE. The slight modulation of anisotropy could be due to several factors (see Discussion).
Figure 4.
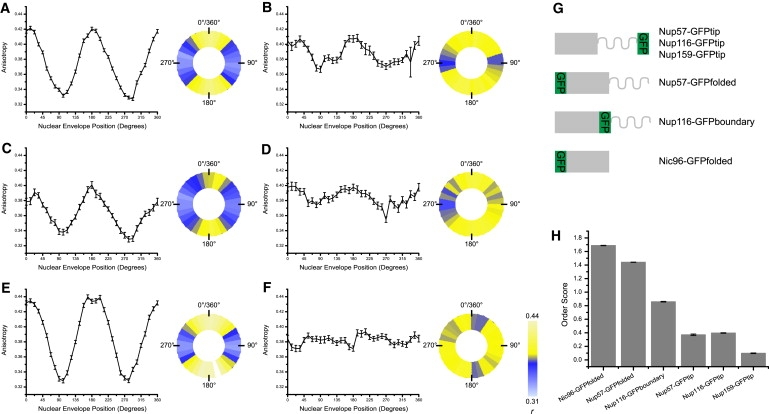
Ordered and disordered protein domains in the NPC. Anisotropy mean ± SE plotted as a function of NE position and a pseudocolored representation of the NE, where anisotropy is represented by color in each of the 32 segments for (A) Nup57-GFPfolded, (B) Nup57-GFPtip, (C) Nup116-GFPboundary, (D) Nup116-GFPtip, (E) Nic96-GFPfolded, and (F) Nup159-GFPtip. (G) Diagrams of nup-GFP constructs. (H) Order scores.
Anisotropy as a function of NE position
For Nup57, the anchored domain (Nup57-GFPfolded) was ordered with respect to the NPC, and the FG domain (Nup57-GFPtip) was disordered. To explore whether this generalized to other FG proteins, we generated yeast strains expressing GFP-tagged FG nups Nup116 and Nup159 as well as Nic96, a structured nup lacking an FG domain.
Nup116 was tagged both at the boundary between the FG and folded domains (Nup116-GFPboundary), and at the end of the FG domain (Nup116-GFPtip). Nup116-GFPboundary showed a modulation of anisotropy dependent on NE position and has an order score of 0.86 (n = 49) (Fig. 4 C). In contrast, the anisotropy of Nup116-GFPtip was uniform around the perimeter of the NE, and the order score was 0.40 (n = 62) (Fig. 4 D). This is consistent with the results from Nup57 where the terminus of the folded domain demonstrated ordering with respect to the NPC and the tip did not. It is interesting to note that the tag at the boundary between the structured and the FG domain has an order score between those of the structured and tip domains.
Nic96 was tagged directly on the C-terminus of the structured domain. Nic96-GFPfolded shows a strong modulation of anisotropy with NE position and has an order score of 1.69 (n = 87) (Fig. 4 E), indicating order with respect to the NPC. Nup159 was tagged at the tip of the flexible FG domain, Nup159-GFPtip. This construct showed no modulation of anisotropy with respect to NE position, and the order score was 0.10 (n = 68) (Fig. 4 F). This suggests that the tip of the FG domain of Nup159 is randomly oriented with respect to the NPC.
For all the proteins and positions of GFP tag investigated, we observed a larger variation in anisotropy for the tags placed near a structured domain than for those tagged at the end of the unfolded domain (Fig. 4 C). These variations were correlated with the position of the NPCs in the NE, and the values within individual segments varied less than for the GFP tags at the tips. The folded domains of Nup57 and Nic96 had the largest order scores. Interestingly, Nup116-GFPboundary had an anisotropy pattern similar to that of a structured domain. The specific pattern of anisotropy with respect to the excitation polarization, observed for all of the folded and boundary domain tags, indicates that for these nups the excitation/emission dipole of the GFP tag is oriented more closely to α = 0 than α = 45 or α = 90 (Fig. 2). In contrast, GFP tags at the tip of FG domains have anisotropy curves that are not periodic, have a smaller amplitude, and larger error. The lack of periodicity of these curves suggests that the tip of the FG domains is largely disordered with respect to the NPC. Surprisingly, there appears to be a slight modulation of the anisotropy with respect to the NE position shown by Nup57-GFPtip and Nup116-GFPtip.
Homo-FRET controls
Energy transfer between two GFPs, homo-FRET, is one source for complications in anisotropy measurements. In an isotropic distribution of fluorophores, homo-FRET decreases the observed anisotropy of a system (3,18). Depolarization could affect detection of modulation of anisotropy with an NE anisotropy pattern.
The probability of homo-FRET depends strongly on the distance between fluorophores, and within the NPC it therefore depends on the number of copies of each protein present. To experimentally investigate the possibility of homo-FRET, the GFP-labeling stoichiometry of a given nup was controlled. We created two cells lines diploid cells in which one of the two alleles is GFP tagged, and haploid cells in which the single allele is GFP tagged. These yeast strains have a determined percentage of expressed proteins with a GFP tag (haploid: 100% or diploid: 50%). The average distance between GFPs will increase in the diploid cells compared to the haploid. Therefore, homo-FRET is less likely in the diploid cells and can be revealed by comparison of the haploid and diploid yeast strains. For Nup57-GFPtip, the anisotropy as a function of NE position is not affected by the percent of copies labeled (haploid n = 72; diploid n = 75) (Fig. 5 A). Anisotropy was also not affected for Nup116-GFPtip (data not shown). This result suggests that there is no depolarization due to homo-FRET for these constructs.
Figure 5.

Sources of error. (A) Varying percentage of labeled Nup57-GRPtip. 100% labeled (black), 50% labeled (gray). (B) Nup57-GFPfolded: individualized background (bg) subtraction (dark gray) and no bg subtraction (light gray). (C) Computationally generated data with no bg subtraction (light gray), correct bg subtraction (dark gray), and 2× correct bg subtraction (black). (D) Nup57-GFPtip: individualized bg subtraction (dark gray) and no bg subtraction (light gray). (E) Computationally generated data with no bg subtraction (light gray), correct bg subtraction (dark gray), and 2× correct bg subtraction (black).
Background subtraction
One major hurdle in data analysis arose from the low fluorescence signal at the NE and a high and variable background fluorescence from the cytoplasm. The number of GFPs is limited by the number of nup copies per NPC. The level of background fluorescence was kept as low as possible by optimizing the yeast growth conditions and using low fluorescence media. However, the cytosolic background varied significantly between different yeast strains and between individual cells within each strain (Fig. S6).
Background fluorescence from the cell cytoplasm affects anisotropy calculations. If the background was not subtracted, the anisotropy values and the amplitude of the modulation of Nup57-GFPfolded were lower, on average, than the values after background subtraction (Fig. 5 B). This result can be directly compared to a computer simulation in which artificial I∥ and I⊥ were generated with anisotropy modulation around the perimeter of the NE and a background similar to that in Nup57-GFPfolded cells (Fig. 5 C). Before calculation of anisotropy, a background was subtracted from each channel. The backgrounds subtracted were no background, the correct background, or 2× the correct background. The theoretical anisotropies have the same characteristics as the experimental data (Fig. 5 D). A correct background subtraction increases the anisotropy and the amplitude of the modulation over no background subtraction (Fig. 5 C). If too much background is subtracted, the anisotropy value is even higher and the curve modulation larger.
The baseline anisotropy value of Nup57-GFPtip was higher with correct background subtraction, and the shape of the curve was unchanged (Fig. 5 D). This result can be directly compared to the computer simulation (Fig. 5 E).
The individualized background subtraction improved the robustness of our analysis, with the average anisotropy for a population reproducibly converging on a single value. An oversubtraction of background will tend to increase the measured anisotropy and the amplitude of modulation, while an undersubtraction will lower the anisotropy and decrease the amplitude.
Discussion
Fluorescence anisotropy microscopy can reveal the in vivo organization of different domains of nups. In contrast to intensity measurements, which reveal localization but not organization, fluorescence anisotropy allows exploration of subresolution order and disorder of different domains of NPC proteins. This technique depends on the symmetry of the NPC and the organization of NPCs within the NE. A theoretical framework was developed to identify the types of modulation of anisotropy expected, depending on the orientation of GFPs in the NPC.
FG proteins consist of two domains: one ordered and associated with the structured core of the NPC, and the other unstructured and containing FG repeats. We used this technique to probe different domains of the FG proteins: at the base, at the tip, and at the boundary between the two domains. Experimentally we identified two different types of protein domains: those that are ordered with respect to the NPC, and those that are disordered with respect to the NPC.
When the GFP is in a structured domain, then its measured anisotropy will vary between NPCs located at different positions around the NE. This was observed for a tag at the folded domain of Nup57 and Nic96. The anisotropy measured as a function of NE position demonstrated that these constructs are ordered with respect to the NPC.
When GFP is placed at the tip of a FG domain, there is no modulation of the anisotropy as a function of NE position, meaning that these domains are not ordered with respect to the NPC. We demonstrate that in vivo the tips of the FG domains of Nup57, Nup116, and Nup59 do not take on an order with respect to the NPC.
The NE anisotropy of Nup116-GFPboundary was modulated periodically and similarly to the nup-GFPfolded proteins showing that different regions of the same FG domain can have different degrees of order. It remains to be determined whether changes in the order/disorder of a domain will vary with nuclear transport state and whether they can provide means of resolving between different models. For two of the nup-GFPtips, the anisotropy was more ordered than expected for a randomly oriented fluorophore. There are several possible explanations: there could be a small percentage of nups that are ordered while most are disordered; some cells could contain more ordered proteins than others; GFP may bind to a sites on the NPC thereby creating a nonbiological order; or it may reflect cargo binding to, or potentially cross-linking, the FG-nups.
There is a difference between the theoretically calculated and experimentally measured range of anisotropy values and the amplitude of the modulation with respect to the NE position. The experimentally measured population anisotropies are influenced by several parameters. Variability in the diameter of the nuclei, the size of the sector, the curvature of the NE within the sector, and the out-of-plane light will all decrease the measured anisotropy. There are also biological reasons why different amplitudes of anisotropy modulation could be observed between the different tags. GFP is oriented in the NPC as defined by the angle α. If there is some slight flexibility of the GFP, i.e., α is not identical for all tagged nups, the amplitude of the anisotropy curve will be lowered. Two possible sources for a variation in α are different conformations of GFP with respect to the nup or slightly different positions of the nup-GFP within the NPC.
Experiments and simulations were conducted to investigate the effects of homo-FRET and background subtraction. Theoretical estimations revealed that homo-FRET could affect anisotropy measurements for nup-GFPtip constructs. Nup57-GFPtip was experimentally tested for homo-FRET through control of the percentage of GFP-labeled proteins: either 100% in haploid cells or 50% in diploid cells. This experiment showed no depolarization due to homo-FRET for Nup57-GFPtip. However, the ratio of labeled/unlabeled nup in diploid cells may vary due to changes in the efficiency of gene expression due to GFP tagging or bursts of mRNA production.
Anisotropy values are sensitive to background but the modulation of the anisotropy with respect to the NE is largely not affected, as shown by experimental results and computer simulation. However, it is difficult to know the exact contribution of background fluorescence. Therefore, we make conservative conclusions about absolute anisotropy values, and place more weight on modulation as a function of NE position.
This technique has an immediate application in studying the dynamics of FG nups and how they mediate transport. Nuclear transport is mediated by the NPC, and the FG nups are key in this process. Different models propose different dynamics of these nups from static (selective phase) to highly dynamic (entropic exclusion). We observe overall that the tips of the FG nups are disordered with respect to the NPC. However, this result does not tell us about the dynamics of these nups: they could be static or flexible and dynamic. In the future we will develop new methods to discern between static and dynamic disorder.
It is possible to alter the nucleocytoplasmic transport activity of yeast using genetic tools such as temperature-sensitive mutants (25) or chemical techniques such as incubation with sodium azide (26). These approaches, used in combination with fluorescence anisotropy microscopy, will allow testing of the various transport models and will give insight into the mechanism of selective transport.
In this study, the GFP fusion proteins did not contain any extra amino acids between the GFP and the nup. This approach was chosen so the GFP anisotropy would best reflect the order or disorder of the nup, without any influence from a linker. In previous applications, proteins tagged using both a flexible linker (6) or a carefully controlled rigid α-helical linker (7) have given anisotropy results to orient a protein. The type of linker used will affect the type of conclusions that can be drawn from the experiment. The diverse options in linker selection make this method adaptable to a variety of biological situations.
This fluorescence anisotropy technique can be generalized and applied to discern order and disorder in other macromolecular complexes, providing they have a symmetry axis or are organized relative to a greater structure. For the NPC, the presented technique bridges an important gap between high resolution in vitro studies and in vivo techniques.
Acknowledgments
We thank Günter Blobel for his support of this work, which was partially carried out in his laboratory.
This work was supported by the National Institutes of Health grant No. R01 GM087977 (to S.M.S.). A.L.M. was supported by a Rockefeller University Women & Science Postdoctoral Fellowship. M.K. was supported by the Predoctoral Fellowship of the Howard Hughes Medical Institute.
Footnotes
Martin Kampmann's present address is Department of Cellular and Molecular Pharmacology and Howard Hughes Medical Institute, University of California at San Francisco, San Francisco, California 94158.
Supporting Material
References
- 1.Velez M., Axelrod D. Polarized fluorescence photobleaching recovery for measuring rotational diffusion in solutions and membranes. Biophys. J. 1988;53:575–591. doi: 10.1016/S0006-3495(88)83137-0. [DOI] [PMC free article] [PubMed] [Google Scholar]
- 2.Yuan Y., Axelrod D. Subnanosecond polarized fluorescence photobleaching: rotational diffusion of acetylcholine receptors on developing muscle cells. Biophys. J. 1995;69:690–700. doi: 10.1016/S0006-3495(95)79944-1. [DOI] [PMC free article] [PubMed] [Google Scholar]
- 3.Gautier I., Tramier M., Coppey-Moisan M. Homo-FRET microscopy in living cells to measure monomer-dimer transition of GFP-tagged proteins. Biophys. J. 2001;80:3000–3008. doi: 10.1016/S0006-3495(01)76265-0. [DOI] [PMC free article] [PubMed] [Google Scholar]
- 4.Mattheyses A.L., Hoppe A.D., Axelrod D. Polarized fluorescence resonance energy transfer microscopy. Biophys. J. 2004;87:2787–2797. doi: 10.1529/biophysj.103.036194. [DOI] [PMC free article] [PubMed] [Google Scholar]
- 5.Axelrod D. Carbocyanine dye orientation in red cell membrane studied by microscopic fluorescence polarization. Biophys. J. 1979;26:557–573. doi: 10.1016/S0006-3495(79)85271-6. [DOI] [PMC free article] [PubMed] [Google Scholar]
- 6.Rocheleau J.V., Edidin M., Piston D.W. Intrasequence GFP in class I MHC molecules, a rigid probe for fluorescence anisotropy measurements of the membrane environment. Biophys. J. 2003;84:4078–4086. doi: 10.1016/S0006-3495(03)75133-9. [DOI] [PMC free article] [PubMed] [Google Scholar]
- 7.Vrabioiu A.M., Mitchison T.J. Symmetry of septin hourglass and ring structures. J. Mol. Biol. 2007;372:37–49. doi: 10.1016/j.jmb.2007.05.100. [DOI] [PubMed] [Google Scholar]
- 8.Lim R.Y.H., Ullman K.S., Fahrenkrog B. Biology and biophysics of the nuclear pore complex and its components. Int. Rev. Cell. Mol. Biol. 2008;267:299–342. doi: 10.1016/S1937-6448(08)00632-1. [DOI] [PMC free article] [PubMed] [Google Scholar]
- 9.Melcák I., Hoelz A., Blobel G. Structure of Nup58/45 suggests flexible nuclear pore diameter by intermolecular sliding. Science. 2007;315:1729–1732. doi: 10.1126/science.1135730. [DOI] [PubMed] [Google Scholar]
- 10.Kampmann M., Blobel G. Three-dimensional structure and flexibility of a membrane-coating module of the nuclear pore complex. Nat. Struct. Mol. Biol. 2009;16:782–788. doi: 10.1038/nsmb.1618. [DOI] [PMC free article] [PubMed] [Google Scholar]
- 11.Lim R.Y.H., Huang N.P., Aebi U. Flexible phenylalanine-glycine nucleoporins as entropic barriers to nucleocytoplasmic transport. Proc. Natl. Acad. Sci. USA. 2006;103:9512–9517. doi: 10.1073/pnas.0603521103. [DOI] [PMC free article] [PubMed] [Google Scholar]
- 12.Rout M.P., Aitchison J.D., Chait B.T. Virtual gating and nuclear transport: the hole picture. Trends Cell Biol. 2003;13:622–628. doi: 10.1016/j.tcb.2003.10.007. [DOI] [PubMed] [Google Scholar]
- 13.Frey S., Görlich D. A saturated FG-repeat hydrogel can reproduce the permeability properties of nuclear pore complexes. Cell. 2007;130:512–523. doi: 10.1016/j.cell.2007.06.024. [DOI] [PubMed] [Google Scholar]
- 14.Patel S.S., Belmont B.J., Rexach M.F. Natively unfolded nucleoporins gate protein diffusion across the nuclear pore complex. Cell. 2007;129:83–96. doi: 10.1016/j.cell.2007.01.044. [DOI] [PubMed] [Google Scholar]
- 15.Reid R.J.D., Lisby M., Rothstein R. Cloning-free genome alterations in Saccharomyces cerevisiae using adaptamer-mediated PCR. Methods Enzymol. 2002;350:258–277. doi: 10.1016/s0076-6879(02)50968-x. [DOI] [PubMed] [Google Scholar]
- 16.Sheff M.A., Thorn K.S. Optimized cassettes for fluorescent protein tagging in Saccharomyces cerevisiae. Yeast. 2004;21:661–670. doi: 10.1002/yea.1130. [DOI] [PubMed] [Google Scholar]
- 17.Thompson R.B., Gryczynski I., Malicka J. Fluorescence polarization standards for high-throughput screening and imaging. Biotechniques. 2002;32:34–41. doi: 10.2144/02321bm03. 37–38., 40, 42. [DOI] [PubMed] [Google Scholar]
- 18.Clayton A.H.A., Hanley Q.S., Jovin T.M. Dynamic fluorescence anisotropy imaging microscopy in the frequency domain (rFLIM) Biophys. J. 2002;83:1631–1649. doi: 10.1016/S0006-3495(02)73932-5. [DOI] [PMC free article] [PubMed] [Google Scholar]
- 19.Swaminathan R., Hoang C.P., Verkman A.S. Photobleaching recovery and anisotropy decay of green fluorescent protein GFP-S65T in solution and cells: cytoplasmic viscosity probed by green fluorescent protein translational and rotational diffusion. Biophys. J. 1997;72:1900–1907. doi: 10.1016/S0006-3495(97)78835-0. [DOI] [PMC free article] [PubMed] [Google Scholar]
- 20.Frank J., Radermacher M., Leith A. SPIDER and WEB: processing and visualization of images in 3D electron microscopy and related fields. J. Struct. Biol. 1996;116:190–199. doi: 10.1006/jsbi.1996.0030. [DOI] [PubMed] [Google Scholar]
- 21.Yang Q., Rout M.P., Akey C.W. Three-dimensional architecture of the isolated yeast nuclear pore complex: functional and evolutionary implications. Mol. Cell. 1998;1:223–234. doi: 10.1016/s1097-2765(00)80023-4. [DOI] [PubMed] [Google Scholar]
- 22.Volkmer A., Subramaniam V., Jovin T.M. One- and two-photon excited fluorescence lifetimes and anisotropy decays of green fluorescent proteins. Biophys. J. 2000;78:1589–1598. doi: 10.1016/S0006-3495(00)76711-7. [DOI] [PMC free article] [PubMed] [Google Scholar]
- 23.Chook Y.M., Blobel G. Karyopherins and nuclear import. Curr. Opin. Struct. Biol. 2001;11:703–715. doi: 10.1016/s0959-440x(01)00264-0. [DOI] [PubMed] [Google Scholar]
- 24.Grandi P., Schlaich N., Hurt E.C. Functional interaction of Nic96p with a core nucleoporin complex consisting of Nsp1p, Nup49p and a novel protein Nup57p. EMBO J. 1995;14:76–87. doi: 10.1002/j.1460-2075.1995.tb06977.x. [DOI] [PMC free article] [PubMed] [Google Scholar]
- 25.Hopper A.K., Banks F., Evangelidis V. A yeast mutant which accumulates precursor tRNAs. Cell. 1978;14:211–219. doi: 10.1016/0092-8674(78)90108-3. [DOI] [PubMed] [Google Scholar]
- 26.Schwoebel E.D., Ho T.H., Moore M.S. The mechanism of inhibition of Ran-dependent nuclear transport by cellular ATP depletion. J. Cell Biol. 2002;157:963–974. doi: 10.1083/jcb.200111077. [DOI] [PMC free article] [PubMed] [Google Scholar]
Associated Data
This section collects any data citations, data availability statements, or supplementary materials included in this article.