

Abstract
The influenza virus matrix protein 2 (M2) assembles into a tetramer in the host membrane during viral uncoating and maturation. It has been used as a model system to understand the relative contributions of protein-lipid and protein-protein interactions to membrane protein structure and association. Here we investigate the effect of lipid chain length on the association of the M2 transmembrane domain into tetramers using Förster resonance energy transfer. We observe that the interactions between the M2 helices are much stronger in 1,2-dilauroyl-sn-glycero-3-phosphocholine than in 1-palmitoyl-2-oleoyl-sn-glycero-3-phosphocholine bilayers. Thus, lipid chain length and bilayer thickness not only modulate peptide interactions, but could also be a major determinant of the association of transmembrane helices into functional membrane protein oligomers.
Introduction
Membrane protein folding and association present a challenging biophysical problem because it is difficult to predict the structure and stability of a membrane protein or a membrane protein complex based on its amino acid sequence (1,2). Although substantial progress has been made in resolving the folding problem for soluble proteins, studies of membrane protein folding have lagged behind, and the factors that determine membrane protein structure and stability remain to be elucidated (3,4). Nevertheless, it has become clear that the simplified view of membrane protein folding as a lateral association of transmembrane (TM) segments within a slab of hydrocarbon does not provide an adequate description of the process. In fact, the bilayer milieu is highly heterogeneous and complex (2), and the folding process is influenced by both protein-protein and protein-lipid interactions (5).
Because biological membranes contain a large variety of lipids, investigators have sought to determine the influence of lipid composition on the structure and function of folded membrane proteins (for review see Opekarová and Tanner (6)). For example, the structure and function of the membrane protein rhodopsin has been shown to depend on the lipid composition (7,8). However, the role of lipid composition in the association of TM helices into functional folded structures is not yet clear, mainly due to a lack of experimental methods that can reveal association thermodynamics in bilayer environments (3). Indeed, up until a few years ago, the thermodynamics of membrane protein association was studied primarily in detergent. Recently, however, new methods have been established (9–12) and studies of protein folding in the native bilayer environment have become feasible. Here we used one of those methods, Förster resonance energy transfer (FRET), to investigate the effect of the lipid chain length on the association of the influenza virus matrix protein 2 (M2) TM domain into a tetramer.
The influenza virus M2 protein assembles into a tetramer during viral uncoating and maturation and acts as a highly selective proton-conducting channel at low pH, and thus plays an important role in the life cycle of the influenza A virus (13–15). First, M2 exerts its channel activity in the endosomes, mediating the acidification of the viral core and the subsequent release of the viral genome in the cytoplasm during the uncoating process (16). Second, M2 plays a role in assembly of the amplified viruses and is believed to mediate the pH equilibration between the acidic lumen of the trans-Golgi networks (TGNs) and the neutral cytoplasm during exocytotic transport (14,17,18).
The protein consists of only 97 amino acids and thus is one of the smallest known selective ion channels (19–21). Residues 47–97 form the intracellular domain, which plays a role in pH sensing, viral assembly, and morphogenesis. The M2 TM domain (residues 22–46) was recently identified as the minimal functional unit of the protein that is capable of assembling into a ligand-activated proton channel (22). Similarly to the full-length protein, the isolated M2 TM helix has the ability to form tetramers, conduct protons, and bind amantadine (22–27). The structure of the tetramer has been determined, revealing a symmetric (or pseudosymmetric), left-handed, parallel tetramer bundle (28–35). So far, the ability of M2 TM to conduct protons has been proved in a variety of artificial and natural membrane systems, including oocytes (36), mammalian cells (37), and lipid bilayers (38).
The M2 tetramer has been used as a model system to elucidate the relative contributions of lipid-protein and protein-protein interactions to membrane protein folding. Using electron paramagnetic resonance (EPR) spectroscopy, Duong-Ly et al. (39) showed that the structure of the M2 tetramer depends on the lipid composition, with the tilt angle of the helices varying with the thickness of the bilayer. They proposed that the lipid composition is the major determinant of the M2 tetramer structure, with the helix tilt varying between 15° and 38° to minimize the hydrophobic mismatch between the tetramer and the lipid bilayer. On the other hand, the helix tilts determined using solid-state nuclear magnetic resonance (NMR) were identical in DOPC (33° ± 3°) and DMPC (37° ± 3°) (32).
Insights into the effect of lipid composition on the association of M2 into tetramers have come from a study utilizing a thiol-disulfide interchange method (11). This method yields the oligomeric states of TM helices containing cysteine residues in the presence of known concentrations of reduced and oxidized glutathione. For M2, these studies were possible because the disulfide bonds between cysteines in positions 17 and 19 have been shown to form, but are believed to be non-essential for the function of the protein (40,41). The peptide used in the thiol-exchange method studies comprised residues 19–46 and contained a single native Cys residue, thus reversibly forming intermolecular disulfides upon assembly. The amounts of monomers and tetramers were determined by high-performance liquid chromatography (HPLC) and matrix-assisted laser desorption/ionization time-of-flight (MALDI-TOF), and fitted to a tetramerization model. This work revealed that the lateral interactions between the M2 TM helices are modulated by phospholipid acyl chain length and cholesterol presence. In particular, the association was found to be stronger in 1-palmitoyl-2-oleoyl-sn-glycero-3-phosphocholine (POPC) than in 1,2-dilauroyl-sn-glycero-3-phosphocholine (DLPC), and became stronger upon cholesterol addition. However, the thiol exchange method is not optimal for investigations of the relative contributions of protein-protein and protein-lipid interactions to association thermodynamics because the readout (% covalent dimer) is sensitive to both oligomer structure and association thermodynamics. For instance, if the tetramer structure changes due to the lipid environment, as has been proposed, the probability for disulfide formation may be changed because the distance between the cysteines is changed. Thus, some oligomers may not be detectable by thiol exchange even though they exist.
An alternative method that can provide information about the association of TM helices in lipid bilayers is FRET (9,42). As compared with the thiol exchange method, FRET is much less sensitive to structure and thus allows us to focus exclusively on the thermodynamics of association. Therefore, we revisited the association of M2 into tetramers using FRET as the detection method. We investigated the effect of the lipid chain length on the association of M2 into tetramers in bilayers made of DLPC and POPC. These two bilayers have estimated hydrophobic core thicknesses of 19.5 Å and 26.5 Å, respectively (43). For this study we used the TM segment comprising residues 22–46 (i.e., the minimal functional unit of the protein (22) used in structural NMR (31,32) and EPR studies (39)), which does not include cysteines. Our results confirm that the lipid composition affects M2 association. However, the effects observed here are opposite to those observed with the dithiol exchange method and the longer peptide, in that the interactions between the M2 helices were stronger in DLPC than in POPC. Furthermore, the effect of the lipid chain length of the association of M2 was surprisingly strong. Therefore, it appears that the lipid chain length and thus the bilayer thickness not only modulate but could also be a major determinant of the association of TM helices into functional oligomers.
Materials and Methods
Peptide synthesis and purification
The TM domain of M2 of the influenza A virus (SSDPLVVAASIIGILHLILWILDRL) was synthesized on a ABI 433A peptide synthesizer using 9-fluorenylmethoxy-carbonyl (Fmoc) chemistry and a double coupling protocol. A second version of the peptide, CGGGSSDPLVVAASIIGILHLILWILDRL, was synthesized to produce a fluorescently labeled version of M2 for FRET studies. The GGG spacer was included to allow flexibility and free rotation of the dyes, thereby minimizing the effect of M2 tetramer structure on the measured FRET efficiency. The peptides were produced on a CLEAR resin with a substitution level of 0.4 mmol/g on a 0.1 mmol scale as previously described (44). After the synthesis was completed, the peptides were removed from the resin with the use of trifluoroacetic acid and ethane-1,2-dithiol as cleavage and scavenger/swelling agents, respectively. The peptides were lyophilized and purified via reverse-phase HPLC using a Varian ProStar HPLC, a C2 column, and a water/acetonitrile gradient. The purified peptides were lyophilized and then dissolved in 1,1,1,3,3,3-hexafluoroisopropanol (HFIP). The correct molecular weights of the peptides were confirmed using MALDI-TOF mass spectrometry performed with a Voyager DE-STR (Applied Biosystems, Carlsbad, CA). The peptide concentration was calculated based on measurements of the absorbance of the single tryptophan residue in the sequence with a Cary 50 spectrophotometer (Varian, Santa Clara, CA).
Labeling
After cleavage occurred, the CGGG-M2 TM peptides were labeled at the single cysteine with either tetramethylrhodamine (Rh) maleimide or BODIPY fluorescein (Fl) maleimide (Invitrogen, Carlsbad, CA). For labeling, the peptide stock in HFIP was dissolved in a mixture of 100 mM sodium phosphate buffer, water, and TFE, and mixed with at least a threefold excess of the reactive dye in methanol. After the mixture was shaken at 4°C overnight, the peptide solution was dried and then redissolved in HFIP/water (1:2) before HPLC purification. The purified peptide was lyophilized and the molecular weight was determined using MALDI-TOF. Labeling yields were determined by comparing dye and peptide concentrations. Briefly, the dye concentration was determined via UV/Vis spectroscopy and the peptide concentration was calculated from the circular dichroism (CD) spectra of the peptides in HFIP. The labeling yields for Fl-CGGGM2 and Rh-CGGGM2 were ∼70% and 100%, respectively.
Solution CD measurements
The helicity of the peptides was characterized by CD spectrometry with a Jasco 710 spectropolarimeter (Oklahoma City, OK). Liposomes for CD measurements were prepared by mixing peptides and lipids (POPC or DLPC; Alabaster, AL) in organic solvent, followed by removal of the solvent under a stream of nitrogen gas and hydration with 10 mM sodium phosphate buffer (pH 7, 500 mM NaCl). The final lipid concentration was 0.25 mg/mL and the peptide concentration in the liposomes was 2 mol % (peptide/lipid ratio = 1:50). The samples were vortexed, freeze-thawed three times, and sonicated for 2 min before CD spectra were collected. The lipid background was subtracted from the spectra before the data were plotted.
Oriented CD
Oriented CD (OCD) spectra were acquired for 2.5 mol % M2 in POPC or DLPC multilayers. Stocks of peptides in HFIP and lipids in chloroform were mixed in the appropriate ratio. The solution was deposited dropwise on a clean round quartz slide, allowing for solvent evaporation after each drop. The slide was placed in a custom-built humidity chamber and a drop of water was placed in close proximity before the chamber was sealed. Eight CD spectra were measured, and the chamber was rotated around the beam axis in an increment of 45° before each measurement. The spectra were averaged and corrected for the background CD signal of lipid multilayers without peptides.
FRET
Fluorescently labeled peptides (Fl-CGGGM2 and Rh-CGGGM2) and lipids (POPC or DLPC) were mixed in HFIP/chloroform and then dried under a stream of nitrogen gas. After the samples were redissolved in 10 mM sodium phosphate buffer (pH 7, 500 mM NaCl), they were vortexed, freeze-thawed three times, and sonicated in a bath sonicator for at least 2 min. All experiments were performed at room temperature.
In one series of experiments, the peptide concentration (i.e., the peptide/lipid ratio) was varied while the donor/acceptor ratio was maintained at 1:1. In a second set of experiments, the samples had different donor/acceptor ratios but constant peptide/lipid ratios (0.2 mol% peptide). Lipid samples with only fluorescein-labeled peptides (Fl-CGGGM2) or rhodamine-labeled peptides (Rh-CGGGM2) served as no-FRET controls. The final lipid concentration in each sample was 0.25 mg/mL.
Fluorescence spectra were measured in a Fluorolog fluorimeter (Jobin Yvon, Edison, NJ). Emission spectra were collected from 450 nm to 700 nm with a fixed excitation wavelength at 439 nm. The FRET efficiency was calculated from measurements of donor intensity at 514 nm according to the following equation: FRET = (ID − IDA)/ID (where IDA and ID are the donor intensities at 514 nm in the presence and absence of the acceptor, respectively). FRET efficiencies measured for varying donor/acceptor-ratios were fitted to the following equation: FRET = K(1 − (1 − acceptor_fraction)m−1) (where K is a constant and m is the number of subunits in the assembled structure (m = 4 for a tetramer)). This is the prediction for the FRET efficiency in a tetramer with four peptides that are labeled with either a donor or an acceptor and are mixed randomly (45–47).
To verify the measured FRET efficiencies, in some cases 0.5% Triton X-100 was added to vesicles with donor- and acceptor-labeled peptides. Triton X-100 breaks the liposomes and thus unquenches the donor fluorescence, yielding the no-FRET control for the sample. After Triton X-100 addition, the samples were mixed and remeasured after 10 min. The FRET efficiency was calculated according to the following equation: FRET = (IT − IDA)/IT (where IT is the donor intensity at 514 nm after Triton addition, and IDA is the donor intensity at 514 nm before Triton addition).
Results and Discussion
Secondary structure of the M2 TM domain
The secondary structure of M2 TM domains was characterized by CD. In Fig. 1 we show the CD spectra of M2 TM domain, as well as CGGGM2 labeled with the FRET pair of BODIPY-fluorescein and rhodamine at the N-terminal cysteine (Fl-CGGGM2 and Rh-CGGGM2) in HFIP. The three CD spectra are identical, demonstrating that the CGGG tail and the fluorescent dyes do not affect the helical secondary structure of M2 in organic solvent. In Fig. 2 we show the M2 CD spectra in POPC and DLPC liposomes. Despite spectral distortions due to light scattering (9,48) and absorption flattening (49–51), these spectra exhibit minima at 208 nm and 222 nm, and are thus consistent with α-helical structure.
Figure 1.
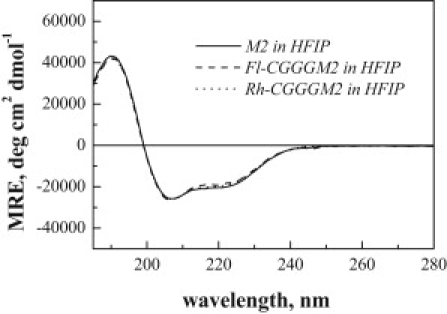
CD spectra (mean residue ellipticity versus wavelength) of the M2 TM domain in HFIP. The CGGG N-terminal tail and the fluorescent dyes do not perturb the helical secondary structure of M2.
Figure 2.
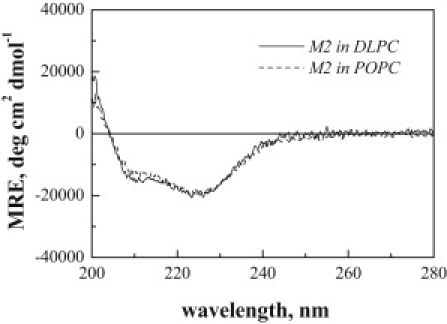
CD spectra of M2 in DLPC (solid line) and POPC (dashed line) vesicles. The samples were prepared by premixing peptides and lipids in HFIP/chloroform, followed by solvent removal and hydration with 10 mM sodium phosphate buffer, pH 7, 500 mM NaCl. The samples were freeze-thawed three times and sonicated to achieve full equilibration. The peptide concentration in the vesicles was 2 mol %. The M2 peptides are helical in POPC and DLPC bilayers.
To probe whether the orientation of the peptides is transmembrane, we used OCD. OCD provides an easy way to assess the disposition of a helix in the bilayer. As shown by the theoretical OCD spectra in Fig. 3 A, TM helices exhibit a single minimum around 220–230 nm and a maximum around 200 nm. In contrast, the OCD spectra of helices that are parallel to the membrane plane have much larger amplitudes and minima at ∼208 nm and 222 nm (52,53). Therefore, OCD could be used to assess helix tilt with respect to the bilayer normal. However, the precision of such measurements is rather low (10–20° (44,54)) compared to solid-state NMR (a few degrees). Experimental limitations arise because the amplitude of the OCD signal for TM helices is low and is similar to the OCD amplitude of the lipid background. Furthermore, the OCD signal for the lipids, which are also chiral, is affected by the peptide-induced bilayer perturbations. Despite these limitations, however, OCD can reliably distinguish a TM helix that transverses the bilayer from a helix that is parallel to the bilayer surface, because of the large differences in both shape and amplitude of the respective spectra (Fig. 3 A).
Figure 3.
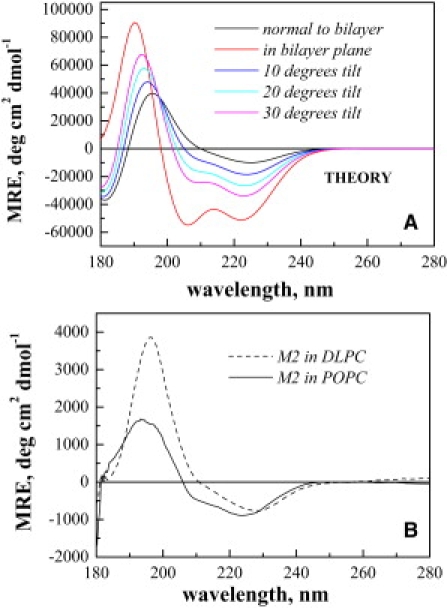
Oriented CD spectra of M2. (A) Theoretical OCD helix spectra. (B) Experimental OCD spectra of M2 in oriented DLPC (dashed line) and POPC (solid line) multilayers. The peptide was mixed with the lipids in HFIP/chloroform, deposited dropwise on a quartz slide, and hydrated to form multilayers. The experimental spectra are the average of eight discrete scans and are corrected for the lipid background (see Materials and Methods). Although the average tilt angle in POPC may be slightly higher, the spectra suggest that the peptides are predominantly transmembrane in both bilayers.
In Fig. 3 B we show the OCD spectra of M2 in POPC and DLPC. As described in Materials and Methods, the OCD samples were hydrated multilayers that were perpendicular to the beam. The experimental spectrum of M2 in DLPC in Fig. 3 B has a low amplitude and a single minimum around 230 nm, indicating that the M2 TM domain is normal to the DLPC bilayer. The spectrum in POPC is similar, although the 208 nm minimum is also visible. Although the latter may be indicative of a slight tilt, a comparison between the theoretical and experimental spectra in Fig. 3 suggests that this tilt does not exceed ∼20°. Alternatively, the difference between the two spectra may be due to differences in the oligomerization state of the peptides, or to the presence of a small non-TM M2 fraction in POPC. Yet, the OCD spectra suggest that the M2 peptides span both POPC and DLPC bilayers.
A question may arise as to whether the OCD spectra are affected by optical absorbance or light scattering. We therefore measured the optical densities of the OCD and liposome samples, and we show the spectra in Fig. 4. Whereas the absorbance of the liposome samples sharply increases below 210 nm, leading to a decrease in the amplitude and hence a distortion of the solution CD spectrum in this region (see Fig. 2), the OCD sample is nearly transparent over the wavelength range of interest. For example, the optical density of the OCD sample is ∼0.1 at 208 nm, indicating that the transmittance is 80% at this wavelength. Thus, the OCD spectrum is not significantly affected by absorbance or light scattering, and provides reliable information about M2 disposition in the bilayers.
Figure 4.

Optical densities measured for liposome solutions (dashed line) and OCD samples (solid line). Although the absorbance of liposome samples sharply increases below 210 nm, OCD samples are nearly transparent above 200 nm.
Association of M2 in POPC and DLPC bilayers
For the FRET experiments, the M2 TM domain was labeled with the FRET pair of BODIPY-fluorescein/rhodamine (Fl/Rh). To ensure that the FRET efficiency did not depend on the orientation of the dyes or on the M2 tetramer structure, the dyes were attached to the N-terminal Cys, and a GGG spacer was used to allow free rotation of the dyes. Fig. 5 shows typical emission spectra of liposomes containing 1), Fl-CGGGM2 (donor only, solid line); 2), Rh-CGGGM2 (acceptor only, dotted line); or 3), both Fl-CGGGM2 and Rh-CGGGM2 (donor+acceptor, dashed line). As discussed in Materials and Methods, the FRET efficiency is calculated from the decrease in donor emission at 514 nm in the presence of the acceptor. Unlike detergent samples, which allow easy equilibration of peptides and lipids, the donor and the donor+acceptor lipid samples have to be prepared independently from stocks of lipids and labeled peptides (9). Although the donor concentration must be exactly the same in these two samples, the low solubility of the hydrophobic TM helices can introduce sample-to-sample variations in protein concentrations, leading to possible errors in the measured FRET efficiencies (55). That is why we use an alternative approach, as introduced here, to calculate FRET. Briefly, we add 0.5% Triton X-100 to measured samples with donor- and acceptor-labeled peptides. Triton X-100 breaks the liposomes and thus unquenches the donor fluorescence, yielding a no-FRET control with the exact donor concentration.
Figure 5.
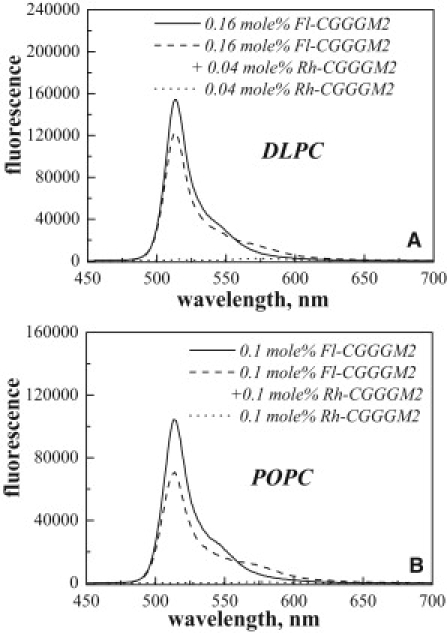
Emission spectra of Fl/Rh-labeled CGGGM2 in (A) DLPC and (B) POPC vesicles. The excitation was fixed at 439 nm such that only fluorescein was directly excited. The emission was scanned from 450 nm to 700 nm. FRET efficiency is calculated from the decrease in fluorescein emission at 514 nm in the presence of the acceptor rhodamine.
In Fig. 6 we show the measured FRET efficiency as a function of total peptide concentration in liposomes made of DLPC and POPC (donor/acceptor ratio = 1). Some of the FRET efficiencies in DLPC were calculated by comparing two samples of identical donor concentration (solid squares), whereas others (solid circles) were calculated after the addition of Triton. The two methods yielded very similar results, suggesting that the Triton addition method is a valid approach for measuring FRET efficiencies in liposomes.
Figure 6.
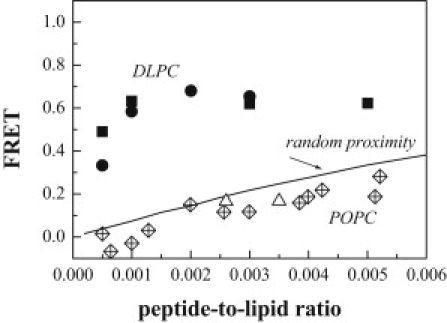
Measured FRET efficiency as a function of the peptide/lipid ratio. The ratio of donor-labeled to acceptor-labeled peptides was kept constant at 1:1. Solid symbols (squares and circles): FRET efficiency measured in DLPC vesicles, pH = 7. Solid squares: FRET was measured by comparing two samples with identical Fl-CGGGM2 concentrations, with and without acceptor. Solid circles: FRET was measured by acquiring spectra before and after Triton addition, which dequenches the donor fluorescence. Crossed diamonds: FRET measured in POPC vesicles, pH = 7. Open triangles: FRET in POPC vesicles, pH = 8.6. Solid line: FRET due to random colocalization (proximity) of donors and acceptors. Although the FRET efficiency in POPC vesicles is similar to that expected for random fluorophore proximity, the FRET efficiency in DLPC vesicles is much higher.
As shown in Fig. 6, measurements in POPC yielded a much lower FRET efficiency as compared to DLPC. Note that the same peptide stocks were used in the POPC and DLPC experiments. Therefore, the difference in the measured FRET efficiency is due to the different lipid environments and reflects differences in the association of the peptides in the two bilayers. We thus conclude that the propensity for M2 association is higher in DLPC than in POPC, in contrast to previous findings for a longer M2 TM segment (11).
Next, we investigated how the measured FRET efficiencies compare with the case in which there are no specific interactions between the peptides. Even in this case, FRET arising from random colocalization of donors and acceptors (proximity effects) will be recorded (9,56,57). In our experiments we used a low peptide concentration, and the average distances between the peptides always exceeded the Förster radius for Fl/Rh (55 Å); however, because the peptides diffuse in the bilayers, FRET can occur if an acceptor comes in contact with a donor. The FRET efficiency due to proximity effects can be estimated computationally (58). The calculation of proximity FRET as the average of 1000 different acceptor configurations is shown in Fig. 6 for R0 = 55 Å, the Forster radius for the Fl/Rh FRET pair (solid line). The solid curve is similar to the experimental data for POPC, suggesting that proximity effects can describe the observed FRET signal, and therefore interactions between M2 are very weak or nonexistent in POPC.
Previous structural studies were carried out under the assumption that M2 is fully tetrameric. NMR studies were performed for M2 concentrations in the range from 3–12 mol % (29–32), whereas in EPR studies the concentration was lower: 1 mol % protein (39). The assumption of tetramers is consistent with the high FRET efficiency we observe in DLPC bilayers. However, the data in Fig. 6 suggest that M2 is monomeric in POPC up to concentrations of 0.5 mol %. The EPR studies were performed at pH 8.6, and therefore we sought to determine whether increasing the pH to 8.6 would affect the association in POPC. The measured FRET efficiencies in POPC at pH 8.6 are shown in Fig. 6 (open triangles). The results obtained at pH 7 and 8.6 are similar, and there are no indications of specific M2 interactions in POPC at pH 8.6.
Next, we measured FRET efficiencies in DLPC for a constant peptide/lipid ratio and a varying donor/acceptor ratio (Fig. 7, solid circles). A linear dependence of the energy transfer on the acceptor mole ratio is indicative of sequence-specific dimer formation (9,45,46,59). Deviation from linearity indicates the formation of higher-order aggregates (46). A fit describing tetramer formation is shown in Fig. 7 (solid line) and provides an adequate description of the DLPC data. Overall, the data in Figs. 6 and 7 demonstrate that M2 is monomeric in POPC but forms tetramers in DLPC.
Figure 7.
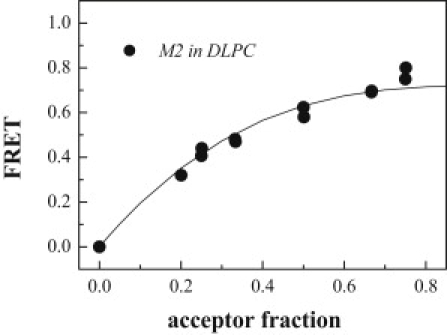
Measured FRET efficiency for M2 in DLPC vesicles as a function of the acceptor mole fraction. The peptide/lipid ratio was kept constant at 0.2 mol % peptide. The data (solid circles) follow the equation FRET = K(1 − (1 − acceptor_fraction)m−1) with m = 4, describing tetramer formation.
Finally, it may seem surprising that the monomeric M2 peptide spans the POPC bilayer, with some hydrophilic amino acids in direct contact with lipids. During the last decade, research has demonstrated that hydrophilic or charged amino acids can insert into bilayers if they are driven by the hydrophobicity of the neighboring amino acids (54,61,62). The M2 sequence is rich in leucines and isoleucines, which are predicted to drive the stable insertion of the helix into the bilayer (63).
Conclusions
In this study we investigated the association of the TM domain of M2 in lipid bilayers composed of POPC and DLPC with hydrophobic core thickness of 26.5 Å and 19.5 Å, respectively. The M2 sequence used comprised residues 22–46, which have been identified as the smallest functional part of the M2 full-length protein. The same sequence was previously used for structural NMR and EPR studies. Here, we studied M2 association into tetramers using FRET, and we observed that the lipid chain length and therefore the thickness of the bilayer modulates the association of the M2 peptide. The effect was surprisingly strong, and the data suggest association into tetramers in DLPC but no interactions in POPC. Overall, this work demonstrates that the bilayer thickness not only modulates but can also make a major contribution to the folding and association of membrane proteins.
Acknowledgments
We thank the members of the Hristova laboratory and P. Stahl and Y. Li for technical help, and Dr. W. C. Wimley for many useful discussions.
This work was supported in part by grants from the National Institutes of Health (GM68609), the National Science Foundation (MCB 071881), and Deutscher Akademischer Austausch Dienst. S.S. received support from the Bayer Science and Education Foundation.
Footnotes
Sandra Schick's present address is Johannes Gutenberg University, Mainz, Germany.
Edwin Li's present address is Biology Department, Saint Joseph's University, Philadelphia, PA.
References
- 1.White S.H., Wimley W.C. Membrane protein folding and stability: physical principles. Annu. Rev. Biophys. Biomol. Struct. 1999;28:319–365. doi: 10.1146/annurev.biophys.28.1.319. [DOI] [PubMed] [Google Scholar]
- 2.White S.H., Ladokhin A.S., Hristova K. How membranes shape protein structure. J. Biol. Chem. 2001;276:32395–32398. doi: 10.1074/jbc.R100008200. [DOI] [PubMed] [Google Scholar]
- 3.Hong H., Joh N.H., Tamm L.K. Methods for measuring the thermodynamic stability of membrane proteins. Methods Enzymol. 2009;455:213–236. doi: 10.1016/S0076-6879(08)04208-0. [DOI] [PubMed] [Google Scholar]
- 4.Mackenzie K.R. Folding and stability of α-helical integral membrane proteins. Chem. Rev. 2006;106:1931–1977. doi: 10.1021/cr0404388. [DOI] [PubMed] [Google Scholar]
- 5.Han X., Hristova K., Wimley W.C. Protein folding in membranes: insights from neutron diffraction studies of a membrane β-sheet oligomer. Biophys. J. 2008;94:492–505. doi: 10.1529/biophysj.107.113183. [DOI] [PMC free article] [PubMed] [Google Scholar]
- 6.Opekarová M., Tanner W. Specific lipid requirements of membrane proteins—a putative bottleneck in heterologous expression. Biochim. Biophys. Acta. 2003;1610:11–22. doi: 10.1016/s0005-2736(02)00708-3. [DOI] [PubMed] [Google Scholar]
- 7.Botelho A.V., Gibson N.J., Brown M.F. Conformational energetics of rhodopsin modulated by nonlamellar-forming lipids. Biochemistry. 2002;41:6354–6368. doi: 10.1021/bi011995g. [DOI] [PubMed] [Google Scholar]
- 8.Botelho A.V., Huber T., Brown M.F. Curvature and hydrophobic forces drive oligomerization and modulate activity of rhodopsin in membranes. Biophys. J. 2006;91:4464–4477. doi: 10.1529/biophysj.106.082776. [DOI] [PMC free article] [PubMed] [Google Scholar]
- 9.You M., Li E., Hristova K. FRET in liposomes: measurements of TM helix dimerization in the native bilayer environment. Anal. Biochem. 2005;340:154–164. doi: 10.1016/j.ab.2005.01.035. [DOI] [PMC free article] [PubMed] [Google Scholar]
- 10.Duong M.T., Jaszewski T.M., MacKenzie K.R. Changes in apparent free energy of helix-helix dimerization in a biological membrane due to point mutations. J. Mol. Biol. 2007;371:422–434. doi: 10.1016/j.jmb.2007.05.026. [DOI] [PMC free article] [PubMed] [Google Scholar]
- 11.Cristian L., Lear J.D., DeGrado W.F. Use of thiol-disulfide equilibria to measure the energetics of assembly of transmembrane helices in phospholipid bilayers. Proc. Natl. Acad. Sci. USA. 2003;100:14772–14777. doi: 10.1073/pnas.2536751100. [DOI] [PMC free article] [PubMed] [Google Scholar]
- 12.Chen L., Novicky L., Hristova K. Measuring the energetics of membrane protein dimerization in mammalian membranes. J. Am. Chem. Soc. 2010;132:3628–3635. doi: 10.1021/ja910692u. [DOI] [PMC free article] [PubMed] [Google Scholar]
- 13.Lamb R.A., Zebedee S.L., Richardson C.D. Influenza virus M2 protein is an integral membrane protein expressed on the infected-cell surface. Cell. 1985;40:627–633. doi: 10.1016/0092-8674(85)90211-9. [DOI] [PubMed] [Google Scholar]
- 14.Takeuchi K., Lamb R.A. Influenza virus M2 protein ion channel activity stabilizes the native form of fowl plague virus hemagglutinin during intracellular transport. J. Virol. 1994;68:911–919. doi: 10.1128/jvi.68.2.911-919.1994. [DOI] [PMC free article] [PubMed] [Google Scholar]
- 15.Chizhmakov I.V., Geraghty F.M., Hay A.J. Selective proton permeability and pH regulation of the influenza virus M2 channel expressed in mouse erythroleukaemia cells. J. Physiol. 1996;494:329–336. doi: 10.1113/jphysiol.1996.sp021495. [DOI] [PMC free article] [PubMed] [Google Scholar]
- 16.Wharton S.A., Belshe R.B., Hay A.J. Role of virion M2 protein in influenza virus uncoating: specific reduction in the rate of membrane fusion between virus and liposomes by amantadine. J. Gen. Virol. 1994;75:945–948. doi: 10.1099/0022-1317-75-4-945. [DOI] [PubMed] [Google Scholar]
- 17.Ciampor F., Bayley P.M., Hay A.J. Evidence that the amantadine-induced, M2-mediated conversion of influenza A virus hemagglutinin to the low pH conformation occurs in an acidic trans Golgi compartment. Virology. 1992;188:14–24. doi: 10.1016/0042-6822(92)90730-d. [DOI] [PubMed] [Google Scholar]
- 18.Sugrue R.J., Bahadur G., Hay A.J. Specific structural alteration of the influenza haemagglutinin by amantadine. EMBO J. 1990;9:3469–3476. doi: 10.1002/j.1460-2075.1990.tb07555.x. [DOI] [PMC free article] [PubMed] [Google Scholar]
- 19.Pinto L.H., Dieckmann G.R., DeGrado W.F. A functionally defined model for the M2 proton channel of influenza A virus suggests a mechanism for its ion selectivity. Proc. Natl. Acad. Sci. USA. 1997;94:11301–11306. doi: 10.1073/pnas.94.21.11301. [DOI] [PMC free article] [PubMed] [Google Scholar]
- 20.Pinto L.H., Lamb R.A. The M2 proton channels of influenza A and B viruses. J. Biol. Chem. 2006;281:8997–9000. doi: 10.1074/jbc.R500020200. [DOI] [PubMed] [Google Scholar]
- 21.Stouffer A.L., Ma C.L., DeGrado W.F. The interplay of functional tuning, drug resistance, and thermodynamic stability in the evolution of the M2 proton channel from the influenza A virus. Structure. 2008;16:1067–1076. doi: 10.1016/j.str.2008.04.011. [DOI] [PMC free article] [PubMed] [Google Scholar]
- 22.Ma C.L., Polishchuk A.L., Pinto L.H. Identification of the functional core of the influenza A virus A/M2 proton-selective ion channel. Proc. Natl. Acad. Sci. USA. 2009;106:12283–12288. doi: 10.1073/pnas.0905726106. [DOI] [PMC free article] [PubMed] [Google Scholar]
- 23.Duff K.C., Kelly S.M., Bradshaw J.P. The secondary structure of influenza A M2 transmembrane domain. A circular dichroism study. FEBS Lett. 1992;311:256–258. doi: 10.1016/0014-5793(92)81114-2. [DOI] [PubMed] [Google Scholar]
- 24.Tosteson M.T., Pinto L.H., Lamb R.A. Reconstitution of the influenza virus M2 ion channel in lipid bilayers. J. Membr. Biol. 1994;142:117–126. doi: 10.1007/BF00233389. [DOI] [PubMed] [Google Scholar]
- 25.Duff K.C., Ashley R.H. The transmembrane domain of influenza A M2 protein forms amantadine-sensitive proton channels in planar lipid bilayers. Virology. 1992;190:485–489. doi: 10.1016/0042-6822(92)91239-q. [DOI] [PubMed] [Google Scholar]
- 26.Duff K.C., Gilchrist P.J., Bradshaw J.P. Neutron diffraction reveals the site of amantadine blockade in the influenza A M2 ion channel. Virology. 1994;202:287–293. doi: 10.1006/viro.1994.1345. [DOI] [PubMed] [Google Scholar]
- 27.Salom D., Hill B.R., DeGrado W.F. pH-dependent tetramerization and amantadine binding of the transmembrane helix of M2 from the influenza A virus. Biochemistry. 2000;39:14160–14170. doi: 10.1021/bi001799u. [DOI] [PMC free article] [PubMed] [Google Scholar]
- 28.Stouffer A.L., Acharya R., DeGrado W.F. Structural basis for the function and inhibition of an influenza virus proton channel. Nature. 2008;451:596–599. doi: 10.1038/nature06528. [DOI] [PMC free article] [PubMed] [Google Scholar]
- 29.Tian C.L., Tobler K., Cross T.A. Expression and initial structural insights from solid-state NMR of the M2 proton channel from influenza A virus. Biochemistry. 2002;41:11294–11300. doi: 10.1021/bi025695q. [DOI] [PubMed] [Google Scholar]
- 30.Nishimura K., Kim S.G., Cross T.A. The closed state of a H+ channel helical bundle combining precise orientational and distance restraints from solid state NMR. Biochemistry. 2002;41:13170–13177. doi: 10.1021/bi0262799. [DOI] [PubMed] [Google Scholar]
- 31.Kovacs F.A., Cross T.A. Transmembrane four-helix bundle of influenza A M2 protein channel: structural implications from helix tilt and orientation. Biophys. J. 1997;73:2511–2517. doi: 10.1016/S0006-3495(97)78279-1. [DOI] [PMC free article] [PubMed] [Google Scholar]
- 32.Kovacs F.A., Denny J.K., Cross T.A. Helix tilt of the M2 transmembrane peptide from influenza A virus: an intrinsic property. J. Mol. Biol. 2000;295:117–125. doi: 10.1006/jmbi.1999.3322. [DOI] [PubMed] [Google Scholar]
- 33.Schnell J.R., Chou J.J. Structure and mechanism of the M2 proton channel of influenza A virus. Nature. 2008;451:591–595. doi: 10.1038/nature06531. [DOI] [PMC free article] [PubMed] [Google Scholar]
- 34.Hu J., Fu R., Cross T.A. Histidines, heart of the hydrogen ion channel from influenza A virus: toward an understanding of conductance and proton selectivity. Proc. Natl. Acad. Sci. USA. 2006;103:6865–6870. doi: 10.1073/pnas.0601944103. [DOI] [PMC free article] [PubMed] [Google Scholar]
- 35.Cady S.D., Mishanina T.V., Hong M. Structure of amantadine-bound M2 transmembrane peptide of influenza A in lipid bilayers from magic-angle-spinning solid-state NMR: the role of Ser31 in amantadine binding. J. Mol. Biol. 2009;385:1127–1141. doi: 10.1016/j.jmb.2008.11.022. [DOI] [PMC free article] [PubMed] [Google Scholar]
- 36.Wang C., Takeuchi K., Lamb R.A. Ion channel activity of influenza A virus M2 protein: characterization of the amantadine block. J. Virol. 1993;67:5585–5594. doi: 10.1128/jvi.67.9.5585-5594.1993. [DOI] [PMC free article] [PubMed] [Google Scholar]
- 37.Wang C., Lamb R.A., Pinto L.H. Direct measurement of the influenza A virus M2 protein ion channel activity in mammalian cells. Virology. 1994;205:133–140. doi: 10.1006/viro.1994.1628. [DOI] [PubMed] [Google Scholar]
- 38.Vijayvergiya V., Wilson R., Busath D.D. Proton conductance of influenza virus M2 protein in planar lipid bilayers. Biophys. J. 2004;87:1697–1704. doi: 10.1529/biophysj.104.043018. [DOI] [PMC free article] [PubMed] [Google Scholar]
- 39.Duong-Ly K.C., Nanda V., Howard K.P. The conformation of the pore region of the M2 proton channel depends on lipid bilayer environment. Protein Sci. 2005;14:856–861. doi: 10.1110/ps.041185805. [DOI] [PMC free article] [PubMed] [Google Scholar]
- 40.Holsinger L.J., Lamb R.A. Influenza virus M2 integral membrane protein is a homotetramer stabilized by formation of disulfide bonds. Virology. 1991;183:32–43. doi: 10.1016/0042-6822(91)90115-r. [DOI] [PubMed] [Google Scholar]
- 41.Castrucci M.R., Hughes M., Kawaoka Y. The cysteine residues of the M2 protein are not required for influenza A virus replication. Virology. 1997;238:128–134. doi: 10.1006/viro.1997.8809. [DOI] [PubMed] [Google Scholar]
- 42.Merzlyakov M., Hristova K. Forster resonance energy transfer measurements of transmembrane helix dimerization energetics. Methods Enzymol. 2008;450:107–127. doi: 10.1016/S0076-6879(08)03406-X. [DOI] [PMC free article] [PubMed] [Google Scholar]
- 43.de Planque M.R.R., Killian J.A. Protein-lipid interactions studied with designed transmembrane peptides: role of hydrophobic matching and interfacial anchoring. Mol. Membr. Biol. 2003;20:271–284. doi: 10.1080/09687680310001605352. (Review) [DOI] [PubMed] [Google Scholar]
- 44.Iwamoto T., You M., Hristova K. Synthesis and initial characterization of FGFR3 transmembrane domain: consequences of sequence modifications. Biochim. Biophys. Acta. 2005;1668:240–247. doi: 10.1016/j.bbamem.2004.12.012. [DOI] [PubMed] [Google Scholar]
- 45.Adair B.D., Engelman D.M. Glycophorin A helical transmembrane domains dimerize in phospholipid bilayers: a resonance energy transfer study. Biochemistry. 1994;33:5539–5544. doi: 10.1021/bi00184a024. [DOI] [PubMed] [Google Scholar]
- 46.Li M., Reddy L.G., Thomas D.D. A fluorescence energy transfer method for analyzing protein oligomeric structure: application to phospholamban. Biophys. J. 1999;76:2587–2599. doi: 10.1016/S0006-3495(99)77411-4. [DOI] [PMC free article] [PubMed] [Google Scholar]
- 47.Raicu V., Jansma D.B., Friesen J.D. Protein interaction quantified in vivo by spectrally resolved fluorescence resonance energy transfer. Biochem. J. 2005;385:265–277. doi: 10.1042/BJ20040226. [DOI] [PMC free article] [PubMed] [Google Scholar]
- 48.Chen L., Merzlyakov M., Hristova K. Energetics of ErbB1 transmembrane domain dimerization in lipid bilayers. Biophys. J. 2009;96:4622–4630. doi: 10.1016/j.bpj.2009.03.004. [DOI] [PMC free article] [PubMed] [Google Scholar]
- 49.Duysens L.N.M. The flattening of the absorption spectrum of suspensions, as compared to that of solutions. Biochim. Biophys. Acta. 1956;19:1–12. doi: 10.1016/0006-3002(56)90380-8. [DOI] [PubMed] [Google Scholar]
- 50.Wallace B.A., Mao D. Circular dichroism analyses of membrane proteins: an examination of differential light scattering and absorption flattening effects in large membrane vesicles and membrane sheets. Anal. Biochem. 1984;142:317–328. doi: 10.1016/0003-2697(84)90471-8. [DOI] [PubMed] [Google Scholar]
- 51.Wallace B.A., Teeters C.L. Differential absorption flattening optical effects are significant in the circular dichroism spectra of large membrane fragments. Biochemistry. 1987;26:65–70. doi: 10.1021/bi00375a010. [DOI] [PubMed] [Google Scholar]
- 52.Hristova K., Wimley W.C., White S.H. An amphipathic α-helix at a membrane interface: a structural study using a novel X-ray diffraction method. J. Mol. Biol. 1999;290:99–117. doi: 10.1006/jmbi.1999.2840. [DOI] [PubMed] [Google Scholar]
- 53.Hristova K., Dempsey C.E., White S.H. Structure, location, and lipid perturbations of melittin at the membrane interface. Biophys. J. 2001;80:801–811. doi: 10.1016/S0006-3495(01)76059-6. [DOI] [PMC free article] [PubMed] [Google Scholar]
- 54.Han X., Mihailescu M., Hristova K. Neutron diffraction studies of fluid bilayers with transmembrane proteins: structural consequences of the achondroplasia mutation. Biophys. J. 2006;91:3736–3747. doi: 10.1529/biophysj.106.092247. [DOI] [PMC free article] [PubMed] [Google Scholar]
- 55.Merzlyakov M., Chen L., Hristova K. Studies of receptor tyrosine kinase transmembrane domain interactions: the EmEx-FRET method. J. Membr. Biol. 2007;215:93–103. doi: 10.1007/s00232-007-9009-0. [DOI] [PMC free article] [PubMed] [Google Scholar]
- 56.Li E., You M., Hristova K. Sodium dodecyl sulfate-polyacrylamide gel electrophoresis and Forster resonance energy transfer suggest weak interactions between FGFR3 TM domains in the absence of extracellular domains and ligands. Biochemistry. 2005;44:352–360. doi: 10.1021/bi048480k. [DOI] [PubMed] [Google Scholar]
- 57.Posokhov Y.O., Merzlyakov M., Ladokhin A.S. A simple “proximity” correction for Förster resonance energy transfer efficiency determination in membranes using lifetime measurements. Anal. Biochem. 2008;380:134–136. doi: 10.1016/j.ab.2008.05.041. [DOI] [PMC free article] [PubMed] [Google Scholar]
- 58.Wolber P.K., Hudson B.S. An analytic solution to the Förster energy transfer problem in two dimensions. Biophys. J. 1979;28:197–210. doi: 10.1016/S0006-3495(79)85171-1. [DOI] [PMC free article] [PubMed] [Google Scholar]
- 59.Li E., Hristova K. Imaging Forster resonance energy transfer measurements of transmembrane helix interactions in lipid bilayers on a solid support. Langmuir. 2004;20:9053–9060. doi: 10.1021/la048676l. [DOI] [PubMed] [Google Scholar]
- 60.Reference deleted in proof.
- 61.Hessa T., White S.H., von Heijne G. Membrane insertion of a potassium-channel voltage sensor. Science. 2005;307:1427. doi: 10.1126/science.1109176. [DOI] [PubMed] [Google Scholar]
- 62.Hessa T., Kim H., von Heijne G. Recognition of transmembrane helices by the endoplasmic reticulum translocon. Nature. 2005;433:377–381. doi: 10.1038/nature03216. [DOI] [PubMed] [Google Scholar]
- 63.Snider C., Jayasinghe S., White S.H. MPEx: a tool for exploring membrane proteins. Protein Sci. 2009;18:2624–2628. doi: 10.1002/pro.256. [DOI] [PMC free article] [PubMed] [Google Scholar]