

Abstract
The physical mechanism of the folding and unfolding of chromatin is fundamentally related to transcription but is incompletely characterized and not fully understood. We experimentally and theoretically studied chromatin compaction by investigating the salt-mediated folding of an array made of 12 positioning nucleosomes with 177 bp repeat length. Sedimentation velocity measurements were performed to monitor the folding provoked by addition of cations Na+, K+, Mg2+, Ca2+, spermidine3+, Co(NH3)63+, and spermine4+. We found typical polyelectrolyte behavior, with the critical concentration of cation needed to bring about maximal folding covering a range of almost five orders of magnitude (from 2 μM for spermine4+ to 100 mM for Na+). A coarse-grained model of the nucleosome array based on a continuum dielectric description and including the explicit presence of mobile ions and charged flexible histone tails was used in computer simulations to investigate the cation-mediated compaction. The results of the simulations with explicit ions are in general agreement with the experimental data, whereas simple Debye-Hückel models are intrinsically incapable of describing chromatin array folding by multivalent cations. We conclude that the theoretical description of the salt-induced chromatin folding must incorporate explicit mobile ions that include ion correlation and ion competition effects.
Introduction
In the eukaryotic cell nucleus, DNA is complexed with histones to form nucleosomes, the regular part of which is the nucleosome core particle (NCP). This consists of 145–147 bp of DNA wrapped around the histone octamer, which is composed of two copies each of the four histone proteins H2A, H2B, H3, and H4 (1). Linker DNA of variable length connects the NCPs, forming nucleosome arrays that condense into 30-nm chromatin fibers (2,3). The unstructured, flexible, and positively charged N-terminal tails of each core histone protrude out through the DNA superhelix (1). The basic tails are necessary for the formation and maintenance of both the secondary and tertiary structures of chromatin, and participate in both intra- and interarray nucleosome-nucleosome interactions (2,3). The histone tails are also essential for regulation of transcription and replication (4,5). In vitro, the condensation of chromatin arrays is characterized by two transitions: array compaction to the 30 nm fiber, and aggregation of fibers to higher-order structures. Recent experiments indicate that aggregation of NCPs (6), as well as intraarray compaction (folding) and interarray aggregation of the chromatin arrays (7–15), is facilitated by bridging of tails between adjacent NCPs.
Well-defined segments of chromatin fibers (7,16) prepared by in vitro assembly from their histone and DNA components have been used to study the array folding process (10,12–15,17). The standard experiment for detecting folding is analytical ultracentrifugation (AUC) sedimentation velocity measurement. The sedimentation coefficient for a wild-type 12-mer array (here denoted the 12-177-601 array, having the 601 high-affinity nucleosome positioning sequence (18)) changes continuously from ∼35S in low monovalent salt buffer solution to ∼53S at 1 mM MgCl2 (the higher divalent salt concentration induces aggregation) (7). The general behavior of Mg-induced chromatin condensation suggests a dominating contribution of electrostatic interactions to chromatin compaction. It is well known that DNA spontaneously undergoes a collapse of single molecules and/or intermolecular aggregation upon addition of polycations of charge > +2 (19,20). A distinctive feature of such DNA condensation is a prominent oligocation-charge dependency of the concentration of oligocation needed to induce the transition (21). How similar polyelectrolyte effects influence chromatin folding and compaction beyond the effect of monovalent or divalent cations has rarely been addressed (22,23) and has yet to be established.
Despite recent progress, a theoretical description of the mechanism underlying chromatin condensation remains to be completed. A common feature of coarse-grained theoretical chromatin models (24–31), with the exception of our recent modeling of the NCP (32,33), is that the presence of salt is treated either with effective potentials or with a Debye-Hückel (DH) potential, sometimes including a mean field Poisson-Boltzmann (PB) model. As a result, contributions from ion competition, dynamic ion-ion correlations (34) due to fluctuations in both the tail configuration and the mobile cation distribution, as well as the influence of tail bridging (35), are not simultaneously taken into consideration. In the field of DNA condensation induced by multivalent ions, the importance of ion correlation effects are well established (19,34,36–38). Schlick and co-workers (25–27,30,31) presented detailed models that they applied to theoretical studies of salt-induced chromatin folding by using a DH approach to describe the effects of monovalent salt. The use of DH screening potentials may be justified in modeling systems with monovalent salt only, and do reproduce the experimental folding behavior well (25–27,30,31). Recent works (30,31), on the other hand, modeled the effects of divalent ions using a phenomenological modification of the Debye screening length for linker DNA interactions and modification of the DNA persistence length.
Here we present the experimental results of an AUC investigation of counterion-induced compaction of 12-177-601 chromatin arrays. We have, for the first time to our knowledge, completed a systematic study of the compaction for a range of oligocations of varying nature and charge ranging from +1 to +4. Folding of the arrays was observed when the concentration of cations was increased by the use of Na+, K+, Mg2+, Ca2+, spermidine3+ (Spd3+), Co(NH3)63+ (CoHex3+), and spermine4+ (Spm4+). We found typical polyelectrolyte behavior, with the critical concentration of cation needed to bring about maximal folding covering a range of almost five orders of magnitude (from 2 μM for Spm4+ to 100 mM for Na+).
The experimental study was accompanied by Langevin molecular-dynamics (MD) computer simulations of a dielectric continuum model of the nucleosomal array under a variety of conditions relevant to the experiments. The NCPs comprising the array were modeled similarly to our most recent NCP model, which adequately describes aggregation induced by Mg2+ (32,33). Each NCP consists of a central sphere (representing the histone octamer) with DNA in the form of connected charged beads wrapped around it. The net charge of the NCP is −236e. Protruding out from the central core are eight positively charged flexible histone tails. Additional charged DNA beads modeling the linker DNA connect the NCPs to form an array (see Fig. S1 in the Supporting Material). In our model, charge correlation effects are taken into account. We include the explicit presence of monovalent (like K+ or Na+), divalent (Mg2+, Ca2+), sphere-like trivalent (Co(NH3)63+), and tri- and tetracationic polyamine-like particles (modeling Spd3+ and Spm4+). Good agreement between calculated sedimentation velocity coefficients and the experimental results was obtained. An important conclusion is that the theoretical description of the array folding caused by multivalent cations must use a model that includes ion correlation. This can be achieved by incorporating explicit mobile ions; however, simplification of the ionic environment by using a DH treatment is inadequate and may lead to a misunderstanding of the nature of the electrostatic mechanism that drives this important structural transition.
The structural features of the nucleosome core in the coarse-grained model presented here are approximately described and may not accurately reproduce the secondary structure of the folded chromatin. However, our model is not intended to investigate the detailed structure of the 30 mm fiber (for which more specific details of the NCP are important), but rather the conditions for compaction, which is driven by electrostatics. Short-range forces (compared to the electrostatics) involved mainly in the formation of nucleosome-nucleosome stacking (such as hydrogen bonding, water release, formation of ion pairs, etc.) will be important for determining the folded structure. The description should be sufficient to describe the physical origin of the electrostatically driven multivalent ion-induced folding of chromatin. Furthermore, we deliberately left out linker histones in both the experiments and simulations to focus on the basic electrostatic features of the folding of the array.
Materials and Methods
Experimental studies
Preparation of DNA and histones
The DNA template inserted into the pWM530 plasmid, which contains 12 tandem 177 bp repeats of the 601 DNA nucleosome positioning sequence (18) (abbreviated as 12-177-601), was a gift from Prof. Timothy Richmond and was prepared as described previously (7). It was transformed to the Escherichia coli HB101 strain and amplified in the presence of ampicillin. The plasmid was extracted by the alkaline lysis method. RNA and protein impurities were separated from the DNA by gel filtration on a Sepharose 6 column in TES2000 buffer (10 mM Tris-HCl pH 7.5, 1 mM EDTA, and 2000 mM NaCl) (39). After excision with EcoRV, the 12-177-601 DNA was separated by polyethylene glycol (PEG 6000) precipitation (39), followed by purification on a Sephacryl SF 1000 column in TES100 buffer (20 mM Tris-HCl pH 7.5, 1 mM EDTA, and 100 mM NaCl) (39).
Full-length Xenopus laevis histones H2A, H2B, H3, and H4 were individually expressed in E. coli (BL21 (DE3) pLys S). Each histone was purified by gel filtration on Sephacryl S-200 column (ÄKTA FPLC, Uppsala, Sweden) (40). Additional purification was carried out on a Resource S cation exchange column (ÄKTA FPLC).
The histone octamer was refolded using a 1:1:1.2:1.2 molar ratio for H2A, H2B, H3, and H4, respectively. The octamer was purified using a Sephacryl S-200 gel filtration column (40).
Preparation of nucleosome arrays
The nucleosome array was reconstituted using the histone octamer and 12-177-601 DNA as described previously (7,39). To prevent oversaturation of DNA by the histone octamer, competitor DNA (∼150 bp) was added to the reconstitution mixture at 0.5 molecule of competitor to 1 molecule of 12-177-601 DNA. Because of variation in the quality of the stock histone and DNA preparation, saturation of the 12-177-601 array was adjusted separately for each preparation by testing various octamer/DNA ratios in small-scale reconstitutions. An example of the octamer/DNA adjustment is shown in Fig. 1 B. The stoichiometry of 12:1 for histone octamer to 12-mer DNA in the reconstituted nucleosomal array was controlled by digestion of the array with ScaI in a buffer containing 100 mM NaCl, 50 mM Tris·HCl pH 7.5, 2 mM MgCl2, 1 mM DTT for 18 h at 37°C, followed by native polyacrylamide gel electrophoresis (PAGE; Fig. 1 B). Incomplete saturation of the array (<12 histone octamers per one 12-177-601 DNA molecule) resulted in the appearance of 177 bp free DNA upon ScaI digestion.
Figure 1.
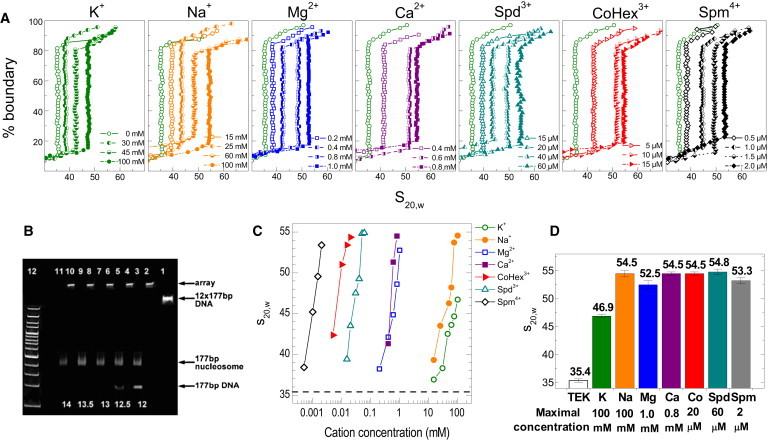
(A) van Holde-Weischet sedimentation velocity curves obtained for the 12-177-601 array with K+, Na+, Mg2+, Ca2+, Spd3+, CoHex3+, and Spm4+ (the concentration of the cation is indicated in the graphs; the curve obtained in TEK buffer is shown for comparison). There is a background presence of ions from the TEK buffer in all solutions studied (10 mM K+ and ∼8.0 mM Tris+ cations). (B) Validation by native 5% PAGE of the histone/DNA stoichiometry in the reconstituted 12-177-601 array with various amounts of histone octamer added to the DNA (octamer/DNA ratios of 12, 12.5, 13, and 13.5 were tested as indicated at the bottom of the figure). Lanes 2, 4, 6, 8, 10 and 3, 5, 7, 9, 11 are for the arrays correspondingly before and after ScaI digestion. Lane 1 is 12-177-601 DNA before reconstitution; lane 12 is the DNA marker (from 100 bp to 1500 bp, step 100 bp). A histone/DNA ratio of 13.0:1.0 was chosen as optimal. (C) Dependence of s20,w-values on the concentration of added cation. Horizontal line indicates the s20,w-value in the reference TEK buffer. (D). Maximal s20,w-values obtained for the cations studied (numbers are shown at the top of the each bar). Cation concentration corresponding the maximal value of s20,w is listed at the bottom of the graph.
Analytical ultracentrifugation
Sedimentation velocity experiments were carried out on a Beckman XL-I analytical ultracentrifuge (Beckman Coulter, Fullerton, CA) equipped with an eight-channel rotor and monochrome scanner. Samples with absorbance at 259 nm A259 = 0.8 cm−1 (DNA concentration CP = 121 μM; array concentration 79.6 μg/mL) were prepared in TEK buffer (10 mM Tris-HCl pH 7.5, 0.1 mM EDTA, 10 mM KCl). The sample and reference (TEK buffer + salt at the same concentration as in the sample with the array) solutions were loaded into the 12 mm double-sector cells and equilibrated under vacuum for 30 min at 3000 rpm at 20°C. Forty scans were collected at 12,000 rpm with a 10 min interval between each scan. The scan boundaries data were analyzed with the use of the van Holde-Weischet method and the Ultrascan program (41). The sedimentation coefficient was adjusted to s20,w using a partial specific volume of 0.622 mL/g for the saturated nucleosome array (7,39). Processed data were plotted as the boundary percentage (y axis) versus s20,w (x axis) to obtain the distribution of the sedimentation coefficient (Fig. 1 A). The average of s20,w from 20% to 80% of the boundary is reported as the S-value.
Computer simulations
Model of the NCP and nucleosome array
The construction of the nucleosome array (abbreviated as the 12-177 array), the forces, and the simulation details are described in the Supporting Material. The NCP was modeled as described previously (33) (http://www.biophysj.org/biophysj/supplemental/S0006-3495(09)00318-X; see also Fig. S1). Each NCP of the array is composed of a central neutral spherical particle of effective radius 3.5 nm (to model the core of the histone octamer). The DNA wrapped around the core as 1.75 turns of superhelix is made of 25 beads of effective radius 1.0 nm separated by 2 nm (each bead models 6 bp of dsDNA, 6×0.336 nm). The original −12e charge of each DNA bead was reduced to −9.44e assuming that the DNA charge contacting the histone core is neutralized by the charge of the histone core. As is thoroughly discussed in Fig. S2, the rationale for this approximation is that most of the positive charges of the histone core are located in close proximity to the DNA phosphate groups. Simulations using other approximations to the net charge of the core were also made and showed properties similar to those of the neutral core model of the array (see Supporting Material). Harmonic bonds between particles maintained the stability of the NCP structure. The histone tails were modeled as eight strings of connected +1e charges of effective radius 0.3 nm and bond length 0.7 nm (32,33). The number of charged particles in each tail was 9, 14, 11, and 10 to match the charge of the H2A, H2B, H3, and H4 tails, respectively (for details see Supporting Material).
A string of five beads of 1.0 nm radius, each carrying a −12e charge, representing 30 bp linker DNA fragment connected 12 NCPs. The total charge of all DNA particles (DNA attached to the histone core plus linker DNA) was −3492e, which combined with the +1056e charge of the histone tails gave a net total charge of the array equal to −2436e.
To represent steric effects, we employed a short-range variant of a Lennard-Jones potential for every type of particle pair. To take into account the rigidity of the DNA, a bending potential for each three consecutive DNA beads was applied (for details see Supporting Material). Linker DNA torsion is not included in this model, which does not address the details of the folded 30 nm fiber structure.
The sizes of mobile ions were set using data from earlier Monte Carlo simulations (42,43): Mg2+, 0.25 nm; K+ and Cl−, 0.2 nm; and CoHex3+, 0.35 nm. The charged amino groups in Spd3+ and Spm4+ had radii of 0.25 nm and were connected by harmonic bonds with an equilibrium distance of 0.47 nm.
Details of the Langevin MD simulations, which were carried out with the ESPResSo package (44), and the analyses are given in the Supporting Material. The concentration of the array in the 120 nm simulation box was 0.961 μM (4.024 mM of DNA phosphate groups). In most of the simulations, in addition to the cations neutralizing the charge of the array (−2436e), added salt (Mn+·nCl−) was present with 800 Cl− ions (Cl− concentration 0.77 mM). The influence of Mg2+, CoHex3+, Spd3+, and Spm4+ on the properties of the 12-177 nucleosomal array was investigated. A number of simulations were performed for the tailless array. The simulated systems and the major results are listed in Table S5.
We also carried out a series of simulations within the DH approximation, as described in the Supporting Material.
Results and Discussion
AUC characterization of oligocation-dependent array folding
Data from the AUC studies of the 12-177-601 array folding are summarized in Fig. 1. The van Holde-Weischet graphs in Fig. 1 A show highly homogeneous sedimentation coefficients within 80–90% of the boundary that are characterized by a well-defined s20,w value. This demonstrates the high purity and homogeneity of the arrays, which is also confirmed by the PAGE results shown in Fig. 1 B. Fig. 1 C illustrates the concentration dependence of s20,w upon titration with the oligocations, and Fig. 1 D compares the maximal s20,w values obtained from the last point of each titration curve in Fig. 1 C, before the onset of aggregation. For the relevant ionic conditions, our values of s20,w in the presence of Mg ions are in precise agreement with the results obtained in the Richmond laboratory (7,39). The s20,w value of the nucleosomal array in TEK buffer (10 mM KCl, 10 mM Tris-HCl pH 7.5, 0.1 mM EDTA) is 34-35S (shown in Fig. 1 C as a reference line), which is characteristic of the extended-array, beads-on-a-string structure adopted by chromatin at a low concentration of monovalent salt (3,7,39).
With monovalent counterions, maximum compaction was achieved at 100 mM NaCl and KCl with s20,w = 54.5S and 46.7S, respectively (Fig. 1, C and D). A value of s20,w ≈ 53-55S corresponds to a dense compaction of the 12-177-601 array with gyration radius, Rg ≈ 12–15 nm, as previously confirmed by electron microscopy visualization (39). Remarkably, K+ and Na+ showed a considerable difference in the s20,w-values. Moreover, among all ions studied, only the K+ displays an s20,w-value that does not reach 53-55S. This indicates that maximal folding is not reached before interarray aggregation sets in. This novel (to our knowledge) observation is in line with the reported higher efficiency in the presence of Na+ (relative to K+) in DNA condensation by addition of Spd3+ (45) or crowding agents (46).
For Mg2+ and Ca2+, maximal compaction was observed at 1.0 and 0.8 mM (s20,w = 53.7S and 54.5S, respectively; Fig. 1, C and D). Ca2+ shows slightly higher efficiency in folding of the array, but this difference with Mg2+ is rather small compared to the difference in the s20,w-values of the Na+-K+ pair. We suggest that the explanation for this behavior is that the presence of potassium ions affects the structural properties of the chromatin array, with a disruptive effect on the folding, perhaps similar to the effect of H4 lysine K16 acetylation on array folding (13,17).
Maximal folding of the array by CoHex3+ and Spd3+ was recorded at 20 μM and 60 μM, respectively (Fig. 1, C and D), with the compact state (s20,w ∼50S) being reached at ∼10 μM CoHex3+ and 40 μM Spd3+ (Fig. 1, A and C). The observed higher efficiency of CoHex3+ in inducing compaction compared to Spd3+ is in agreement with the established effects of these cations on DNA condensation (21). As expected, the cation with the highest positive charge, Spm4+, showed the highest efficiency in folding of the array. A submicromolar concentration of Spm4+ increased the value of the sedimentation coefficient, with maximal s20,w achieved at CSpm = 2 μM.
A remarkably wide range in the observed concentrations required to induce maximal folding was observed—from 100 mM for Na+ to 2 μM for Spm4+, which is close to five orders of magnitude! This behavior strongly suggests a polyelectrolyte nature of the process.
Computer simulations of cation-induced folding of the nucleosome array
In similarity to our experimental findings, the presence of multivalent cations leads to folding of the 12-177 array, as illustrated by the snapshots in Fig. 2 A. A beads-on-a-string structure is observed at low monovalent ion concentration, whereas folded structures are seen in solutions of divalent ions, and highly dense particles are formed in the presence of tri- and tetravalent cations (Fig. 2 A). The MD trajectories indicate that array folding characteristics, such as the sedimentation coefficient, s20,w (Fig. 2 B), or the radius of gyration, Rg (Fig. 2 C), fluctuate around equilibrium values after 2 × 10⁷ MD steps (see also Fig. S5).
Figure 2.
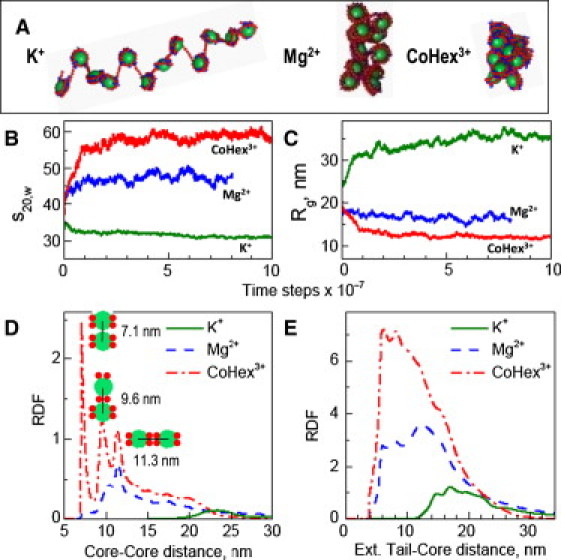
Comparison of the results of MD simulations of the 12-177 array in the presence of K+, Mg2+, and CoHex3+. (A) Representative snapshots illustrate the typical degree of folding of the array. Variation of (B) sedimentation coefficient (s20,w) and (C) radius of gyration (Rg) during the course of the MD simulations. (D) Core-core and (E) external tail-core RDFs. (In the core-core RDF (D) neighboring NCPs were excluded from statistics.) The three peaks clearly visible in the core-core RDF of the CoHex3+-array system are related to three possible types of NCP-NCP contacts and illustrated by sketches.
Analyses of the radial distribution functions (RDFs), such as core-core (Fig. 2 D) and external tail-core RDFs (Fig. 2 E), as well as internal tail-core and mobile ion-core and mobile ion-DNA (Fig. S6 and Fig. S7), provided additional information on the differences between the compaction under the different ionic environments and on the mechanism of folding. The system with trivalent CoHex3+ ions displays the largest intensity and more structure in the peaks of the core-core RDF (Fig. 2 D), reflecting the highly folded state obtained even at very low ionic strength. Similarly, for this system, the large frequency of contacts between tails and neighboring nucleosomes (Fig. 2 E) highlights the importance of the tail bridging for the array folding. The RDFs in combination with snapshot observations also reveal structural details of the NCP-NCP contacts, as shown by the core-core RDF (Fig. 2 D).
Given the approximate description of the NCP structure in the coarse-grained model presented in this work, conclusions should be drawn with caution regarding the relevance of these observations to the internal structure of the real folded nucleosomal arrays. It must also be stressed that for such short arrays as those studied experimentally and in modeling here, the end effects will be considerable and the structural features (e.g., fiber length, diameter, curvature, and nucleosome density) used to characterize chromatin fibers may not be relevant, and their experimental values for the 12-177-601 arrays in the absence of linker histones are unknown. However, given the interest in the detailed 30 nm fiber structure and the debate over different structural models, we still analyzed the structural characteristics of compact arrays, focusing on systems in the presence of Mg2+ (Fig. S10). A detailed inspection of many snapshots, and analysis of the core-core distance distributions (shown in Fig. S10) clearly indicate that the arrays for the compact states of the two highest magnesium concentrations display fiber-like morphologies with features corresponding to an irregular zigzag type of arrangement. The mean fiber diameter is ∼24–25 nm and the average nucleosome density is ∼4.1 (per 11 nm) for the most compact fibers in the presence of magnesium (Table S7). The fiber width and density obtained for a perfect two-start model predicted from the tetranucleosome structure (47) are ∼25 nm and 5.8 nucleosome/11 nm, respectively. The discrepancy in density is likely due to end effects for the short array presented here, and is strongly influenced by the lack of close stacking imposed by our spherical core model as well as by the fluctuations in structure during the simulation. Similar nucleosome densities were obtained in a recent coarse-grained Monte Carlo simulation of long nucleosome arrays for parameters adjusted to a two-start model (29).
Array compaction by Mg2+
The AUC experiments conducted in the presence of Mg2+ were performed at a low array DNA phosphate concentration of 0.12 mM, and the sedimentation velocity coefficient, s20,w at maximum folding, was obtained with 1.0 mM added MgCl2. The charge ratio of added cation to array DNA phosphate concentration is CRexp = 2CMg/CP ≈ 17. Hence, an excess of cation charge relative to the array charge is necessary to induce the full folding. Simulations under the same conditions were not feasible due to computer limitations (i.e., the box size and number of particles). Therefore, we instead performed a titration experiment for a series of simulations in which K+ ions were gradually substituted by Mg2+, followed by addition of MgCl2 (Fig. 3, A–D). Because the mean (volume-averaged) concentrations of the cations in the AUC experiment and the MD simulation cannot be directly compared, we estimated the bulk concentration of Mg2+ (and other cations) in the simulated system by calculating the mean concentration of cations in representative volumes with low electric field (for details see the Supporting Material). The numerical values of the average and bulk cation concentrations are given below the snapshots in Fig. 3 A, which present the calculated properties of the array as a function of bulk concentration, whereas the same parameters are plotted versus average concentration in Fig. S8 and Fig. S9 (numerical values are listed in Table S5). An increase in bulk CMg from micromolar and submillimolar values to ∼3–10 mM leads to a gradual folding of the array, as indicated by a decrease in Rg from 34.3 to 14.3 nm and an increase in s20,w from 31.2 to 52.5S (Fig. 3, B and C). At the highest Mg2+ concentration, CRsim = 2CMg/CP = 7.9, which is closer to CRexp = 17 of the AUC experiment. The tailless array shows rather similar folding to the system with tails in the initial part of the titration, but it is clear that the tailless system has a reduced folding propensity at higher Mg2+, in agreement with published AUC results (7). Although the values of Rg and s20,w as a function of bulk CMg (Fig. 3, B and C) display a gradual change, the maximum in the external tail-core RDF displays a stepwise behavior (Fig. 3 D), a feature that is even more pronounced in the case of the trivalent ions (see below). At the initial stages of the Mg2+ titration, folding of the array is caused by increased shielding by Mg2+ of the negative charge on the NCPs and linker DNA. When the NCP-NCP distances become sufficiently close, the tail bridging is operative.
Figure 3.
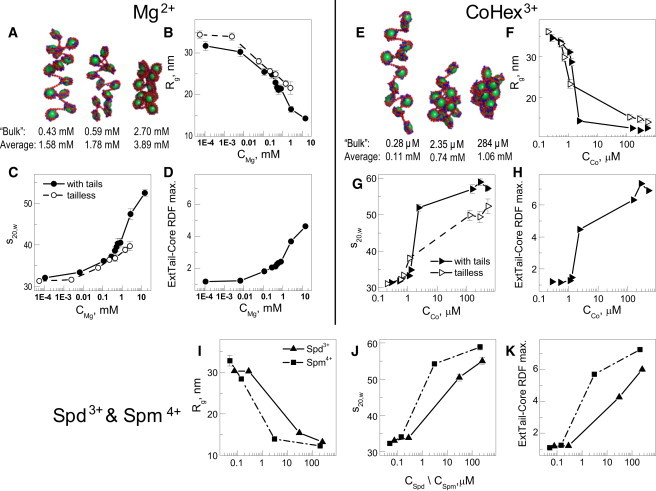
Summary of MD simulation results for the 12-177 array titration by Mg2+ (A–D), CoHex3+ (E–H), and Spd3+ and Spm4+ (I and K). (A and E) Representative snapshots illustrating folding of the array at different stages of titration by (A) Mg2+ and (E) CoHex3+; numbers under the snapshots indicate the concentration of the bulk (first line) and average (second line) Mg2+ or CoHex3+ concentration. (B, F, and I) Radius of gyration, Rg; (C, G, and J) sedimentation coefficient, s20,w; (D, H, and K) intensity of the maximum in the external tail-core RDF. In graphs B–D and F–H, data for the array with charged tails are drawn as solid circles and lines; similar results for the tailless array are shown as hollow points with dashed lines. In graphs B–D and F–K, the x axis is the bulk concentration of Mg2+ (B–D, CMg), CoHex3+ (F–H, CCo), and Spd3+ or Spm4+ (I and K, CSpd/CSpm). Numerical values (s20,w, Rg) and their dependencies on the average concentration of the oligocation are given in Table S5, Fig. S8, and Fig. S9.
In the AUC experiment, maximal folding is achieved at CMg = 1 mM, whereas in the MD simulations the s20,w-value exceeds 50S at bulk Mg2+ at ∼5 mM (Fig. 3 C). This is due to the above-mentioned inequality of the ionic conditions in the experiments and simulations. Of course, deficiencies of the coarse-grained modeling play a part, and one might expect that for such a weak condensing agent as Mg2+, imperfections of the model would be exposed the most. We observed almost quantitative agreement between experimental and simulation data for the cations of higher valency (see below).
Folding of the array by CoHex3+
Fig. 3, E–H, presents the results of MD simulations of the 12-177 array obtained in the presence of CoHex3+. In agreement with experiments, the trivalent cation shows much greater efficiency than Mg2+ in compaction of the array. Folding of the arrays occurs when the bulk concentration of CoHex3+ is in the micromolar range: at bulk concentration CCo = 2.35 μM (average CCo = 0.74 mM) compaction of the array is characterized by small Rg (12–13 nm; Fig. 3 F) and high s20,w values (close to 52S; Fig. 3 G; see also Fig. S8, D–F, and Table S5, D and E). Maximal folding is obtained at CCobulk = 0.28 mM (1 mM mean concentration) with s20,w = 59S, which is larger than the maximal s20,w-value observed in AUC experiments. This is probably because a single array is simulated and additional folding can occur beyond conditions that would lead to aggregation in experiments.
The results obtained for the tailless array show that the tails significantly contribute to the folding, shifting the transition to lower concentration of CoHex3+. The contributions from the histone tail bridging are seen in the intensity of the external core-tail RDF (Fig. 3 H), which exhibits a steep increase that is correlated with the folding of the array, as also seen in the change of Rg and s20,w (Fig. 3, F and G). However, the maximal folding without tails can reach s20,w-values up to 50S. This shows that ion-ion correlations, absent in DH models, contribute significantly to the compaction of chromatin.
Compaction of the array by Spd3+ and Spm4+
We performed a number of MD simulations modeling the presence of the natural polyamines Spd3+ and Spm4+. The polyamines were modeled as a chain of three and four charged beads. The result of the analysis is displayed in Fig. 3, I–K, as a function of the bulk concentrations (see also Fig. S9, which shows the same parameters as a function of the mean concentration). In agreement with experiment, Spd3+ is less effective than Spm4+ in folding the array and is also a weaker compaction agent than CoHex3+. Significant array folding is reached at bulk CSpd of tens of micromolar. The same level of chromatin folding is observed for CCo around 10 μM and for CSpm in the range of 1–10 μM bulk concentrations. Maximal folding with sedimentation coefficients of 58.8S for Spm4+ and 55S for Spd3+ is in good agreement with experiments.
Nucleosome array modeling in the DH approximation
In the DH approximation, the effect of ions of all types is expressed by a single parameter, the ionic strength, which determines the screening parameter in all electrostatic interactions. Fig. 4 shows the dependence of s20,w and Rg for the normal and tailless arrays as a function of ionic strength, using the DH screening potential, but otherwise identical to that described above. In addition, the results for a 50% reduced charge model, which is sometimes used in DH modeling to represent ion condensation and charge renormalization (26,31), are presented. The result for an uncharged model is shown for reference as a dashed line (for a description of the DH-MD simulation results, see Fig. S11 and Table S6).
Figure 4.
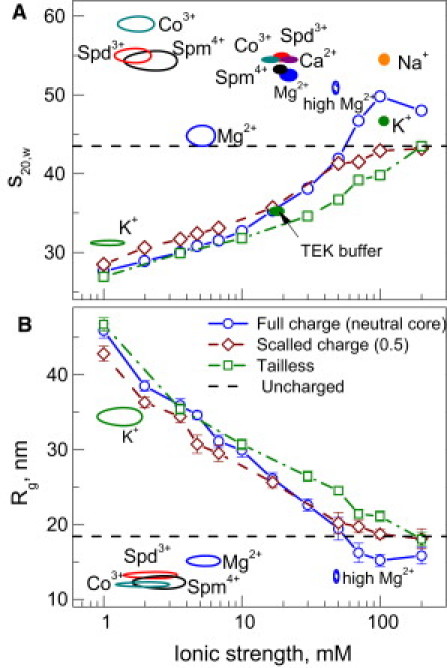
Simulations within the DH approximation as a function of ionic strength for different models of the array. (A) Sedimentation coefficient, s20,w; (B) radius of gyration, Rg. Horizontal dashed lines indicate the values of s20,w and Rg calculated for uncharged array model. Hollow ovals in A and B respectively show s20,w and Rg values obtained in the MD simulations with explicit ions; cations are indicated near the points. Solid ovals in A show the maximal s20,w-values observed in the AUC measurements for different cations (indicated in the graph). Indices Mg2+ and high Mg2+ mark the MD simulation data calculated for CMg = 3.89 and 15.83 mM, respectively (see text for details).
For the normal array, the folding becomes similar to the uncharged model at 50–80 mM ionic strength. In the range of 100–200 mM it adopts a more compact form, with Rg-values less than that in the uncharged model and s20,w approaching a value of 50S, which is characteristic of a compact (folded) structure. This compaction is caused by the histone tails, which are present explicitly and are able to promote attraction through a correlation in their positions and by bridging. The results are in qualitative agreement with data previously obtained with the use of a DH model (25,26). The tailless array does not show full folding, and in fact never reaches compaction beyond that of the uncharged model.
The DH approximation fails when multivalent ions are present in the system. The experiments demonstrate compaction at divalent ion concentrations of ∼1 mM, which corresponds to an ionic strength < 20 mM (including KCl and buffer). In all of the DH calculations, the array is stretched for such values of the ionic strength. Three- and four-valent counterions cause array folding at submillimolar concentrations. In Fig. 4, we also indicate the values of s20,w and Rg obtained from the simulations at the representative ionic strengths. The experimental s20,w-values are also included in Fig. 4 A. It should be noted that in experiments with oligocations, the ionic strength almost exclusively originates from the salt buffer, so this parameter cannot describe any functional dependencies for experimental and theoretical data on the systems containing mixtures of mono- and multivalent ions.
Comparison with other chromatin models
A variety of structurally detailed chromatin models have been presented in the literature (24–32). These models are primarily used to predict and understand the structure of the elusive 30 nm chromatin fiber, and consider a realistic shape of the NCP. However, the tails are omitted and the nucleosome-nucleosome interactions are usually modeled with implicit effective attractive potentials to mimic a given salt condition under which the folded structure is formed. The issue of the salt-dependent process of folding is usually not considered in these models, and therefore a simplified treatment of the electrostatics may be warranted. Schlick and co-workers, on the other hand, studied salt-dependent nucleosomal array folding with computer simulations by using a discrete surface charge optimization (DiSCO) model of the NCP (26,27,30,31) and, more recently, by including flexible histone tails (26,27,30,31). This treatment combines a detailed shape of the NCP with a more approximate modeling of the histone tails, linker DNA, and linker histone H1. The effects of added salt were described by a DH treatment, without taking ion-ion correlations into account. The monovalent salt dependence of the array folding was well described by these simulations. A kind of charge renormalization process was used separately for each particle to adjust the nominal charges of the nucleosome core, histone tail, linker DNA, and linker histone at a given salt condition to match the PB electrostatic potential for each particle. This results in salt concentration-dependent charges of these nucleosome core, histone tail, linker DNA, and linker histone particles that are subject to DH screening at each salt concentration (26,31). It is well known (48–50) that the PB approach breaks down for strongly coupled systems with multivalent ions, particularly when electrostatic interactions between highly charged polyelectrolytes such as DNA and colloids are considered. These investigators recently modeled the presence of divalent ions within the DiSCO model by using a phenomenological treatment, introducing a modification of the Debye screening length for linker DNA interactions, as well as a modification of the DNA persistence length (26,31). In our view, the physical picture of the electrostatic origin of chromatin array folding that emerged from this approach remains unclear.
Conclusions
It is clear that a physically grounded theory regarding cation-induced chromatin folding should take into account the correlation as well as entropy and competition effects of mobile ions that are included when the ions are explicitly present in computer simulations. We use such an approach, which treats electrostatics in a consistent manner and also incorporates the differences in cation nature and valence. Within the approximations of the model used, this treatment contains all the following electrostatic contributions: cation-anion Coulombic interactions, screening and DNA charge neutralization, cation multivalency and structure, mobile ion correlations, tail-tail correlations, and tail bridging effects (see Table S4 for a comparison of these contributions within different modeling approaches). These important mechanisms are either absent or incompletely represented in DH models. Generally, chromatin array folding requires a sufficient neutralization of the negative charge of the nucleosome and linker DNA by screening and oligocation binding, as well as attractive contributions due to tail-related interactions and multivalent ion-ion correlations. Even in the absence of the tails, folding of chromatin is observed both experimentally (7) and in explicit ion simulations, caused by ion correlation effects. This demonstrates the necessity of including this mechanism in chromatin modeling.
One can perform a qualitative comparison of the experimental results and MD simulation results by comparing the threshold bulk concentrations of the cations in which sedimentation coefficient values corresponding to a compact state (s20,w ∼ 50S) are reached. In the simulations, these approximate concentrations are ∼5 mM (Mg2+), ∼30 μM (Spd3+), ∼3 μM (Co3+), and ∼2 μM (Spm4+). The corresponding experimental values are 1 mM, 40 μM, 10 μM, and 1.5 μM. Given the approximations in the model and the simulations, this must be considered as an excellent agreement. Therefore, our model predicts qualitatively, and largely also quantitatively, the experimental behavior of oligocation-dependent folding of arrays induced by an increase of multivalent salt.
The model presented here includes several approximations, one of the most important of which is the approximate description of the shape and charge distribution of the core particle of the nucleosome array, which limits the stacking between the surfaces of the real wedge-shaped cylinder-like NCPs. Another serious approximation is the lack of hydration effects, i.e., the continuum description of the aqueous solvent with a uniform dielectric constant. Other simplifications of the real system include the absence of hydrogen bonding and hydrophobic effects. A more refined coarse-graining of the system will rectify some of these deficiencies, and such work is presently under way.
Acknowledgments
We thank Dr. Curt Davey and Prof. Timothy Richmond for gifts of the plasmids encoding the 12-177-601 DNA and the core histones; Dr. Curt Davey and members of his laboratory for valuable assistance in producing and purifying the DNA, histones, and nucleosome arrays; and the Nanyang Technological University High Performance Computer Centre for the generous allocation of supercomputer time.
This work was financially supported by the Singapore Ministry of Education ARC-Tier 2 grant (L.N.) and by the Swedish Research Council (Vetenskaprådet) (A.P.L.).
Supporting Material
References
- 1.Luger K., Mäder A.W., Richmond T.J. Crystal structure of the nucleosome core particle at 2.8 A resolution. Nature. 1997;389:251–260. doi: 10.1038/38444. [DOI] [PubMed] [Google Scholar]
- 2.van Holde K., Zlatanova J. What determines the folding of the chromatin fiber? Proc. Natl. Acad. Sci. USA. 1996;93:10548–10555. doi: 10.1073/pnas.93.20.10548. [DOI] [PMC free article] [PubMed] [Google Scholar]
- 3.Hansen J.C. Conformational dynamics of the chromatin fiber in solution: determinants, mechanisms, and functions. Annu. Rev. Biophys. Biomol. Struct. 2002;31:361–392. doi: 10.1146/annurev.biophys.31.101101.140858. [DOI] [PubMed] [Google Scholar]
- 4.Horn P.J., Peterson C.L. Molecular biology. Chromatin higher order folding—wrapping up transcription. Science. 2002;297:1824–1827. doi: 10.1126/science.1074200. [DOI] [PubMed] [Google Scholar]
- 5.Wolffe A.P. Academic Press; San Diego, CA: 1998. Chromatin: Structure and Function. [Google Scholar]
- 6.Bertin A., Renouard M., Durand D. H3 and H4 histone tails play a central role in the interactions of recombinant NCPs. Biophys. J. 2007;92:2633–2645. doi: 10.1529/biophysj.106.093815. [DOI] [PMC free article] [PubMed] [Google Scholar]
- 7.Dorigo B., Schalch T., Richmond T.J. Chromatin fiber folding: requirement for the histone H4 N-terminal tail. J. Mol. Biol. 2003;327:85–96. doi: 10.1016/s0022-2836(03)00025-1. [DOI] [PubMed] [Google Scholar]
- 8.Zheng C., Hayes J.J. Structures and interactions of the core histone tail domains. Biopolymers. 2003;68:539–546. doi: 10.1002/bip.10303. [DOI] [PubMed] [Google Scholar]
- 9.Zheng C., Hayes J.J. Intra- and inter-nucleosomal protein-DNA interactions of the core histone tail domains in a model system. J. Biol. Chem. 2003;278:24217–24224. doi: 10.1074/jbc.M302817200. [DOI] [PubMed] [Google Scholar]
- 10.Zheng C., Lu X., Hayes J.J. Salt-dependent intra- and internucleosomal interactions of the H3 tail domain in a model oligonucleosomal array. J. Biol. Chem. 2005;280:33552–33557. doi: 10.1074/jbc.M507241200. [DOI] [PubMed] [Google Scholar]
- 11.Gordon F., Luger K., Hansen J.C. The core histone N-terminal tail domains function independently and additively during salt-dependent oligomerization of nucleosomal arrays. J. Biol. Chem. 2005;280:33701–33706. doi: 10.1074/jbc.M507048200. [DOI] [PubMed] [Google Scholar]
- 12.Kan P.-Y., Lu X., Hayes J.J. The H3 tail domain participates in multiple interactions during folding and self-association of nucleosome arrays. Mol. Cell. Biol. 2007;27:2084–2091. doi: 10.1128/MCB.02181-06. [DOI] [PMC free article] [PubMed] [Google Scholar]
- 13.Robinson P.J.J., An W., Rhodes D. 30 nm chromatin fibre decompaction requires both H4-K16 acetylation and linker histone eviction. J. Mol. Biol. 2008;381:816–825. doi: 10.1016/j.jmb.2008.04.050. [DOI] [PMC free article] [PubMed] [Google Scholar]
- 14.Wang X., Hayes J.J. Acetylation mimics within individual core histone tail domains indicate distinct roles in regulating the stability of higher-order chromatin structure. Mol. Cell. Biol. 2008;28:227–236. doi: 10.1128/MCB.01245-07. [DOI] [PMC free article] [PubMed] [Google Scholar]
- 15.Kan P.-Y., Caterino T.L., Hayes J.J. The H4 tail domain participates in intra- and internucleosome interactions with protein and DNA during folding and oligomerization of nucleosome arrays. Mol. Cell. Biol. 2009;29:538–546. doi: 10.1128/MCB.01343-08. [DOI] [PMC free article] [PubMed] [Google Scholar]
- 16.Huynh V.A.T., Robinson P.J.J., Rhodes D. A method for the in vitro reconstitution of a defined “30 nm” chromatin fibre containing stoichiometric amounts of the linker histone. J. Mol. Biol. 2005;345:957–968. doi: 10.1016/j.jmb.2004.10.075. [DOI] [PubMed] [Google Scholar]
- 17.Shogren-Knaak M.A., Ishii H., Peterson C.L. Histone H4-K16 acetylation controls chromatin structure and protein interactions. Science. 2006;311:844–847. doi: 10.1126/science.1124000. [DOI] [PubMed] [Google Scholar]
- 18.Lowary P.T., Widom J. New DNA sequence rules for high affinity binding to histone octamer and sequence-directed nucleosome positioning. J. Mol. Biol. 1998;276:19–42. doi: 10.1006/jmbi.1997.1494. [DOI] [PubMed] [Google Scholar]
- 19.Bloomfield V.A. DNA condensation by multivalent cations. Biopolymers. 1997;44:269–282. doi: 10.1002/(SICI)1097-0282(1997)44:3<269::AID-BIP6>3.0.CO;2-T. [DOI] [PubMed] [Google Scholar]
- 20.Iwaki T., Saito T., Yoshikawa K. How are small ions involved in the compaction of DNA molecules? Colloids Surf. B Biointerfaces. 2007;56:126–133. doi: 10.1016/j.colsurfb.2006.10.040. [DOI] [PubMed] [Google Scholar]
- 21.Korolev N., Berezhnoy N.V., Nordenskiöld L. A universal description for the experimental behavior of salt-(in)dependent oligocation-induced DNA condensation. Nucleic Acids Res. 2009;37:7137–7150. doi: 10.1093/nar/gkp683. [DOI] [PMC free article] [PubMed] [Google Scholar]
- 22.Widom J. Physicochemical studies of the folding of the 100 A nucleosome filament into the 300 A filament. Cation dependence. J. Mol. Biol. 1986;190:411–424. doi: 10.1016/0022-2836(86)90012-4. [DOI] [PubMed] [Google Scholar]
- 23.Pollard K.J., Samuels M.L., Peterson C.L. Functional interaction between GCN5 and polyamines: a new role for core histone acetylation. EMBO J. 1999;18:5622–5633. doi: 10.1093/emboj/18.20.5622. [DOI] [PMC free article] [PubMed] [Google Scholar]
- 24.Wedemann G., Langowski J. Computer simulation of the 30-nanometer chromatin fiber. Biophys. J. 2002;82:2847–2859. doi: 10.1016/S0006-3495(02)75627-0. [DOI] [PMC free article] [PubMed] [Google Scholar]
- 25.Sun J., Zhang Q., Schlick T. Electrostatic mechanism of nucleosomal array folding revealed by computer simulation. Proc. Natl. Acad. Sci. USA. 2005;102:8180–8185. doi: 10.1073/pnas.0408867102. [DOI] [PMC free article] [PubMed] [Google Scholar]
- 26.Arya G., Zhang Q., Schlick T. Flexible histone tails in a new mesoscopic oligonucleosome model. Biophys. J. 2006;91:133–150. doi: 10.1529/biophysj.106.083006. [DOI] [PMC free article] [PubMed] [Google Scholar]
- 27.Arya G., Schlick T. Role of histone tails in chromatin folding revealed by a mesoscopic oligonucleosome model. Proc. Natl. Acad. Sci. USA. 2006;103:16236–16241. doi: 10.1073/pnas.0604817103. [DOI] [PMC free article] [PubMed] [Google Scholar]
- 28.Langowski J., Heermann D.W. Computational modeling of the chromatin fiber. Semin. Cell Dev. Biol. 2007;18:659–667. doi: 10.1016/j.semcdb.2007.08.011. [DOI] [PubMed] [Google Scholar]
- 29.Kepper N., Foethke D., Rippe K. Nucleosome geometry and internucleosomal interactions control the chromatin fiber conformation. Biophys. J. 2008;95:3692–3705. doi: 10.1529/biophysj.107.121079. [DOI] [PMC free article] [PubMed] [Google Scholar]
- 30.Grigoryev S.A., Arya G., Schlick T. Evidence for heteromorphic chromatin fibers from analysis of nucleosome interactions. Proc. Natl. Acad. Sci. USA. 2009;106:13317–13322. doi: 10.1073/pnas.0903280106. [DOI] [PMC free article] [PubMed] [Google Scholar]
- 31.Arya G., Schlick T. A tale of tails: how histone tails mediate chromatin compaction in different salt and linker histone environments. J. Phys. Chem. A. 2009;113:4045–4059. doi: 10.1021/jp810375d. [DOI] [PMC free article] [PubMed] [Google Scholar]
- 32.Korolev N., Lyubartsev A.P., Nordenskiöld L. Computer modeling demonstrates that electrostatic attraction of nucleosomal DNA is mediated by histone tails. Biophys. J. 2006;90:4305–4316. doi: 10.1529/biophysj.105.080226. [DOI] [PMC free article] [PubMed] [Google Scholar]
- 33.Yang Y., Lyubartsev A.P., Nordenskiöld L. Computer modeling reveals that modifications of the histone tail charges define salt-dependent interaction of the nucleosome core particles. Biophys. J. 2009;96:2082–2094. doi: 10.1016/j.bpj.2008.10.073. [DOI] [PMC free article] [PubMed] [Google Scholar]
- 34.Oosawa F. Interaction between parallel rodlike macroions. Biopolymers. 1968;6:1633–1647. [Google Scholar]
- 35.Podgornik R., Licer M. Polyelectrolyte bridging interactions between charged macromolecules. Curr. Opin. Colloid Interface Sci. 2006;11:273–279. [Google Scholar]
- 36.Lyubartsev A.P., Nordenskiöld L. Monte Carlo simulation study of ion distribution and osmotic pressure in hexagonally oriented DNA. J. Phys. Chem. 1995;99:10373–10382. [Google Scholar]
- 37.Khan M.O., Jönsson B. Electrostatic correlations fold DNA. Biopolymers. 1999;49:121–125. [Google Scholar]
- 38.Dai L., Mu Y., van der Maarel J.R. Molecular dynamics simulation of multivalent-ion mediated attraction between DNA molecules. Phys. Rev. Lett. 2008;100:118301. doi: 10.1103/PhysRevLett.100.118301. [DOI] [PubMed] [Google Scholar]
- 39.Schalch, T. 2004. The 30-nm chromatin fiber: in vitro reconstitution and structural analysis. PhD thesis. Swiss Federal Institute of Technology, Zurich. http://e-collection.ethbib.ethz.ch/eserv/eth:27516/eth-27516-02.pdf
- 40.Luger K., Rechsteiner T.J., Richmond T.J. Preparation of nucleosome core particle from recombinant histones. Methods Enzymol. 1999;304:3–19. doi: 10.1016/s0076-6879(99)04003-3. [DOI] [PubMed] [Google Scholar]
- 41.Demeler B. UltraScan. A comprehensive data analysis software package for analytical ultracentrifugation experiments. In: Scott D.J., Harding S.E., Rowe A.J., editors. Modern Analytical Ultracentrifugation: Techniques and Methods. Royal Society of Chemistry; Cambridge, UK: 2005. pp. 210–229. [Google Scholar]
- 42.Lyubartsev A.P., Nordenskiöld L. Monte Carlo simulation study of DNA polyelectrolyte properties in the presence of multivalent polyamine ions. J. Phys. Chem. B. 1997;101:4335–4342. [Google Scholar]
- 43.Korolev N., Lyubartsev A.P., Nordenskiöld L. Competitive substitution of hexammine cobalt(III) for Na+ and K+ ions in oriented DNA fibers. Biopolymers. 2001;58:268–278. doi: 10.1002/1097-0282(200103)58:3<268::AID-BIP1004>3.0.CO;2-8. [DOI] [PubMed] [Google Scholar]
- 44.Limbach H.J., Arnold A., Holm C. ESPResSo—an extensible simulation package for research on soft matter systems. Comput. Phys. Commun. 2006;174:704–727. [Google Scholar]
- 45.Hibino K., Yoshikawa Y., Yoshikawa K. Na+ more strongly inhibits DNA compaction by spermidine (3+) than K+ Chem. Phys. Lett. 2006;426:405–409. [Google Scholar]
- 46.Zinchenko A.A., Yoshikawa K. Na+ shows a markedly higher potential than K+ in DNA compaction in a crowded environment. Biophys. J. 2005;88:4118–4123. doi: 10.1529/biophysj.104.057323. [DOI] [PMC free article] [PubMed] [Google Scholar]
- 47.Schalch T., Duda S., Richmond T.J. X-ray structure of a tetranucleosome and its implications for the chromatin fibre. Nature. 2005;436:138–141. doi: 10.1038/nature03686. [DOI] [PubMed] [Google Scholar]
- 48.Angelescu D.G., Linse P. Monte Carlo simulation of the mean force between two like-charged macroions with simple 1:3 salt added. Langmuir. 2003;19:9661–9668. [Google Scholar]
- 49.Anta J.A., Bresme F., Lago S. Integral equation studies of charged colloids: non-solution boundaries and bridge functions. J. Phys. Condens. Matter. 2003;15:S3491–S3507. [Google Scholar]
- 50.Jusufi A., Hynninen A.P., Panagiotopoulos A.Z. Electrostatic screening and charge correlation effects in micellization of ionic surfactants. J. Phys. Chem. B. 2009;113:6314–6320. doi: 10.1021/jp901032g. [DOI] [PubMed] [Google Scholar]
Associated Data
This section collects any data citations, data availability statements, or supplementary materials included in this article.