

Abstract
Picosecond fluorescence kinetics of wild-type (WT) and mutant cells of Synechocystis sp. PCC 6803, were studied at the ensemble level with a streak-camera and at the cell level using fluorescence-lifetime-imaging microscopy (FLIM). The FLIM measurements are in good agreement with the ensemble measurements, but they (can) unveil variations between and within cells. The BE mutant cells, devoid of photosystem II (PSII) and of the light-harvesting phycobilisomes, allowed the study of photosystem I (PSI) in vivo for the first time, and the observed 6-ps equilibration process and 25-ps trapping process are the same as found previously for isolated PSI. No major differences are detected between different cells. The PAL mutant cells, devoid of phycobilisomes, show four lifetimes: ∼20 ps (PSI and PSII), ∼80 ps, ∼440 ps, and 2.8 ns (all due to PSII), but not all cells are identical and variations in the kinetics are traced back to differences in the PSI/PSII ratio. Finally, FLIM measurements on WT cells reveal that in some cells or parts of cells, phycobilisomes are disconnected from PSI/PSII. It is argued that the FLIM setup used can become instrumental in unraveling photosynthetic regulation mechanisms in the future.
Introduction
Fluorescence techniques provide powerful and noninvasive tools for measuring biological processes under physiological conditions. Time-resolved fluorescence experiments are widely applied to study excitation energy migration and trapping (charge separation) in photosynthetic complexes. However, direct assignment of fluorescence lifetimes in living cells is difficult due to the complexity of the photosynthetic apparatus. Cyanobacteria contain three main photosynthetic complexes: photosystem II (PSII), binding ∼40 chlorophyll (Chl) molecules; photosystem I (PSI), with ∼100 Chls; and the light-harvesting phycobilisome (PBS), with ∼300 phycobilins. Excitation energy captured by PBS is directed to the reaction centers (RCs) of the two PSs, where charge separation occurs. The exact interaction between the PBS and the PSs is still under debate. It is known that a PBS can also be decoupled from the PSs, leading to long-lived fluorescence (1,2). PBS excitation energy distribution between the two PSs is regulated (state transitions), thereby optimizing photosynthetic performance (3,4). It was found recently that two types of PBS exist with different architecture and physiological significance (5,6).
It is known that the fluorescence kinetics of photosynthetic complexes is very fast. A 20- to 30-ps lifetime reflects excitation trapping in the PSI core and a 4- to 5-ps component reflects excitation equilibration between bulk and red Chls (see Gobets and van Grondelle (7) and references therein). Reported data about the PSII core are more diverse: the main trapping time is 35–100 ps, whereas longer components (200–500 ps) are ascribed to secondary electron transfer in open RCs. Even longer decay times (2 ns) are observed for closed RCs (8–10).
All these results stem from bulk experiments that have relatively high temporal resolution and signal/noise ratios but provide no spatial information, and in which the obtained signals reflect ensemble averages. This disadvantage can be overcome by studying individual cells with imaging techniques. In particular, confocal fluorescence microscopy has been applied to study the ultrastructural organization in chloroplasts in plant and algal cells (11–13) and the PSI/PSII distribution in leaves (14,15). New techniques that are interesting for photosynthesis are line-scanning semiconfocal multiphoton fluorescence microscopy, which allows the detection of high time- and spatial-resolution fluorescence spectra (16), and advanced hyperspectral confocal fluorescence imaging, employing single-photon excitation, which provides well-resolved fluorescence spectra of pigments and their localization in the cell (17). In the latter two studies, spatial structural features inside cyanobacterial cells were determined. Vermaas et al. (17) revealed that in Synechocystis sp. PCC 6803, PBS and PSII are mainly located near the periphery of the cell, whereas PSI is located mainly in the central region. Kumazaki et al. (16) found that the Chl/phycobilin ratio in Anabaena PCC 7120 cells is lower in the central region of the cell. Over the last few years, one- and two-photon FLIM have also been used for the determination of fluorescence lifetimes of photosynthetic complexes. FLIM appears to be particularly suitable for measuring excitation energy transfer and trapping, not only in isolated complexes but also in vivo, in intact cells and leaves. It was applied to leaves of different plants (18–20), cyanobacteria (19), and crystals of plant PSI (21) and the major light-harvesting complex of PSII (22) and its aggregates (23). Imaging methods using phase-modulated light have also been applied, but the time resolution was significantly lower (13). In the past, high intensities have led to undesired effects like singlet-singlet and singlet-triplet annihilation (23) or the closure of RCs (8,24). Recently, Broess et al. demonstrated that FLIM can be applied in vivo on photosynthetic organisms without the presence of artifacts by using low-light-intensity two-photon excitation at 860 nm (20). In a recent article, Minagawa and co-workers (25) applied FLIM to study state transitions in the green alga Chlamydomonas reinhardtii. Fitting the fluorescence kinetics to only one decay time was already enough to follow detachment of light-harvesting complexes from PSII, and this led to a refined model for state transitions. It is expected that experiments revealing multiexponential kinetics can resolve more processes and mechanisms in detail.
Here, we apply two-photon FLIM to investigate the fluorescence kinetics of the cyanobacterium Synechocystis sp. PCC 6803 and mutants with a modified photosynthetic apparatus. Synechocystis PCC 6803 is the first phototrophic organism with a fully sequenced genome, and it is widely used as a model organism (26). There is currently significant interest in its photosynthetic properties because of its potential as a producer of biofuels (27). To interpret properly the kinetics of the wild-type (WT), we also study its mutants PAL (28) and BE (newly constructed and reported here for the first time). PAL contains PSII and PSI but no PBS, and BE contains only PSI (no PSII or PBS). In addition, isolated PBSs were measured. The FLIM data are complemented with streak-camera measurements after excitation at 400 nm and 590 nm, exciting mainly either Chls (400 nm) or PBS (590 nm). This allows discrimination between the fluorescence lifetimes of PSI, PSII, and PBS, and it is an important step toward clarifying some long-standing issues in cyanobacterial research: the spatial distribution of PSs, the interaction of PBS with PSI and/or PSII, and the efficiency of excitation energy transfer.
Materials and Methods
Construction of the BE mutant strain
A 1.2-kb polymerase chain reaction (PCR) fragment containing psbB gene was amplified from genomic DNA by using primers BM and BK (BM, 5′-CATGGTGATAATCAAGGGATG-3′; BK, 5′-CGCTTTCGTCGTGGCCGGTAC-3′). The 1.2-kb PCR fragment was ligated onto the pBC plasmid (Stratagene, La Jolla, CA) and amplified in XL1-Blue Escherichia coli. In the resulting plasmid, a 550-bp BstEII fragment was substituted by the erythromycin cassette. This final plasmid was then used to transform the PAL mutant of Synechocystis sp. PCC 6803 strain (28). Transformants were selected on plates containing 20 mM glucose and 20 μg/mL erythromycin and grown in dim light at 30°C. The complete segregation of the mutant was confirmed by PCR. The mutation was also confirmed by the fact that the strain became an obligate heterotroph.
Growth conditions for cyanobacteria WT and mutant cells
WT Synechocystis sp. PCC 6803 and PAL (28) cell cultures were grown in BG11 medium on a rotary shaker and under continuous illumination with white light of intensity 10 μE/m2s. BE cells were grown photoheteroophycally, with 10 mM glucose added to the growth medium. The cells used for measurements were in the logarithmic growth stage and were measured between the third and sixth days of cultivation, with the 679-nm outer diameter (OD) in the range 0.1–0.2.
Preparation of isolated phycobilisomes
PBSs were isolated from Synechocystis sp. PCC 6803 according to the protocol of Garnier et al. (29).
Time-resolved fluorescence measurements
Time-resolved emission spectra were recorded using a streak-camera setup, as described in (21,30). Images were corrected for background and detector sensitivity, averaged, and sliced up into traces 3 nm wide. The time window was 800 ps for BE and 2 ns for WT and PAL cells and isolated PBS. To keep the RCs open, cells were dark-adapted for 10 min before measuring and samples were circulated in a flow cell during measurement. The laser power was typically 200 μW and the repetition rate was 250 kHz.
Two-photon excitation (860 nm) FLIM was performed in vivo, cells were immobilized in 3% agar/BG11 and pressed between microscope and cover glasses. The FLIM setup was described in (31). Fluorescence was detected via nondescanned single-photon counting detection, through two bandpass filters of 700 nm (75 nm width). To minimize photodamage, the lowest possible excitation power was used (of the order of 60 μW average power for WT cells, 350 μW for PAL, and 1.05 mW for BE cells) in combination with long integration times (20–30 min). The amplitude-weighted average lifetime was calculated via . The lifetime distribution for different cells (and inside individual cells) was found to be very reproducible.
FLIM and streak images were analyzed with the TIMP package for R language and environment for statistical computing (32–34). Only pixels with intensity >50 cps were selected for global analysis, resulting in a set of lifetimes that are the same for all pixels and amplitudes that can differ for the various pixels. Pinacyanol in methanol with a lifetime of 6 ps (21) was used as a reference for the time-resolved measurements. The fit quality was judged via singular value decomposition of the residual matrix associated with each FLIM image (35). For further details on the global analysis approach, see Laptenok (36).
All measurements were performed at 22°C.
Results
Fluorescence kinetics of WT cyanobacteria are complex because of the presence of PSI, PSII, and PBSs, each with their own multiexponential dynamics. Moreover, PBSs transfer energy toward both PSI and PSII, whereas back transfer also takes place, further complicating the overall kinetics. To determine the various contributions, we studied Synechocystis sp. strain PCC 6803 cells that contain only PSI (BE), PSI, and PSII, but no PBS (PAL), the WT strain, and isolated PBS from WT.
BE cells
To study a simple system, we constructed a mutant (BE) that lacks PSII and PBS but contains PSI. Steady-state fluorescence and absorption spectra demonstrate the absence of phycobiliproteins in BE (Fig. S1 in the Supporting Material). The circular dichroism spectrum between 660 and 690 nm is very similar to that of isolated PSI trimers from the Spirulina platensis (37), indicating that PSI is properly assembled (Fig. S1). This mutant allows the measurement of PSI fluorescence kinetics directly in vivo, without the need of isolation.
Global analysis of streak-camera data, obtained after 400 nm excitation, leads to the decay-associated spectra (DAS) in Fig. 1. The kinetics is dominated by a 6-ps and a 25-ps component, whereas minor contributions stem from 140-ps and 2.9-ns components. The bipolar 6-ps component reflects equilibration between bulk (blue-shifted) and red-shifted Chls (7), whereas the 25-ps component (maximum 689 nm) reflects excitation trapping due to charge separation in the RC (7). The 140-ps and 2.9-ns components have only minor contributions; they peak below 680 nm and do not belong to PSI.
Figure 1.

DAS of BE cells, obtained after global analysis of streak-camera data. The corresponding lifetimes are given in the figure. The excitation wavelength was 400 nm.
BE cells were also studied with FLIM. A typical FLIM intensity (time-integrated) image of BE cells (Fig. 2 A) shows cells with a diameter of ∼2 μm. For each pixel, the picosecond fluorescence kinetics was registered. Global analysis of the kinetics of the whole image was performed by imposing the condition that the lifetimes are the same for all pixels, whereas amplitudes can differ from pixel to pixel (38). Three exponentials (25 ps, 287 ps, and 2.6 ns) were needed for satisfactory fits, and the corresponding amplitudes are given in Fig. 2, C–E. The amplitude of the 25-ps component is shown in a histogram in Fig. 2 B and it varies between 96% and 98% of the total amplitude. The 6-ps component observed with the streak camera cannot be observed with FLIM, because the time resolution is too low and the absence of spectral resolution leads to (partial) cancellation of positive and negative amplitudes present at different wavelengths. The 287-ps component has a very small contribution (on average just under 3%) and the 2.6-ns component has an even smaller one (1%). The minor components are present in all cells, and thus it can be ruled out that they are due to sample contamination or sample heterogeneity.
Figure 2.

Global analysis results of a representative image of BE cells detected with 700-nm bandpass filter. Global analysis was performed with a three-exponential model. (A) Fluorescence intensity image. (B) Histogram of the shortest fluorescence lifetime component (25 ps). (C–E) Spatial distribution of the individual lifetime components: 25 ps (C), 287 ps (D), and 2.6 ns (E); their corresponding average amplitudes are given in brackets.
PAL cells
No PBSs are synthesized in PAL, and phycobiliprotein emission is absent (28). In Fig. 3, the DAS of PAL cells presented are obtained from 400-nm-excitation streak-camera data. Four components are obtained, with lifetimes 20 ps, 77 ps, 487 ps, and 2.6 ns. The 20-ps component dominates and its DAS peaks around 690 nm. The other components are less pronounced, with their maxima all at 684 nm. The three slowest components are mainly due to PSII, and the 20-ps component should be ascribed to both PSI and PSII.
Figure 3.

DAS of PAL cells, obtained after global analysis of streak-camera data. The corresponding lifetimes are given in the figure. The excitation wavelength was 400 nm.
A typical FLIM intensity image of PAL cells is given in Fig. 4 A. Global analysis resolves four decay components—18 ps, 84 ps, 393 ps, and 1.73 ns—and their spatial distribution is shown in Fig. 4, C–F. The histogram of the average lifetimes is given in Fig. 4 B. The majority of the cells have an average lifetime between 100 and 150 ps, but the distribution shows a tail toward larger values. A typical example of a slow cell is enclosed in the red square in Fig. 4, C–F; its average lifetime is ∼200–250 ps.
Figure 4.

Global analysis results of a representative image of PAL cells detected with 700-nm bandpass filter. Global analysis was performed with a four-exponential model. (A) Fluorescence intensity image. (B) Histogram of the average fluorescence lifetime, <τ>. (C–F) Spatial distribution of the individual lifetime components: 18 ps (C), 84 ps (D), 393 ps (E), and 1.73 ns (F); the corresponding average amplitudes are given in brackets. The red-outlined cell differs from most other cells with regard to lifetime.
In most of the pixels, the amplitude of the 18-ps component is ∼70%, but in some cases it is ∼50% (Fig. 4 C, red square). In the pixels with a low contribution of the 18-ps component, the contribution of the 84-ps (Fig. 4 D) and 393-ps (Fig. 4 E) components is higher. The 1.7-ns contribution is very small in all pixels (Fig. 4 F).
The lifetimes resolved by the streak setup on PAL cells and the relative amplitudes are very similar to those found with FLIM. The only exception seems to be the 393-ps component resolved in FLIM, whose counterpart in the streak images is the 487-ps component. To check whether both components have the same origin, FLIM data analysis was performed with a lifetime fixed to 487 ps. This does not significantly change the fit quality or the other lifetimes. It is concluded that due to the low amplitude of the 393-ps component, the estimation of its value is somewhat problematic, but its origin is the same as that of the 487-ps component in the streak data.
Isolated phycobilisomes
Global analysis of streak-camera data on isolated PBSs after 590 nm excitation resolves four lifetimes: 20 ps, 84 ps, 289 ps, and 1.9 ns (Fig. 5). The 20-ps component exhibits a positive amplitude at 630 nm and a negative one at 650 nm. Such a component was also found by Suter et al. (1), and it is due to energy transfer within the phycocyanin (PC) units. The 84-ps component is positive at 645 nm and negative at 675 nm and is due to transfer from the PC rods to the allophycocyanin core (1). The 289-ps and 1.9-ns components are positive over the entire wavelength range and their maxima, at 655 nm and 665 nm, respectively, indicate that they originate from PC and allophycocyanin, respectively. The 289-ps component is probably due to some disrupted PBSs, which is very difficult to avoid. Upon measuring freshly prepared PBSs, Suter et al. (1) obtained a similar component (230–600 ps). They suggested that this might be due to PBSs with a distorted structure. Indeed, during isolation, some degradation products are detectable (29) (for further information about PBS stability, see (39–41)). In this case, the energy transfer from PC toward the PBS core is perturbed, which can result in a faster decay and blue-shifted emission, consistent with the appearance of the 289-ps component. The amplitude of this component in our case is bigger than in previous studies and is probably due to prolonged storage at room temperature.
Figure 5.
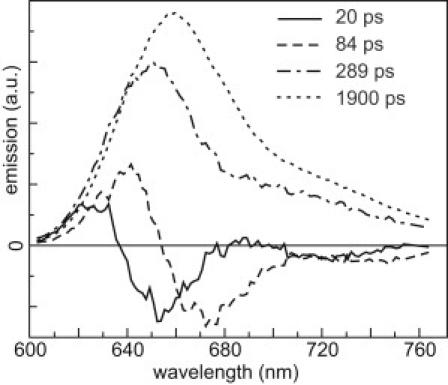
DAS of isolated PBSs, obtained after four-component analysis of streak-camera data. The corresponding lifetimes are given in the figure. The excitation wavelength was 590 nm.
FLIM was also performed on a suspension of PBSs. Because the size of the PBS is far below the spatial resolution of the FLIM, no meaningful pictures can be obtained, but fluorescence lifetimes can be determined. Analysis reveals a 1.87-ns decay time and a 120 ± 20-ps rise time—similar to times obtained by Suter et al. (1) upon excitation at 580 nm and detection at 680 nm for PBSs from Synechococcus sp. PCC 6301. The 120 ± 20-ps rise time most likely corresponds to the 84-ps component found in the streak-camera measurements. The 289-ps component is not resolved with the FLIM, but the most important observation is that isolated PBSs that are not connected to PSI or PSII show a relatively slow rise time in the FLIM measurements, which is ascribed to energy transfer toward acceptor pigments that dominate the fluorescence in the detection window.
Wild-type cells
A typical FLIM intensity image of Synechocystis sp. PCC 6803 WT cells measured upon two-photon excitation at 860 nm is shown in Fig. 6 A. Global analysis of the fluorescence kinetics obtained for the different pixels leads to three lifetime components: 71 ps, 246 ps, and 842 ps. The shortest component has either positive or negative amplitude in the various pixels. In the first case, it represents fluorescence decay, and in the second it represents the rise of fluorescence. To compare the relative amplitudes of the slowest components, they are normalized such that the sum of their amplitudes equals 1, and the average lifetime is estimated using only these two components (Fig. 6 B, histogram). The average lifetime varies for different cells; in the majority of the cells, it is ∼300 ps, but cells with a longer average lifetime (400–450 ps) are also observed (Fig. 6 B, red-outlined cell) and in some cells, pixels with a shorter lifetime are detected (Fig. 6 B, gray-outlined cell). The spatial distribution of the shortest lifetime component (Fig. 6 C) shows pronounced heterogeneity: in some cells, its amplitude is predominantly negative (red-outlined cell), whereas in others it is mainly positive (gray-outlined cell) or close to zero (Fig. 6 C, white cells). The 246-ps component is the dominant component in all pixels, but its distribution varies from cell to cell (Fig. 6 D). In some cells, its amplitude reaches 90%, whereas in others it drops to ∼70%. The contribution of the longest component varies between 10% and 30%, and its amplitude is the highest in cells with a large contribution of the 71-ps component with negative amplitude (Fig. 6 E, red-outlined cell). Thus, a relatively large contribution of the longest component correlates with the presence of the short rise component. Because it is not a priori clear which pigments are preferentially excited via two-photon absorption of 860-nm light, streak-camera measurements were performed with two excitation wavelengths—590 nm (predominant excitation of phycobilins, 92%) and 400 nm (predominant excitation of Chls, 90%). With the use of global analysis, four components were resolved in both cases (Fig. 7) with lifetimes of 25 ps, 125 ps, 389 ps, and a minor component of 2.9 ns for 400-nm excitation (Fig. 7 A), and 15 ps, 72 ps, 227 ps, and 1.8 ns for 590-nm excitation (Fig. 7 B). The fluorescence lifetimes obtained after 400-nm excitation are similar to those found by Mullineaux et al. (42) upon excitation of Chls at 670 nm, and by Bittersman et al. (2) upon excitation of Chls at 680 nm. In accordance with these reports, our streak data reveal the dominance of the shortest component (25 ps) at wavelengths >670 nm, and the corresponding DAS peaks at ∼690 nm, similar to what was observed above for the PAL mutant. The 125-ps and 389-ps components are characterized by rather complicated DAS shapes, reflecting many overlapping spectra and transfer processes. The longest component has almost negligible amplitude and peaks at ∼675 nm.
Figure 6.

Global analysis results of a representative image of Synechocystis PCC 6803 WT cells detected with a 700-nm bandpass filter. Global analysis was performed with a three-exponential model. (A) Fluorescence intensity image. (B) Spatial distribution and histogram of the average lifetime. (C–E) Spatial distribution of the individual lifetime components: 71 ps (C), 246 ps (D), and 842 ps (E).
Figure 7.

DAS of Synechocystis WT cells, resulting from a four-component global analysis of streak-camera data, obtained upon 400-nm (A) and 590-nm (B) excitation. The corresponding lifetimes are given in the figure.
Similar to what was observed by Mullineaux et al. (42,43) and Bittersman et al. (2) upon 610-nm phycobilin excitation, 590-nm excitation leads to two transfer components with fluorescence lifetimes of 15 ps and 72 ps, a major 227-ps decay component with emission maximum at ∼660 nm and a 1.8-ns decay component with a broad emission maximum. The DAS of the 1.8-ns component has a relatively large amplitude that is far higher than that of the slow component observed after 400-nm excitation and its spectrum shows, moreover, a large contribution from PBSs (see results above on isolated PBSs). The lifetimes resemble those obtained in the FLIM experiments, and the relatively large contribution of the slowest component is also more in line with the high value obtained in the FLIM results than the rather small contribution in the 400-nm experiment. Therefore, it can be concluded that in the FLIM measurements, excitation mainly takes place in the PBS.
Discussion
Time-resolved fluorescence techniques are widely used for measuring the ultrafast processes of excitation energy migration and charge separation in isolated photosynthetic complexes and whole cells but they only allow the study of large ensembles, and in most cases the implicit assumption has to be made that the preparations are homogeneous. This disadvantage can partly be overcome by performing FLIM measurements where the resolved fluorescence lifetimes can in principle be correlated with the variation among cells, background signals from outside the cells can be omitted, and even variations within individual cells can be addressed.
In this work, we apply FLIM for the first time that we know of to study cyanobacterial cells (WT and mutant Synechocystis cells) with the particular aim of investigating to what extent cell-to-cell variation can be observed and understood. This may allow future research on individual cells in different states of their life cycle and under different stress conditions. Streak-camera measurements are used to identify and assign specific fluorescence lifetimes. A summary of the resolved lifetimes and their assignment is presented in Table 1.
Table 1.
Assignment of fluorescence lifetimes
| Sample | FLIM |
Streak-camera 590-nm excitation for WT/PBS and 400 nm for PAL/BE |
||
|---|---|---|---|---|
| Lifetime | Assignment | Lifetime | Assignment | |
| WT | 15 ps | Energy transfer in PBS (below 680 nm)/Chl decay (above 680 nm) | ||
| 71 ps | Chl decay (coupled PBS)/Energy transfer in PBS (decoupled PBS) | 72 ps | Energy transfer in PBS (<690 nm)/Chl decay (>690 nm) | |
| 246 ps | Allophycocyanin decay | 227 ps | Allophycocyanin decay | |
| 842 ps | Terminal emitters/closed PSII RCs | 1.8 ns | Terminal emitters/closed PSII RCs | |
| PBS | 20 ps | Transfer within phycocyanin disks | ||
| 122 ps | Energy transfer in PBS | 84 ps | Energy transfer in PBS | |
| 289 ps | PC decay | |||
| 1.87 ns | Allophycocyanin decay | 1.9 ns | Allophycocyanin decay | |
| PAL | 18 ps | PSI + PSII trapping | 20 ps | PSI + PSII trapping |
| 84 ps | PSII | 77 ps | PSII | |
| 393 ps | PSII | 487 ps | PSII | |
| 1.73 ps | Closed PSII RCs | 2.6 ns | Closed PSII RCs/free Chl | |
| BE | 6 ps | Equilibration between red and bulk Chls | ||
| 25 ps | PSI trapping | 25 ps | PSI trapping | |
| 287 ps | ? | 140 ps | ? | |
| 2.6 ns | Free Chl | 2.9 ns | Free Chl | |
Advantages of the combination of FLIM and streak-camera experiments
We would like to underline the remarkable sensitivity of the current setup/measurements. The picosecond kinetics of (substructures of) individual cells can now be measured without singlet-singlet and singlet-triplet annihilation effects, which was not possible fewer than 10 years ago (23), and the RCs can be kept in the open state (see also Broess et al. (20)). This is due to the relatively low excitation powers (two-photon excitation) and the high detection sensitivity of the FLIM setup. The presence of closed PSII RCs is often an obstacle when applying time-resolved techniques, and usually chemicals are added to keep them in an open state. We have encountered the same problem while measuring PAL cells on the streak-camera setup, and in general, the intensities should be kept very low. We would also like to point out that with global analysis of the FLIM images it has now become possible to estimate the amplitudes and lifetimes of even four exponential components, the shortest being ∼20 ps. This is another substantial improvement of the method over, for instance, recent results of Minegawa and co-workers (25) on the photosynthetic alga Chlamydomonas reinhardtii, in which basically two dominant lifetimes (which differed for different states of the algae) and one minor component were resolved, whereas lifetimes <70 ps could not be resolved. This will also allow further in-depth research into the state transitions of this algal species.
The picosecond kinetics of PSI in vivo and in vitro are nearly identical, with very small variation among cells
The streak-camera data on BE cells show the presence of a 6-ps time constant that corresponds to excitation equilibration between blue and red Chl a species in PSI, whereas a 25-ps time constant reflects trapping of the excitations in the RC. The first component cannot be resolved in the FLIM measurements, but the second one can. These values are similar to the 4.4-ps and 23.7-ps time constants found for isolated monomeric PSI and the 4.7-ps and 23.2-ps time constants found for trimeric PSI, both from Synechocystis PCC 6803 (7). It should be noted that in the in vitro experiments, there is always a contribution of free Chl a of several percent. Also, in our in vivo experiments, a nanosecond component is found with a fluorescence maximum at ∼675 nm, but its amplitude is typically <1%. Some peripheral Chl a might be lost upon isolation, possibly leading to a shortening of the fluorescence lifetimes, but as can be observed, the consequences are minor. It is interesting that both the streak and the FLIM measurements reveal the fluorescence of a strongly quenched Chl a component with a lifetime of 140 ps (streak data)/287 ps (FLIM data) and an amplitude of a few percent. Because the amplitude is small, the value of the lifetime is not very accurate. The spectrum is blue-shifted with respect to that of PSI, and such a component has never been observed for isolated PSI from cyanobacteria. It is possibly due to Cytb6f, which contains one strongly quenched Chl a molecule per complex. Isolated Cytb6f from Synechocystis PCC 6803 shows a broad fluorescence spectrum peaking at 676.5 nm, whereas the fluorescence lifetime is ∼250 ps (44). Indeed, this is very much reminiscent of our experimental observation. Nevertheless, it cannot be completely excluded that the fluorescence may stem from Chl a attached to some other (light-harvesting) protein, for instance CP43 (45). Despite the fact that the fluorescence lifetime of Chl a in isolated light-harvesting complexes is usually around several nanoseconds (see, e.g., Palacios et al. (46)), it seems to be quenched in the thylakoid membrane (47).
PSI and PSII kinetics only partly overlap, and variation of the PSI/PSII ratio in different cells can be quantified in the absence of PBSs
The streak-camera data of PAL cells that contain PSI and PSII only are satisfactorily described by four DAS with lifetimes of 20 ps, 77 ps, 487 ps, and 2.6 ns. The last three components must be ascribed to PSII, because they peak at ∼684 nm, which is too red for free Chl a or Cytb6f and too blue for PSI. Moreover, they are too slow for PSI (see above). The 20-ps DAS is by far the largest one (68% in area) and its DAS has an emission maximum at ∼690 nm. It might be tempting to ascribe this component to PSI, but a comparison of the areas of the various DAS would then imply that the PSI/PSII ratio would be 2.1 (i.e., as far as the number of Chl molecules is concerned). This is far higher than the expected value of 0.7 reported for PAL by Stadnichuk et al. (48), a number that is based on the measurement of action spectra of PSI and PSII. Therefore, the 20-ps component should contain a substantial contribution from PSII. The 6-ps and 25-ps components of PSI obtained for BE cells cannot be resolved separately for PAL cells because of the interfering contribution from PSII. Indeed, recent measurements on PSII core particles from Thermosynechococcus elongatus revealed similarly fast components due to energy transfer (2 and 9 ps) and trapping (41 ps), in addition to slower components that were ascribed to protein relaxation (105 ps), electron transfer from Phe− to Qa (332 ps), and a minor contribution from closed PSII RCs (2 ns) (10). Apparently, all the fast components are lumped into one 20-ps component in the fitting of the results presented here.
We tried to obtain a rough estimate of the relative contributions of PSI and PSII to the 20-ps component by comparing the PSI and PSII DAS (described in section S2 in the Supporting Material; see also Fig. S2). Using a simple approximation, we obtained 0.30 ± 0.05 × PSII DAS + 0.70 ± 0.05 × PSI DAS (Fig. S2), demonstrating that the 20-ps component is dominated by PSI but that the contribution from PSII is substantial. In general, the area under a (positive) DAS scales linearly with the number of pigments contributing to this component. By comparing the areas of the various DAS, it is estimated that the ratio between the number of Chls in PSI and PSII, respectively, is 0.92 ± 0.12. This value is indeed close to the expected value of 0.7 (48).
As already mentioned in the Results section, the lifetimes obtained in the FLIM experiments are very similar to those obtained with the streak-camera measurements, and the same is true for amplitudes. In the majority of the pixels, the amplitude of the 18-ps component is ∼70%, but in some cases it is ∼50% (Fig. 4 C, red-outlined cell), whereas on average the value is very similar to the 68% obtained for the 20-ps component in the streak-camera images (Fig. 3). It is interesting that in the pixels with a low contribution of the 18-ps component, the contribution of the 84-ps (Fig. 4 D) and 393-ps (Fig. 4 E) components is higher but the 1.7-ns component still has a very small contribution in all pixels (Fig. 4 F). The possibility is thus ruled out that the decrease of the amplitude of the fast component is due to the closure of PSII RCs, since this would lead to a large increase in the amplitude of the nanosecond component (note that the fast lifetime of PSI does not change upon closure of the RC). Therefore, it is concluded that in a small percentage of the cells the PSI/PSII ratio is substantially lower than in the majority of the cells. The reason is unclear at this moment, but at least it is demonstrated that the FLIM method has the capability of detecting these cells. Using the simple approximation given above, it can be estimated that in the majority of the pixels, 50% of the Chls are bound to PSII, whereas in a small fraction of the pixels, this number is ∼75%.
PBS-containing cells. Inhomogeneous distribution of PBS
As demonstrated above, the results of FLIM measurements on WT cells resemble the results of streak-camera measurements upon 590-nm excitation (92% PBS excitation) far better than such measurements upon 400-nm excitation (90% photosystems excitation), meaning that the two-photon excitation with 860-nm light is rather selective for phycobiliproteins. Like the streak-camera measurements, the FLIM measurements reveal the major excitation energy transfer and trapping processes (71 ps and 246 ps), and only the 15-ps component is not detected, mainly because the corresponding DAS has positive and negative contributions at different wavelengths that cancel during simultaneous detection over a broad wavelength region with the FLIM setup. A slow decay component is detected with both techniques: this component is 1760 ps in the streak-camera measurements and 842 ps in the FLIM measurements, but the exact value is ill-determined. It is already argued above that the slow component should be ascribed to un/disconnected PBSs. The FLIM experiments now reveal that the un/disconnected PBSs are only prominently present in part of the cells. For the red-outlined cell in Fig. 6, the contribution of the long component is present everywhere at very large amplitude, and apparently a large fraction of the PBS is disconnected, much more than in most of the other cells. It is interesting to note that this is also reflected in the 71-ps component. Whereas in most cells the amplitude of this component is positive, it is negative for most of the pixels in the red-framed cell, and also, this component is due to disconnected PBSs. This can be understood by comparing the 72-ps DAS for WT cells and the 84-ps DAS of PBSs. The latter is almost entirely positive, whereas the former is largely negative, because the excitation energy transfer toward the red pigments in the PBS is not followed by trapping by the RCs. Also, the FLIM measurements on isolated PBSs show a negative component, and the rise time is 120 ± 20 ps in that case. It should be noted, however, that the lifetime obtained from the global analysis procedure of the FLIM images is a weighted average of the rise and decay components, and since the majority of the PBSs are connected, the 72-ps trapping time will dominate the obtained average time. In conclusion, the substantial fraction of disconnected PBSs observed in the ensemble measurements with the streak-camera setup is found to be inhomogeneously distributed over the various cells.
Acknowledgments
The authors thank Mr. Tian Lijin for critically reading the manuscript and for helpful comments, and Mr. Arie van Hoek and Mr. Rob B.M. Koehorst for technical help with the measurements.
This work was supported by the European Union Sixth Framework Programme grant MRTN-CT-2005-019481 to H.v.A., S.B.K., and S.P.L., the Sandwich Ph.D. program of Wageningen University (to S.P.L.), and the Computational Science grant 635.000.014 from the Netherlands Organization for Scientific Research (to S.P.L.). Partial support was obtained by a grant from the Hungarian Science Foundation (OTKA, K 82052).
Supporting Material
References
- 1.Suter G.W., Mazzola P., Holzwarth A.R. Fluorescence decay kinetics in phycobilisomes isolated from the bluegreen alga Synechococcus 6301. Biochim. Biophys. Acta. 1984;766:269–276. [Google Scholar]
- 2.Bittersmann E., Vermaas W. Fluorescence lifetime studies of cyanobacterial Photosystem II mutants. Biochim. Biophys. Acta. 1991;1098:105–116. [Google Scholar]
- 3.Murata N. Fluorescence of chlorophyll in photosynthetic systems. IV. Induction of various emissions at low temperatures. Biochim. Biophys. Acta. 1968;162:106–121. doi: 10.1016/0005-2728(68)90219-3. [DOI] [PubMed] [Google Scholar]
- 4.Mullineaux C.W. Phycobilisome-reaction centre interaction in cyanobacteria. Photosynth. Res. 2008;95:175–182. doi: 10.1007/s11120-007-9249-y. [DOI] [PubMed] [Google Scholar]
- 5.Kondo K., Ochiai Y., Ikeuchi M. The membrane-associated CpcG2-phycobilisome in Synechocystis: a new photosystem I antenna. Plant Physiol. 2007;144:1200–1210. doi: 10.1104/pp.107.099267. [DOI] [PMC free article] [PubMed] [Google Scholar]
- 6.Kondo K., Mullineaux C.W., Ikeuchi M. Distinct roles of CpcG1-phycobilisome and CpcG2-phycobilisome in state transitions in a cyanobacterium Synechocystis sp. PCC 6803. Photosynth. Res. 2009;99:217–225. doi: 10.1007/s11120-008-9399-6. [DOI] [PubMed] [Google Scholar]
- 7.Gobets B., van Grondelle R. Energy transfer and trapping in photosystem I. Biochim. Biophys. Acta. 2001;1507:80–99. doi: 10.1016/s0005-2728(01)00203-1. [DOI] [PubMed] [Google Scholar]
- 8.Schatz G.H., Brock H., Holzwarth A.R. Kinetic and energetic model for the primary processes in photosystem II. Biophys. J. 1988;54:397–405. doi: 10.1016/S0006-3495(88)82973-4. [DOI] [PMC free article] [PubMed] [Google Scholar]
- 9.Holzwarth A.R., Müller M.G., Rögner M. Kinetics and mechanism of electron transfer in intact photosystem II and in the isolated reaction center: pheophytin is the primary electron acceptor. Proc. Natl. Acad. Sci. USA. 2006;103:6895–6900. doi: 10.1073/pnas.0505371103. [DOI] [PMC free article] [PubMed] [Google Scholar]
- 10.Miloslavina Y., Szczepaniak M., Holzwarth A.R. Charge separation kinetics in intact photosystem II core particles is trap-limited. A picosecond fluorescence study. Biochemistry. 2006;45:2436–2442. doi: 10.1021/bi052248c. [DOI] [PubMed] [Google Scholar]
- 11.van Spronsen E.A., Sarafis V., Nanninga N. Three-dimensional structure of living chloroplasts as visualized by confocal scanning laser microscopy. Protoplasma. 1989;148:8–14. [Google Scholar]
- 12.Mehta M., Sarafis V., Critchley C. Thylakoid membrane architecture. Aust. J. Plant Physiol. 1999;26:709–716. [Google Scholar]
- 13.Holub O., Seufferheld M.J., Clegg R.M. Fluorescence lifetime imaging (FLI) in real-time: a new technique in photosynthesis research. Photosynthetica. 2000;38:581–599. [Google Scholar]
- 14.Pfündel E., Neubohn B. Assessing photosystem I and II distribution in leaves from C4 plants using confocal laser scanning microscopy. Plant Cell Environ. 1999;22:1569–1577. [Google Scholar]
- 15.Vácha F., Sarafis V., Nedbal L. Identification of Photosystem I and Photosystem II enriched regions of thylakoid membrane by optical microimaging of cryo-fluorescence emission spectra and of variable fluorescence. Micron. 2007;38:170–175. doi: 10.1016/j.micron.2006.07.013. [DOI] [PubMed] [Google Scholar]
- 16.Kumazaki S., Hasegawa M., Terazima M. A line-scanning semi-confocal multi-photon fluorescence microscope with a simultaneous broadband spectral acquisition and its application to the study of the thylakoid membrane of a cyanobacterium Anabaena PCC7120. J. Microsc. 2007;228:240–254. doi: 10.1111/j.1365-2818.2007.01835.x. [DOI] [PubMed] [Google Scholar]
- 17.Vermaas W.F.J., Timlin J.A., Haaland D.M. In vivo hyperspectral confocal fluorescence imaging to determine pigment localization and distribution in cyanobacterial cells. Proc. Natl. Acad. Sci. USA. 2008;105:4050–4055. doi: 10.1073/pnas.0708090105. [DOI] [PMC free article] [PubMed] [Google Scholar]
- 18.Lukins P.B., Rehman S., George D. Time-resolved spectroscopic fluorescence imaging, transient absorption and vibrational spectroscopy of intact and photo-inhibited photosynthetic tissue. Luminescence. 2005;20:143–151. doi: 10.1002/bio.819. [DOI] [PubMed] [Google Scholar]
- 19.Eckert H.-J., Petrask Z., Kemnitz K. Application of novel low-intensity non-scanning fluorescence lifetime imaging microscopy for monitoring excited state dynamic in individual chloroplasts and living cells of photosynthetic organisms. Conf. Adv Photon Count. Techs. Boston, MA. 2006;6372:637207.1–637207.9. [Google Scholar]
- 20.Broess K., Borst J.W., van Amerongen H. Applying two-photon excitation fluorescence lifetime imaging microscopy to study photosynthesis in plant leaves. Photosynth. Res. 2009;100:89–96. doi: 10.1007/s11120-009-9431-5. [DOI] [PMC free article] [PubMed] [Google Scholar]
- 21.van Oort B., Amunts A., Croce R. Picosecond fluorescence of intact and dissolved PSI-LHCI crystals. Biophys. J. 2008;95:5851–5861. doi: 10.1529/biophysj.108.140467. [DOI] [PMC free article] [PubMed] [Google Scholar]
- 22.Pascal A.A., Liu Zh., Ruban A. Molecular basis of photoprotection and control of photosynthetic light-harvesting. Nature. 2005;436:134–137. doi: 10.1038/nature03795. [DOI] [PubMed] [Google Scholar]
- 23.Barzda V., de Grauw C.J., Gerritsen H.C. Fluorescence lifetime heterogeneity in aggregates of LHCII revealed by time-resolved microscopy. Biophys. J. 2001;81:538–546. doi: 10.1016/S0006-3495(01)75720-7. [DOI] [PMC free article] [PubMed] [Google Scholar]
- 24.Govindjee M., van de Ven, Gratton E. Chlorophyll a fluorescence lifetime distributions in open and closed photosystem II reaction center preparations. Biochim. Biophys. Acta. 1990;1015:173–179. doi: 10.1016/0005-2728(90)90017-x. [DOI] [PubMed] [Google Scholar]
- 25.Iwai M., Yokono M., Minagawa J. Live-cell imaging of photosystem II antenna dissociation during state transitions. Proc. Natl. Acad. Sci. USA. 2010;107:2337–2342. doi: 10.1073/pnas.0908808107. [DOI] [PMC free article] [PubMed] [Google Scholar]
- 26.Ikeuchi M., Tabata S. Synechocystis sp. PCC 6803: a useful tool in the study of the genetics of cyanobacteria. Photosynth. Res. 2001;70:73–83. doi: 10.1023/A:1013887908680. [DOI] [PubMed] [Google Scholar]
- 27.Angermayr S.A., Hellingwerf K.J., de Mattos M.J. Energy biotechnology with cyanobacteria. Curr. Opin. Biotechnol. 2009;20:257–263. doi: 10.1016/j.copbio.2009.05.011. [DOI] [PubMed] [Google Scholar]
- 28.Ajlani G., Vernotte C. Construction and characterization of a phycobiliprotein-less mutant of Synechocystis sp. PCC 6803. Plant Mol. Biol. 1998;37:577–580. doi: 10.1023/a:1005924730298. [DOI] [PubMed] [Google Scholar]
- 29.Garnier F., Dubacq J.P., Thomas J.C. Evidence for a transient association of new proteins with the Spirulina maxima phycobilisome in relation to light intensity. Plant Physiol. 1994;106:747–754. doi: 10.1104/pp.106.2.747. [DOI] [PMC free article] [PubMed] [Google Scholar]
- 30.van Oort B., Murali S., van Amerongen H. Ultrafast resonance energy transfer from a site-specifically attached fluorescent chromophore reveals the folding of the N-terminal domain of CP29. Chem. Phys. 2009;357:113–119. [Google Scholar]
- 31.Borst J.W., Hink M.A., Visser A.J. Effects of refractive index and viscosity on fluorescence and anisotropy decays of enhanced cyan and yellow fluorescent proteins. J. Fluoresc. 2005;15:153–160. doi: 10.1007/s10895-005-2523-5. [DOI] [PubMed] [Google Scholar]
- 32.Laptenok S., Mullen K.M., Visser A.J.W.G. Fluorescence lifetime imaging microscopy (FLIM) data analysis with TIMP. J. Stat. Softw. 2007;18:1–20. [Google Scholar]
- 33.Mullen K.M., van Stokkum I.H.M. TIMP: an R package for modeling multi-way spectroscopic measurements. J. Stat. Softw. 2007;18:1–46. [Google Scholar]
- 34.R Development Core Team . R Foundation for Statistical Computing; Vienna: 2008. R: A Language and Environment for Statistical Computing. [Google Scholar]
- 35.Golub G.H., van Loan C.F. Johns Hopkins University Press; Baltimore: 1996. Matrix Computations. [Google Scholar]
- 36.Laptenok, S. 2009. Global analysis of time-resolved fluorescence microspectroscopy and applications in biomolecular studies. Ph.D. thesis. Wageningen University, Wageningen, The Netherlands.
- 37.Engelmann E., Tagliabue T., Jennings R.C. CD spectroscopy provides evidence for excitonic interactions involving red-shifted chlorophyll forms in photosystem I. FEBS Lett. 2001;499:112–115. doi: 10.1016/s0014-5793(01)02533-9. [DOI] [PubMed] [Google Scholar]
- 38.Laptenok S.P., Borst J.W., van Amerongen H. Global analysis of Förster resonance energy transfer in live cells measured by fluorescence lifetime imaging microscopy exploiting the rise time of acceptor fluorescence. Phys. Chem. Chem. Phys. 2010;12:7593–7602. doi: 10.1039/b919700a. [DOI] [PubMed] [Google Scholar]
- 39.Gantt E., Lipschultz C.A. Phycobilisomes of Porphyridium cruentum. I. Isolation. J. Cell Biol. 1972;54:313–324. doi: 10.1083/jcb.54.2.313. [DOI] [PMC free article] [PubMed] [Google Scholar]
- 40.Glaser A.N. Phycobilisome. Methods Enzymol. 1988;167:304–312. [Google Scholar]
- 41.Katoh T. Phycobilisome stability. Methods Enzymol. 1988;167:313–318. [Google Scholar]
- 42.Mullineaux C.W., Bittersmann E., Holzwarth A.R. Picosecond time-resolved fluorescence emission spectra indicate decreased energy transfer from the phycobilisome to Photosystem II in light-state 2 in the cyanobacterium Synechococcus 6301. Biochim. Biophys. Acta. 1990;1015:231–242. [Google Scholar]
- 43.Mullineaux C.W., Holzwarth A.R. Kinetics of excitation energy transfer in the cyanobacterial phycobilisome-photosystem II complex. Biochim. Biophys. Acta. 1991;1098:68–78. [Google Scholar]
- 44.Peterman E.J.G., Wenk S.-O., van Amerongen H. Fluorescence and absorption spectroscopy of the weakly fluorescent chlorophyll a in cytochrome b6f of Synechocystis PCC6803. Biophys. J. 1998;75:389–398. doi: 10.1016/S0006-3495(98)77523-X. [DOI] [PMC free article] [PubMed] [Google Scholar]
- 45.Yu J., Vermaas W.F.J. Transcript levels and synthesis of photosystem II components in cyanobacterial mutants with inactivated photosystem II genes. Plant Cell. 1990;2:315–322. doi: 10.1105/tpc.2.4.315. [DOI] [PMC free article] [PubMed] [Google Scholar]
- 46.Palacios M.A., de Weerd F.L., van Amerongen H. Superradiance and exciton (de)localization in light-harvesting complex II from green plants? J. Phys. Chem. B. 2002;106:5782–5787. [Google Scholar]
- 47.van Oort B., Alberts M., van Amerongen H. Effect of antenna-depletion in Photosystem II on excitation energy transfer in Arabidopsis thaliana. Biophys. J. 2010;98:922–931. doi: 10.1016/j.bpj.2009.11.012. [DOI] [PMC free article] [PubMed] [Google Scholar]
- 48.Stadnichuk I.N., Lukashev E.P., Elanskaya I.V. Fluorescence changes accompanying short-term light adaptations in photosystem I and photosystem II of the cyanobacterium Synechocystis sp. PCC 6803 and phycobiliprotein-impaired mutants: State 1/State 2 transitions and carotenoid-induced quenching of phycobilisomes. Photosynth. Res. 2009;99:227–241. doi: 10.1007/s11120-009-9402-x. [DOI] [PubMed] [Google Scholar]
Associated Data
This section collects any data citations, data availability statements, or supplementary materials included in this article.