

Abstract
Nef is an HIV-1 accessory protein that directly contributes to AIDS progression. Nef is myristoylated on the N-terminus, associates with membranes, and may undergo a transition from a solution conformation to a membrane-associated conformation. It has been hypothesized that conformational rearrangement enables membrane-associated Nef to interact with cellular proteins. Despite its medical relevance, to our knowledge there is no direct information about the conformation of membrane-bound Nef. In this work, we used neutron reflection to reveal what we believe are the first details of the conformation of membrane-bound Nef. The conformation of Nef was probed upon binding to Langmuir monolayers through the interaction of an N-terminal His tag with a synthetic metal-chelating lipid, which models one of the possible limiting cases for myr-Nef. The data indicate that residues are inserted into the lipid headgroups during interaction, and that the core domain lies directly against the lipid headgroups, with a thickness of ∼40 Å. Binding of Nef through the N-terminal His tag apparently facilitates insertion of residues, as no insertion occurred upon binding of Nef through weak electrostatic interactions in the absence of the specific interaction through the His tag.
Introduction
The human immunodeficiency virus (HIV-1) encodes several accessory proteins: Nef, Vif, Rev, Vpr, and Vpu (see Bour and Strebel (1) and Frankel and Young (2) for reviews). Nef is expressed in high concentrations shortly after viral infection (3), is required for achieving and maintaining high viral loads in vivo (4), and plays a critical role in AIDS progression (as reviewed in Baur (5) and Das and Jameel (6)). Rhesus monkeys bearing strains of simian immunodeficiency virus (SIV) lacking Nef do not develop high viral loads or progress to the expected AIDS-like disease (7). Transgenic expression of just the HIV Nef protein (8,9) or the SIV Nef protein (10) in mice produced a severe AIDS-like syndrome, illustrating the essential role of Nef in disease progression. Clinical studies of long-term (15–25 years) HIV-infected humans (long-term nonprogressors) with apparent deletions and/or alterations within the nef gene showed impaired progression to AIDS (see, e.g., Gorry and co-workers (11,12)). It is clear that the Nef protein is an important factor in the progression of AIDS, and obtaining details about its function is extremely desirable.
Nef has no catalytic activity but instead realizes its functions by interacting with cellular proteins. More than 30 proteins that interact with Nef have been identified (see reviews by Baur and colleagues (5,13)). Nef function can be broadly grouped into three categories, as described in recent reviews (5,14,15): 1), interference with signaling pathways; 2), downregulation of cell-surface receptors and trafficking; and 3), infectivity enhancement. Many of the functions of Nef appear to be structurally driven or intimately tied to conformation and conformational changes (13,16,17). In addition, membrane association plays a very important role in many of the functions of Nef.
Nef exists in both membrane-associated and cytosolic fractions (18) and shuttling may occur between the cytosolic fraction and the membrane-associated form (19). Membrane association is thought to be accomplished by an N-terminal myristoylation essential for the virus in vivo (20), as well as a cluster of basic residues on the N-terminal arm (19,21,22). The myristoylation signal (residues 2–7) is essential and highly conserved in Nef alleles from both laboratory HIV-1 strains and primary isolates from AIDS patients (23). Deletion of the Myr group dramatically reduces infectivity (4), cripples downregulation of CD4 and MHC-1 (4,24), and prevents formation of an AIDS-like disease in mice transfected with Nef (25). Both the Myr and the basic cluster are required for Nef viron incorporation (26). However, some controversy remains in the literature over the precise role of the myristoylation in the membrane association of Nef (27,28), as Myr is a short fatty acid chain that provides only a weak membrane anchor.
Despite the wealth of knowledge about what Nef does, there is much less information about how it accomplishes its functions. Understanding Nef structure-function relationships both in solution and in association with membranes is very likely key to understanding and combating the actions of Nef in vivo. Such an endeavor requires conformational details about Nef. However, obtaining structural information about Nef, particularly when associated with membranes, has not been an easy task.
The full-length Nef protein is partially disordered and contains regions that are intrinsically flexible; therefore, it has not yet been crystallized, and by itself it is incompatible with NMR analysis. To date, structural analyses by x-ray crystallography and NMR spectroscopy have been confined to deletion variants (29–32). Unfortunately, the deleted regions contain essential determinants of Nef function. Structural information for HIV Nef was assembled into a model of the full-length protein (17). In this model, the conformation of the loop between Leu157 and Asn174 remains unknown, and the residues were inserted with a probable conformation before energy minimization. Hydrogen-exchange mass spectrometry has provided further structural insights for full-length His-tagged HIV and SIV Nef, particularly concerning the conformational properties of the N-terminal arm and the disordered loop (33). The N-terminal regions of both HIV and SIV Nef appear to have structure or are involved in some form of intra- or intermolecular interactions that lead to protection from exchange. The large loop near the middle of the protein is unstructured and solvent-exposed. The C-terminal region exhibits some degree of protection from exchange.
Despite the importance of membrane-associated Nef, essentially no conformational details exist in that state. Conformational rearrangement may occur when Nef becomes membrane-associated. It has been postulated (13,34,35) that Nef undergoes a myristic acid conformational switch (36) from a closed form to an open form. In the closed form, the myristic acid is thought to be inserted into a binding pocket in the core domain. Recent evidence supporting this idea showed that Nef can bind a peptide with the same sequence as its N-terminus only when that peptide is myristoylated (37). Contact with the membrane could trigger the conformational change of Nef from the closed form to an open form. Although strong evidence exists for binding to the membrane through the basic residues on the N-terminal arm (22,27), nothing is known about the disposition of the other flexible regions. The core domain might be significantly displaced from the membrane, as proposed for a conformational state termed signaling Nef (13), which would facilitate interaction with protein partners at the membrane, including TCR, CD4, Lck, and Hck (34,37). On the other hand, the core domain could lie directly against the lipid membrane or even be partially inserted. Alternative experimental methods are required to reveal the structure of Nef bound to membranes so that these hypotheses can be tested.
In this work, neutron reflectometry (NR) was used to reveal the first details, to our knowledge, of membrane-bound Nef. NR is one of very few methods that can resolve structural details of membrane-associated proteins in physiological conditions, and it may be unique in its ability to directly resolve details of the full membrane-bound protein structure, in contrast to techniques that probe only labeled residues or secondary-structural elements. NR involves measuring the ratio of reflected to incident intensity as a function of momentum transfer, qz = 4πsinθ/λ, where θ is the angle of incidence with respect to the plane of the membrane and λ is the wavelength (38). The form of this curve is determined by the in-plane averaged scattering-length density (SLD) profile normal to the surface. The SLD is directly related to the atomic composition and the density. Therefore, for a protein bound to a planar lipid membrane, NR determines the in-plane averaged distribution of amino acid residues normal to the membrane, and is sensitive to any changes in that distribution.
In this initial study, an N-terminal His tag was used to bind full-length, unmyristoylated Nef (strain SF2) to a planar lipid membrane (in this case, a Langmuir monolayer) composed of mixtures of 1,2-dipalmitoyl-sn-glycero-3-(phosphocholine) (DPPC) and 1,2-distearylglycero-3-triethyleneoxideiminodiacetic acid (DSIDA). The N-terminal 6His tag on Nef was spatially located where the naturally occurring myristic acid moiety would be found in Nef. The His tag adsorbed to Cu2+ in the headgroups of DSIDA to localize Nef to the membrane. This system represents one of the possible limiting states of membrane-bound myr-Nef, namely the form in which the N-terminus is unassociated with the core domain and associates specifically with lipid membranes. The experimental system is illustrated in Fig. 1, which shows the two size extremes of Nef and their relationship to the membrane and the neutron beam. For the most extended form, the dimensions of Nef from the model of Geyer and Peterlin (17) were used and the protein was attached to the membrane by its N-terminus with no insertion. Fig. 1 also shows the dimensions of the two lipids and a very highly compact form of Nef. Several experimental methods were found to achieve a nearly monomolecular layer of membrane-bound Nef at sufficiently high coverage for study by NR (discussed in detail in the Supporting Material). The structure of membrane-bound Nef determined from these data is described below.
Figure 1.
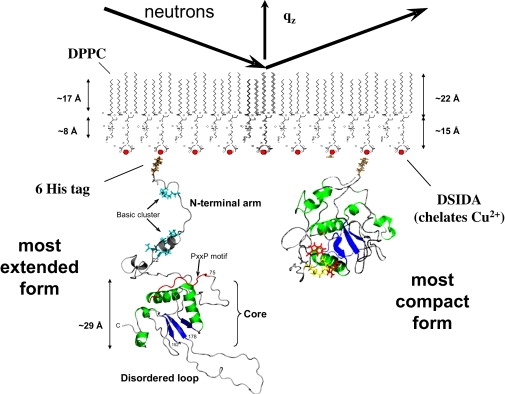
Illustration of the experimental system. Neutrons strike the opposite face of the lipid monolayer from where Nef interacts. The dimensions of Nef from the most extended form of the Geyer and Peterlin model (17) are shown at the left, along with the dimensions of the two lipids. For the purpose of size comparison, a model of a highly compact form of Nef is shown on the right. This figure is meant to illustrate the experimental setup and not necessarily to show the true conformation of Nef at the membrane.
Materials and Methods
For enhanced contrast in the NR studies, both deuterated 6His-Nef and deuterated lipids were used. DPPC and a deuterated form of DPPC in which the 62 protons in the aliphatic tails were replaced with deuterons (d-DPPC) were purchased from Avanti (Alabaster, AL). The synthesis of DSIDA has been described previously (39). Deuterated DSIDA (d70-DSIDA) was synthesized using a similar procedure, starting with perdeuterated octadecanoic acid (Larodan, Malmo, Sweden). NMR results for d-DSIDA are given in the Supporting Material. Tris buffer (pH 8.2) was prepared by dissolving 1.23 g of Trizma HCl, 1.48 g Trizma base, and 5.84 g sodium chloride (all from Aldrich Chemical, Milwaukee, WI) in 1 L of Millipore water (18 MΩ resistivity, Millipore, Billerica, MA). Chloroform, CuCl2 (99.995+%), β-mercaptoethanol, and dithiothreitol (DTT) were purchased from Aldrich Chemical. NMR analyses were performed on an Innova Spectrometer (Varian, Palo Alto, CA) with a resonance frequency of 500 MHz for 1H and 125.7 MHz for 13C and using tetramethylsilane as a reference. Elemental analyses were performed by Columbia Analytical Services (Tucson, AZ).
Proteins
Recombinant Nef (strain SF2) and deuterium-labeled Nef (d-Nef, also strain SF2) were prepared in Escherichia coli as previously reported (40). A pET-14b vector containing codon-optimized SF2 Nef with an N-terminal 6-histidine tag (35) was used to transform BL21(DE3)pLysS cells. Additional details are provided in the Supporting Material. The average mass of d-Nef was 27,116 Da by mass spectrometry, compared with 26,074 Da for h-Nef. This difference of ∼1042 Da indicates that ∼80% of the nonlabile hydrogens were replaced by deuterium in d-Nef.
The calculated SLD is 2.0 × 10⁻⁶ Å−2 for fully protonated Nef, and 3.42 × 10⁻⁶ Å−2 for Nef with all nonlabile hydrogens replaced by deuterium. A value of 3.14 × 10⁻⁶ Å−2 was used for the d-Nef sample, corresponding to 80% substitution of D for H.
Adsorption studies
In a typical adsorption run, a mixture of DSIDA and DPPC was spread from a chloroform solution in the form of a monolayer to a surface pressure of 8–12 mN/m on the surface of Tris-buffered subphase (pH 8.2) held within a Teflon trough. After allowing the chlorofom to evaporate, the surface layer was compressed to 30 mN/m and then CuCl2 was added to the subphase at 10 μM using a peristaltic pump and Teflon tubing with an inlet and outlet submerged at opposite ends of the trough. All tubing and fittings were made of Teflon. After collecting NR data for the lipid monolayer alone, the excess CuCl2 was flushed out of the subphase by pumping fresh solution into one end of the trough while simultaneously removing solution from the opposite end of the trough at the same rate. Exchanging the subphase had no detectable effect on the lipid monolayer (reflectivity unchanged). d-Nef was then introduced into the subphase. The desired amount of protein solution was first injected just behind the barrier and then circulated at least twice to achieve complete mixing. A reflectivity scan was then initiated. Further manipulations, such as subphase exchange, were then performed as described in the Results section. To minimize the amount of protein needed, a small Teflon trough (∼23 ml, including the tubing) was used. The trough was maintained at 20 ± 2°C.
Neutron and x-ray reflection
Neutron reflectivity studies were performed on the NG7 (National Institute for Standards and Technology Center for Neutron Research (NCNR/NIST), Gaithersburg, MD) and SPEAR (Lujan Neutron Scattering Center of the Los Alamos Neutron Science Center, Los Alamos, NM) reflectometers. Details of these spectrometers and the measurement protocols are given in the Supporting Material. X-ray reflectivity (XR) was used to determine the characteristics of the lipid monolayers, as XR data were obtained to much higher qz values (0.5 Å−1) than the NR data (0.23 Å−1), resulting in higher spatial resolution. However, due to much weaker contrast between proteins and water with x-rays, little effect of layers of amorphous protein can be detected beyond ∼0.1 Å−1, even at high coverage. XR measurements of Langmuir monolayers of the lipid mixtures were performed using an x-ray reflectometer (D8 Advance, Bruker, Billerica, MA) employing Cu Kα radiation at NIST. The data were used to constrain the thicknesses of the lipid tail and headgroup layers in the fits to the NR data.
NR and XR data were analyzed using the Ga_refl program based on the optical matrix method. Ga_refl is available at www.ncnr.nist.gov. Simultaneous fits of the NR data were performed for multiple data sets involving different contrast conditions and for multiple data sets at different stages of a single adsorption run (for example, lipids only, lipids with adsorbed protein, and after subphase exchange). Simultaneous analysis allowed particular characteristics to be maintained constant for all the fits, such as the SLD of the subphase and specific characteristics of the lipid layers. In all cases, the fits included only the minimum number of layers for the protein that were required to achieve a good fit to the data. In the Ga_refl program, the roughness parameter is the full width at half-maximum (equal to 2.35 σ, where σ is the standard deviation) of a Gaussian distribution and was constrained in the fitting to be less than the smallest thickness of the two adjacent layers.
Fitting reflectivity data results in defining a family of SLD curves that are consistent with the data. The uncertainty in the fitted profiles was determined by a Monte Carlo resampling procedure in which a large number (1000) of statistically independent sets of reflectivity data were created from the original data set and the error bars from the counting statistics. Each set of reflectivity data was analyzed using the fitting procedure described above. The result is a range of values for each fit parameter that is consistent with the statistics of the original data. The fit of each reflectivity set was initiated with random values for the fit parameters. This method has been reported in detail elsewhere (41).
Generation of molecular structures of Nef for reflectivity calculations
The conformational flexibility of Nef was modeled using the SASSIE software package developed at NIST (www.smallangles.net/sassie). SASSIE employs the Metropolis Monte Carlo algorithm (42) and the CHARMM22 force field (43,44) to sample backbone dihedral conformations. Coordinates for the N-terminal leader peptide (GSSHHHHHHSSGLVPRKHGGKWSK) were generated via simulated annealing (100 cycles at 1400 K for 100 ps followed by 100-ps equilibration at 300 K) using the CHARMM molecular mechanics software. The full NEF model was generated by overlapping and attaching the leader peptide to the coordinates previously determined by NMR of the N-terminus (1QA5) (23) and core domain (2NEF) (30) of the Nef protein. All 40 structures from the 2NEF file were used to generate 40 independent structures that were then used to generate the ensemble of conformations using SASSIE. The models were then minimized by steepest descent in an implicit solvent environment and the resulting structures were used for conformational sampling. Approximately 10,000 independent conformations of the N-terminal arm were generated by SASSIE. Ensembles were generated by allowing dihedral angles to vary in three regions: 1), between helix 2 and the core domain (amino acids 61–89); 2), between helix 1 and helix 2 (amino acids 42–53); and 3), between the histidine repeat and helix 1 (amino acids 11–33). The numbering above includes the addition of the N-terminal leader peptide, which adds 19 amino acids to the natural Nef protein.
SLD profiles for the protein structures were determined by calculating the molecular volume and scattering-length profile for each structure. The solvent-excluded volume was calculated via a rolling-ball algorithm (45) using a solvent probe of 1.4 Å and the Connolly van der Waals radius for protein atoms (46). The profile of the neutron scattering length was determined by dividing the protein into a series of 0.5-Å slices in the xy plane and averaging the scattering contributions for the atoms in each slice.
Results
Characteristics of the lipid layers from XR data
As illustrated in Fig. 1, the lengths of the tails and the headgroup regions are different for DPPC and DSIDA, and therefore, in modeling the reflectivity data for the mixed monolayers, each region was divided into two layers. XR for pure DPPC monolayers indicated thicknesses of 17 Å for the tails and 8 Å for the headgroups (both measured perpendicular to the interface), consistent with calculated lengths. For pure DSIDA monolayers, XR indicated 22 Å for the tails, 7.5 Å for the polyethylene glycol portion, and 8 Å for the headgroups, also consistent with calculated lengths. XR data for a 65% DSIDA + 35% DPPC mixed lipid monolayer were consistent with these values. When fitting the NR data, the lipid membrane was modeled by four layers with thicknesses fixed at the following values determined by the XR data: 5.5 ± 0.5 Å and 17 Å ± 1 Å (tails) and 8 Å ± 1 Å and 8 Å ± 1 Å (headgroups). This variability in thickness is sufficient to allow for the observed small increase in area/molecule discussed below.
NR studies involving d-Nef
Manipulating the contrast between various components is integral to neutron-scattering approaches. For organic materials, this is readily accomplished using the very different neutron-scattering properties of hydrogen and deuterium. In this work, we used deuterated lipids, deuterated protein, and a protonated subphase to achieve both high resolution and strong contrast for the protein. Increasing the fraction of d-lipids increases the reflectivity and extends the range of momentum transfer vector, qz, for which a detectable reflected intensity is observed above the background. This increases the spatial resolution of the data. However, increasing the fraction of d-lipids also results in a weaker change in the data upon adsorption of protein. Nevertheless, with d-Nef, the effect of adsorption was substantial out to the highest values of qz accessible on the NG7 and SPEAR reflectometers.
Our initial NR measurements of 6His-d-Nef bound to lipid membranes from solution at 0.5 μM revealed the presence of two layers: an ∼40-Å dense layer immediately adjacent to the lipid headgroups followed by a second layer that was substantially more dilute (Fig. S1 in the Supporting Material). The second layer was not present upon first adsorption, but developed over time (Fig. S2, a and b). In the course of this work, we discovered that the second layer could be largely eliminated by one of three methods. It could be removed after formation by flushing the subphase with a buffer containing the reducing agent β-mercaptoethanol. Alternatively, adsorption of the second layer could be largely avoided by arresting adsorption at an early stage or by reducing the bulk concentration of d-Nef (see details in Fig. S4, Fig. S5, Fig. S6, and Fig. S7). Prior work has shown that Nef oligomerizes under certain circumstances and its multimeric state may be important for its activities in vivo. In vitro, free Nef is known to aggregate into oligomers in the absence of the myr group (29,30,34). Recently, it has been reported that dimerization of Nef transfected into human cell lines is critical for downregulation of CD4 receptors (47,48). However, for this initial study, we chose to study the conformation of Nef in the absence of multilayer formation (note that oligomerization in the plane of the membrane cannot be detected by NR).
Fig. 2 a shows NR data obtained under conditions that resulted in nearly complete elimination of the second layer. This was accomplished by flushing the subphase with Tris buffer to halt adsorption after a short period. Fig. 2 a shows reflectivity data collected after allowing d-Nef to adsorb to a monolayer of 65% d-DSIDA/Cu2+ + 35% d-DPPC for 2.0 h from solution at 0.5 μM, and then flushing the subphase with 50 ml of Tris buffer. The reflectivity data were collected over a period of 6 h after subphase exchange. After the data in Fig. 2 a were collected, the system was flushed with 50 ml of 0.5-mM β-mercaptoethanol followed by 50 ml of buffer and another reflectivity scan was made. No change in the data was detected (Fig. S8). The profiles with uncertainty limits from simultaneous fits to the data in Fig. 2 a before and after adsorption of d-Nef are shown in Fig. 2 b. The profiles for the lipids alone are denoted by a cyan/blue/pink color scheme, and the profiles with d-Nef are denoted by a black/red/yellow color scheme. The model-independent profile of d-Nef is comprised of an ∼40-Å layer, dense in residues, that is directly adjacent to the lipid headgroups followed by a very slight tail extending into the subphase. The dense layer is asymmetric, with the maximum skewed toward the membrane. The qualitative shape and dimensions of this layer were consistent for repeated runs (Fig. S4, Fig. S5, Fig. S6, and Fig. S7). On the other hand, the prominence of the tail in the profile varied somewhat between runs, and in some cases it was entirely absent. We believe that the tail is due to a small amount of the second layer that, in some cases, was not entirely removed by subphase exchange. The profiles also show that the SLD of the lipid headgroup region increases upon adsorption due to the insertion of d-Nef residues into the lipid headgroups. This is consistent with the fact that, for the conditions in effect here, adsorption of 6His-d-Nef to DSIDA-containing monolayers is always accompanied by an increase of ∼5% in the area/molecule. An example is shown in Fig. 3.
Figure 2.
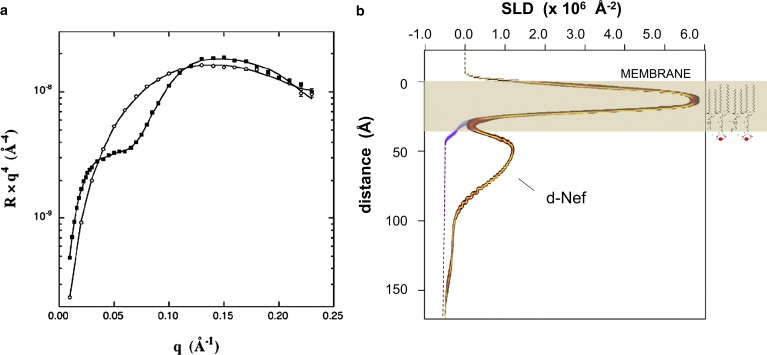
(a) NR data for a 65% d-DSIDA/Cu2+ + 35% d-DPPC monolayer alone (○) and with bound 6His-d-Nef (■) adsorbed from solution at 0.5 μM. Adsorption was arrested after 2.0 h by exchanging the subphase with pure Tris buffer. (b) SLD profiles corresponding to the data in a, with uncertainty limits determined from a Monte Carlo resampling procedure (41). The profiles for the lipids alone are denoted by a cyan/blue/pink color scheme, and the profiles with d-Nef are denoted by a black/red/yellow color scheme.
Figure 3.
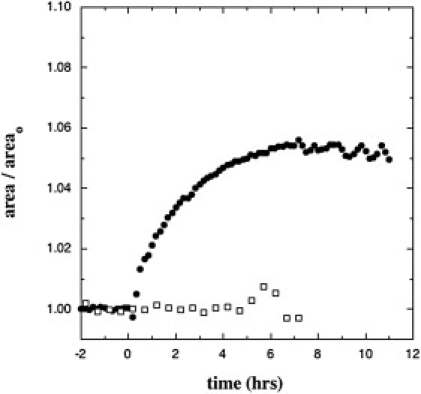
Change in area upon adsorption of 6His-d-Nef to a monolayer of 35% DPPC + 65% DSIDA/Cu2+ with no reducing agent present (●) and with 5 mM DTT in the buffer (□). In each case, time 0 corresponds to the time at which adsorption was first detected in the reflectivity data.
To interpret the data in terms of molecular structures, we calculated the reflectivity for the Geyer and Peterlin model (17) fully extended from the lipid membrane, as illustrated in Fig. 1, and also for an ensemble of forms generated by molecular simulation with energy minimization (see Materials and Methods). The calculated reflectivity for the extended conformation is compared with the experimental data in Fig. 4 a. The SLD profile for this conformation is shown in Fig. 4 b along with the profile from Fig. 2 b derived from the model-independent fitting. The calculation corresponds to a surface density of 4.3 × 10⁻⁴ d-Nef molecules/Å2, and the profile was smeared to a resolution of 10 Å. The open form fully extended from the membrane results in a reflectivity curve that is very different and easily distinguishable from that measured experimentally.
Figure 4.
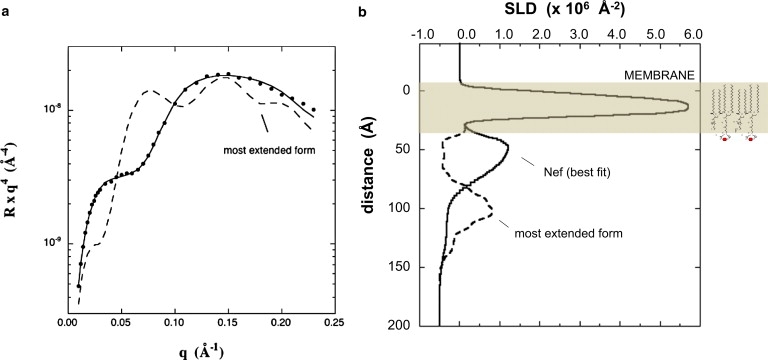
(a) The NR curve resulting from the extended form of Nef in Fig. 1 (dashed line) along with the experimental data and best fit (solid line with symbols). (b) SLD profile calculated for the extended form of Nef smeared to 10 Å resolution along with the best-fit profile.
Fig. 5 shows the heavy-atom distributions from the ensemble of conformations generated by SASSIE, where the conformations have been grouped according to the distance between the center of the globular domain and the center of the His tag (Dglob-His). The two fixed His and several adjacent residues have reduced structural variability, and these generate a cluster of density that results in a hump in the profile near 0 Å. All the conformations that were found to give good agreement with the experimental profile are in the group Dglob-His = 10–20 Å. The thickness of the core domain is ∼30 Å, so the core domain lies directly against the lipid headgroups when Dglob-His = 15 Å. Several representative conformations from the entire ensemble that give good agreement with the experimental data are shown in Fig. 6 a. The reflectivity calculated from the upper left conformation in Fig. 6 a is compared with the experimental data in Fig. 6 b, and the SLD profiles are compared in Fig. 6 c. This conformation reproduces the position of the maximum, the asymmetry, and the breadth of the SLD profile very well. The other conformations in Fig. 6 a show comparable agreement with the experimental profile. The position of the maximum reflects the close proximity of the core domain to the lipid headgroups. Best agreement is obtained at a coverage of ∼5.6 × 10⁻⁴ molecules Å−2, which we estimate to be ∼60% of a completed monolayer.
Figure 5.
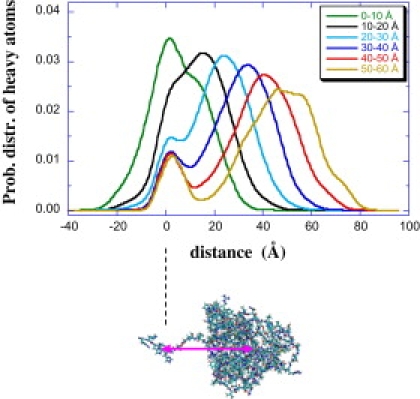
Heavy atom distributions for subpopulations of simulated conformations binned according to the distance between the center of the globular domain and the center of the 6His tag. The center of the His tag is at 0 Å.
Figure 6.
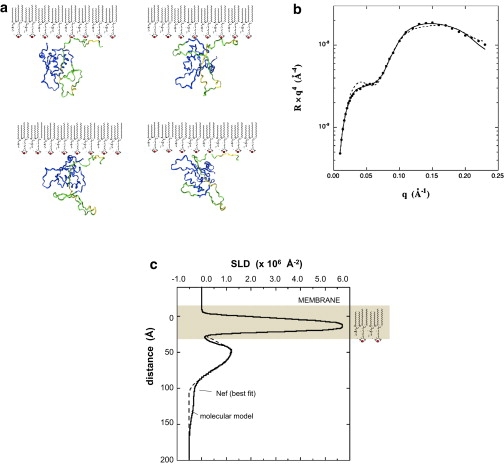
(a) Four conformations yielding good agreement with the experimental data from the ensemble of simulated structures. These conformations are representative of the small fraction of solutions that could be found to match the experimental data. The core domain is shown in blue, the flexible regions in green, and the rigid regions, including the His tag, in yellow. (b) The dashed line shows the calculated NR curve resulting from the conformation shown at upper left in a along with the experimental data and the best fit. (c) Calculated SLD profile from the conformation in a compared with the best-fit profile. The calculated profile was smeared to 10 Å resolution. The other conformations in a show comparable agreement with the experimental data. The difference in the calculated and experimental reflectivity curves at qz = 0.04 Å−1 in b is due to the presence of a weak tail in the experimental profile.
The combination of asymmetry and breadth of the main peak in the Nef profile does not occur for the vast majority (∼99%) of the conformations in the generated ensemble. This is shown in Fig. S9, which displays the average SLD profile for conformations with distances of 10–20 Å between the center of the globular domain and center of the His tag (the band that best reproduces the peak position in the experimental profile). The fact that the asymmetry and breadth of the peak does not occur for the vast majority of the conformations, combined with the fact that the breadth and asymmetry of the main peak of the experimental profile are reproducible (cf. Fig. 6, Fig. S4 b, and Fig. S5 b), suggests that membrane-bound Nef exists in a narrow distribution of conformations. A narrow distribution of membrane-bound conformations could result from the interaction of specific residues with the membrane, discussed below, along with the fact that the protein is densely packed below the monolayer. Fig. 6 shows that among the small number of conformations that reproduce the asymmetry and breadth of the peak there remain different combinations of core-domain orientation, flexible loop extension, and N-terminal arm configuration. Further experimental constraints are needed to distinguish among the possible conformations.
An adsorption study was also performed with 5 mM DTT in the buffer from the start, in contrast to the other cases in which a reducing agent was only used during a rapid exchange of the subphase followed immediately by another exchange with buffer lacking a reducing agent. With DTT present from the start, Cu2+ ions were reduced to Cu+, which eliminated specific interaction of Nef with the membrane through the His tag. The resulting weak binding was likely due to electrostatic interactions between Nef and the partially negatively charged DSIDA/Cu+. Binding of 6His-Nef at 0.5 μM to 65% DSIDA/Cu+ + 35% DPPC occurred only after 7 h, with the coverage much lower than that shown in Fig. 2 a, and the area/molecule data showed no evidence of insertion of residues into the membrane as shown in Fig. 3. The NR data are given in Fig. S10). Protonated lipids were used to increase sensitivity to the protein and enable detection of the low level of Nef adsorption. This limited the range of qz to 0.10 Å−1 and consequently, few details of the profile could be determined beyond the thickness. In this case, the adsorbed layer of Nef was entirely removed upon flushing the subphase with buffer.
Discussion
Nef is believed to bind to lipid membranes through a bipartite interaction involving an N-terminal myristate group and a basic cluster of residues (Arg17, Arg19, Arg21, and Arg22 in the native sequence) (26). In previous work, mutation of Arg17, Arg19, Arg21, and Arg22 or the hydrophobic residues Trp5 and Trp13 sharply reduced Nef binding to 70/30 POPC/POPG membranes (22), and deletion of the N-terminal arm abolished binding altogether (22,27). In this study we examined the conformation of Nef upon binding to lipid membranes through a specific interaction with the N-terminus using a His tag and a synthetic metal-ion chelating lipid. This system models the case in which the N-terminus binds specifically to the lipid membrane and does not associate with the core domain. For this case, the core domain lies directly against the lipid headgroups, and there is clear evidence from both the NR data and the area/molecule data of insertion of residues into the membrane. A fully extended structure with the core domain displaced from the membrane (Fig. 1) can be ruled out. A number of more compact forms (Fig. 6) are more consistent with the NR data and resemble the forms hypothesized by Arold and Baur (13) but with the core domain directly against the lipid headgroups.
Although the detailed conformation of the N-terminal arm cannot be resolved from the NR data alone, evidence from this study in combination with prior data suggests that a portion of the N-terminal arm inserts into the lipid headgroups. The increase in area/molecule observed upon membrane binding of 6His-d-Nef through the His tag provides direct evidence of insertion of residues. In our previous work, the binding of another His-tagged protein to DSIDA/Cu2+-containing membranes did not result in an increase in area/molecule (Fig. S11). This strongly suggests that the area increase in this case is not due to the binding of the His tag directly but rather to insertion of other residues. Prior work by others has demonstrated that Nef interacts with membranes through residues on the N-terminal arm (22). It has been pointed out that a significant sequence similarity exists between residues 3–26 of the N-terminal arm of wild-type Nef and melittin, a membrane-active helical peptide (28). Melittin readily inserts into Langmuir monolayers of DPPC, resulting in a large area increase (Fig. S12). Furthermore, the helical content of a peptide of residues 2–27 of the N-terminal arm has been shown to increase upon binding to 70/30 POPC/POPG membranes (22). Together, this evidence strongly suggests that in this system, a portion of the N-terminal arm of 6His-Nef inserts upon binding through the N-terminal His tag. We suggest that insertion of a portion of the N-terminal arm positions the core domain directly against the lipid headgroups, as shown in Fig. 2. Since no insertion occurred when Nef bound to the membrane through weak electrostatic interactions in the absence of a specific interaction through the N-terminus, we propose that binding of the N-terminal His tag to the membrane in some way facilitates insertion.
Gerlach et al. provided evidence for a two-step process in the interaction of myr-Nef with DOPC/DOPG liposomes in time-resolved fluorescence measurements (22). They proposed that myr-Nef initially binds to the membrane through electrostatic interactions involving the cluster of basic residues on the N-terminal arm and also insertion of the myr group. Adsorption is then followed by insertion of the N-terminal arm and formation of an amphipathic helix. We suggest that the data for 6His-d-Nef binding to DSIDA/Cu2+ (Fig. 2) corresponds to the final state with N-terminus bound and arm inserted. In light of the observed absence of insertion, binding of 6×His-d-Nef to DSIDA/Cu+ through weak electrostatic interactions may resemble the initial adsorption stage proposed by Gerlach et al. (22). However, we note that the extent of insertion of the N-terminal arm may depend upon many factors, such as membrane composition, surface pressure, and mode of binding, and this issue will be studied in more detail in future work.
Conclusions
To our knowledge,this work provides the first structural data for membrane-associated Nef. The conformation of Nef was probed upon binding to Langmuir monolayers, through specific interaction of an N-terminal His tag with a synthetic metal-chelating lipid, under physiological buffer conditions. Both good resolution and a strong neutron-scattering signal were achieved with the use of deuterated lipids and d-Nef against an H2O subphase. The reflectivity data and area/molecule data both indicated insertion of residues into the membrane upon binding through the N-terminal His tag. When interpreted in light of prior studies, this strongly suggests that a portion of the N-terminal arm inserts into the membrane. Binding of Nef to the same membrane also occurred at a much lower level in the absence of interaction through the His tag, but in that case, no insertion of residues into the membrane was detected. We conclude that binding through the N-terminus contributes to N-terminal arm insertion. Upon binding through the N-terminus and insertion, the core domain of Nef is located directly against the lipid headgroups and forms a layer ∼40 Å thick.
Acknowledgments
Sandia is a multiprogram laboratory operated by Sandia Corp., a Lockheed Martin Company, for the United States Department of Energy under contract DE-AC04-94AL85000. We thank Frank Henrich for providing the code used to perform the Monte Carlo resampling procedure in the data analysis. We acknowledge the support of the National Institute of Standards and Technology, U.S. Department of Commerce, in providing the neutron research facilities used in this work. This work is contribution 947 from the Barnett Institute.
This work also benefited from the use of the Lujan Neutron Scattering Center at Los Alamos Neutron Science Center funded by the Department of Energy Office of Basic Energy Sciences and Los Alamos National Laboratory under Department of Energy contract DE-AC52-06NA25396. The work was partially supported by National Institutes of Health grants R01-GM070590 and R01-GM086507 (to J.R.E.).
Supporting Material
References
- 1.Bour S., Strebel K. HIV accessory proteins: multifunctional components of a complex system. Adv. Pharmacol. 2000;48:75–120. doi: 10.1016/s1054-3589(00)48004-x. [DOI] [PubMed] [Google Scholar]
- 2.Frankel A.D., Young J.A. HIV-1: fifteen proteins and an RNA. Annu. Rev. Biochem. 1998;67:1–25. doi: 10.1146/annurev.biochem.67.1.1. [DOI] [PubMed] [Google Scholar]
- 3.Klotman M.E., Kim S., Wong-Staal F. Kinetics of expression of multiply spliced RNA in early human immunodeficiency virus type 1 infection of lymphocytes and monocytes. Proc. Natl. Acad. Sci. USA. 1991;88:5011–5015. doi: 10.1073/pnas.88.11.5011. [DOI] [PMC free article] [PubMed] [Google Scholar]
- 4.Goldsmith M.A., Warmerdam M.T., Greene W.C. Dissociation of the CD4 downregulation and viral infectivity enhancement functions of human immunodeficiency virus type 1 Nef. J. Virol. 1995;69:4112–4121. doi: 10.1128/jvi.69.7.4112-4121.1995. [DOI] [PMC free article] [PubMed] [Google Scholar]
- 5.Baur A. Functions of the HIV-1 Nef protein. Curr. Drug Targets Immune Endocr. Metabol. Disord. 2004;4:309–313. doi: 10.2174/1568008043339749. [DOI] [PubMed] [Google Scholar]
- 6.Das S.R., Jameel S. Biology of the HIV Nef protein. Indian J. Med. Res. 2005;121:315–332. [PubMed] [Google Scholar]
- 7.Kestler H.W., 3rd, Ringler D.J., Desrosiers R.C. Importance of the nef gene for maintenance of high virus loads and for development of AIDS. Cell. 1991;65:651–662. doi: 10.1016/0092-8674(91)90097-i. [DOI] [PubMed] [Google Scholar]
- 8.Hanna Z., Kay D.G., Jolicoeur P. Transgenic mice expressing human immunodeficiency virus type 1 in immune cells develop a severe AIDS-like disease. J. Virol. 1998;72:121–132. doi: 10.1128/jvi.72.1.121-132.1998. [DOI] [PMC free article] [PubMed] [Google Scholar]
- 9.Hanna Z., Kay D.G., Jolicoeur P. Nef harbors a major determinant of pathogenicity for an AIDS-like disease induced by HIV-1 in transgenic mice. Cell. 1998;95:163–175. doi: 10.1016/s0092-8674(00)81748-1. [DOI] [PubMed] [Google Scholar]
- 10.Simard M.C., Chrobak P., Jolicoeur P. Expression of simian immunodeficiency virus nef in immune cells of transgenic mice leads to a severe AIDS-like disease. J. Virol. 2002;76:3981–3995. doi: 10.1128/JVI.76.8.3981-3995.2002. [DOI] [PMC free article] [PubMed] [Google Scholar]
- 11.Gorry P.R., McPhee D.A., Churchill M.J. Pathogenicity and immunogenicity of attenuated, nef-deleted HIV-1 strains in vivo. Retrovirology. 2007;4:66. doi: 10.1186/1742-4690-4-66. [DOI] [PMC free article] [PubMed] [Google Scholar]
- 12.Churchill M.J., Rhodes D.I., Gorry P.R. Longitudinal analysis of human immunodeficiency virus type 1 nef/long terminal repeat sequences in a cohort of long-term survivors infected from a single source. J. Virol. 2006;80:1047–1052. doi: 10.1128/JVI.80.2.1047-1052.2006. [DOI] [PMC free article] [PubMed] [Google Scholar]
- 13.Arold S.T., Baur A.S. Dynamic Nef and Nef dynamics: how structure could explain the complex activities of this small HIV protein. Trends Biochem. Sci. 2001;26:356–363. doi: 10.1016/s0968-0004(01)01846-1. [DOI] [PubMed] [Google Scholar]
- 14.Peterlin B.M., Trono D. Hide, shield and strike back: how HIV-infected cells avoid immune eradication. Nat. Rev. Immunol. 2003;3:97–107. doi: 10.1038/nri998. [DOI] [PubMed] [Google Scholar]
- 15.Joseph A.M., Kumar M., Mitra D. Nef: “necessary and enforcing factor” in HIV infection. Curr. HIV Res. 2005;3:87–94. doi: 10.2174/1570162052773013. [DOI] [PubMed] [Google Scholar]
- 16.Raney A., Shaw A.Y., Garcia J.V. Structural constraints on human immunodeficiency virus type 1 Nef function. Virology. 2007;368:7–16. doi: 10.1016/j.virol.2007.02.036. [DOI] [PMC free article] [PubMed] [Google Scholar]
- 17.Geyer M., Peterlin B.M. Domain assembly, surface accessibility and sequence conservation in full length HIV-1 Nef. FEBS Lett. 2001;496:91–95. doi: 10.1016/s0014-5793(01)02394-8. [DOI] [PubMed] [Google Scholar]
- 18.Coates K., Cooke S.J., Harris M.P. Protein kinase C-mediated phosphorylation of HIV-I nef in human cell lines. J. Biol. Chem. 1997;272:12289–12294. doi: 10.1074/jbc.272.19.12289. [DOI] [PubMed] [Google Scholar]
- 19.Bentham M., Mazaleyrat S., Harris M. Role of myristoylation and N-terminal basic residues in membrane association of the human immunodeficiency virus type 1 Nef protein. J. Gen. Virol. 2006;87:563–571. doi: 10.1099/vir.0.81200-0. [DOI] [PubMed] [Google Scholar]
- 20.Harris M. The role of myristoylation in the interactions between human immunodeficiency virus type I Nef and cellular proteins. Biochem. Soc. Trans. 1995;23:557–561. doi: 10.1042/bst0230557. [DOI] [PubMed] [Google Scholar]
- 21.Curtain C.C., Lowe M.G., Azad A.A. Structural requirements for the cytotoxicity of the N-terminal region of HIV type 1 Nef. AIDS Res. Hum. Retroviruses. 1998;14:1543–1551. doi: 10.1089/aid.1998.14.1543. [DOI] [PubMed] [Google Scholar]
- 22.Gerlach H., Laumann V., Geyer M. HIV-1 Nef membrane association depends on charge, curvature, composition and sequence. Nat. Chem. Biol. 2010;6:46–53. doi: 10.1038/nchembio.268. [DOI] [PubMed] [Google Scholar]
- 23.Geyer M., Munte C.E., Kalbitzer H.R. Structure of the anchor-domain of myristoylated and non-myristoylated HIV-1 Nef protein. J. Mol. Biol. 1999;289:123–138. doi: 10.1006/jmbi.1999.2740. [DOI] [PubMed] [Google Scholar]
- 24.Peng B., Robert-Guroff M. Deletion of N-terminal myristoylation site of HIV Nef abrogates both MHC-1 and CD4 down-regulation. Immunol. Lett. 2001;78:195–200. doi: 10.1016/s0165-2478(01)00250-4. [DOI] [PubMed] [Google Scholar]
- 25.Hanna Z., Priceputu E., Jolicoeur P. In vivo mutational analysis of the N-terminal region of HIV-1 Nef reveals critical motifs for the development of an AIDS-like disease in CD4C/HIV transgenic mice. Virology. 2004;327:273–286. doi: 10.1016/j.virol.2004.06.028. [DOI] [PubMed] [Google Scholar]
- 26.Welker R., Harris M., Kräusslich H.G. Virion incorporation of human immunodeficiency virus type 1 Nef is mediated by a bipartite membrane-targeting signal: analysis of its role in enhancement of viral infectivity. J. Virol. 1998;72:8833–8840. doi: 10.1128/jvi.72.11.8833-8840.1998. [DOI] [PMC free article] [PubMed] [Google Scholar]
- 27.Curtain C.C., Separovic F., Azad A.A. Fusogenic activity of amino-terminal region of HIV type 1 Nef protein. AIDS Res. Hum. Retroviruses. 1994;10:1231–1240. doi: 10.1089/aid.1994.10.1231. [DOI] [PubMed] [Google Scholar]
- 28.Szilluweit R., Boll A., Steinem C. HIV-1 Nef perturbs artificial membranes: investigation of the contribution of the myristoyl anchor. Biophys. J. 2009;96:3242–3250. doi: 10.1016/j.bpj.2008.12.3947. [DOI] [PMC free article] [PubMed] [Google Scholar]
- 29.Grzesiek S., Bax A., Wingfield P.T. The solution structure of HIV-1 Nef reveals an unexpected fold and permits delineation of the binding surface for the SH3 domain of Hck tyrosine protein kinase. Nat. Struct. Biol. 1996;3:340–345. doi: 10.1038/nsb0496-340. [DOI] [PubMed] [Google Scholar]
- 30.Grzesiek S., Bax A., Wingfield P.T. Refined solution structure and backbone dynamics of HIV-1 Nef. Protein Sci. 1997;6:1248–1263. doi: 10.1002/pro.5560060613. [DOI] [PMC free article] [PubMed] [Google Scholar]
- 31.Lee C.-H., Saksela K., Kuriyan J. Crystal structure of the conserved core of HIV-1 Nef complexed with a Src family SH3 domain. Cell. 1996;85:931–942. doi: 10.1016/s0092-8674(00)81276-3. [DOI] [PubMed] [Google Scholar]
- 32.Arold S., Franken P., Dumas C. The crystal structure of HIV-1 Nef protein bound to the Fyn kinase SH3 domain suggests a role for this complex in altered T cell receptor signaling. Structure. 1997;5:1361–1372. doi: 10.1016/s0969-2126(97)00286-4. [DOI] [PubMed] [Google Scholar]
- 33.Hochrein J.M., Wales T.E., Engen J.R. Conformational features of the full-length HIV and SIV Nef proteins determined by mass spectrometry. Biochemistry. 2006;45:7733–7739. doi: 10.1021/bi060438x. [DOI] [PubMed] [Google Scholar]
- 34.Dennis C.A., Baron A., Jaeger J. Co-translational myristoylation alters the quaternary structure of HIV-1 Nef in solution. Proteins. 2005;60:658–669. doi: 10.1002/prot.20544. [DOI] [PubMed] [Google Scholar]
- 35.Breuer S., Gerlach H., Geyer M. Biochemical indication for myristoylation-dependent conformational changes in HIV-1 Nef. Biochemistry. 2006;45:2339–2349. doi: 10.1021/bi052052c. [DOI] [PubMed] [Google Scholar]
- 36.McLaughlin S., Aderem A. The myristoyl-electrostatic switch: a modulator of reversible protein-membrane interactions. Trends Biochem. Sci. 1995;20:272–276. doi: 10.1016/s0968-0004(00)89042-8. [DOI] [PubMed] [Google Scholar]
- 37.Hoffmann S., Jonas E., Willbold D. Nef protein of human immunodeficiency virus type 1 binds its own myristoylated N-terminus. Biol. Chem. 2007;388:181–183. doi: 10.1515/BC.2007.020. [DOI] [PubMed] [Google Scholar]
- 38.Penfold J., Thomas R. The application of the specular reflection of neutrons to the study of surfaces and interfaces. J. Phys. Condens. Matter. 1990;2:1369–1412. [Google Scholar]
- 39.Ng K., Pack D.W., Arnold F.H. Engineering protein-lipid interactions: targeting of histidine-tagged proteins to metal-chelating lipid monolayers. Langmuir. 1995;11:4048–4055. [Google Scholar]
- 40.Trible R.P., Emert-Sedlak L., Smithgall T.E. Allosteric loss-of-function mutations in HIV-1 Nef from a long-term non-progressor. J. Mol. Biol. 2007;374:121–129. doi: 10.1016/j.jmb.2007.09.009. [DOI] [PMC free article] [PubMed] [Google Scholar]
- 41.Heinrich F., Ng T., Lösche M. A new lipid anchor for sparsely tethered bilayer lipid membranes. Langmuir. 2009;25:4219–4229. doi: 10.1021/la8033275. [DOI] [PubMed] [Google Scholar]
- 42.Metropolis N., Rosenbluth A.W., Teller E. Equation of state calculations by fast computing machines. J. Chem. Phys. 1953;21:1087–1092. [Google Scholar]
- 43.Mackerell A.D.J., Brooks B., Karplus M. CHARMM: The energy function and its parameterization with an overview of the program. In: Schleyer P.v.R., editor. The Encyclopedia of Computational Chemistry. John Wiley & Sons; Chichester, United Kingdom: 1998. pp. 271–277. [Google Scholar]
- 44.MacKerell A.D., Bashford D., Karplus M. All-atom empirical potential for molecular modeling and dynamics studies of proteins. J. Phys. Chem. B. 1998;102:3586–3616. doi: 10.1021/jp973084f. [DOI] [PubMed] [Google Scholar]
- 45.Lee B., Richards F.M. The interpretation of protein structures: estimation of static accessibility. J. Mol. Biol. 1971;55:379–400. doi: 10.1016/0022-2836(71)90324-x. [DOI] [PubMed] [Google Scholar]
- 46.Connolly M.L. Solvent-accessible surfaces of proteins and nucleic acids. Science. 1983;221:709–713. doi: 10.1126/science.6879170. [DOI] [PubMed] [Google Scholar]
- 47.Poe J., Smithgall T.E. HIV-1 Nef dimerization is required for Nef-mediated receptor downregulation and viral replication. J. Mol. Biol. 2009;394:329–342. doi: 10.1016/j.jmb.2009.09.047. [DOI] [PMC free article] [PubMed] [Google Scholar]
- 48.Ye H., Choi H.-J., Smithgall T.E. Oligomerization is required for HIV-1 Nef-induced activation of the Src family protein-tyrosine kinase, Hck. Biochemistry. 2004;43:15775–15784. doi: 10.1021/bi048712f. [DOI] [PubMed] [Google Scholar]
Associated Data
This section collects any data citations, data availability statements, or supplementary materials included in this article.