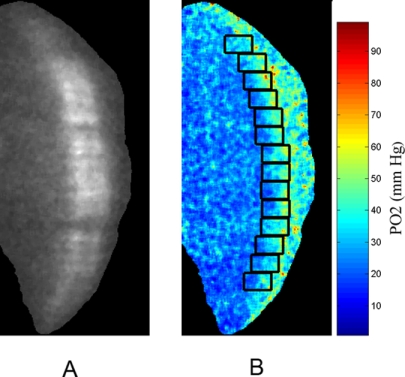
A technique was developed for mapping of retinal tissue oxygen tension that has the potential to provide a better understanding of retinal oxygenation in health and disease.
Abstract
Purpose.
To report an imaging technique for measurement of oxygen tension (PO2) in retinal tissue and establish its feasibility for measuring retinal PO2 variations in rat eyes by adjusting the fraction of inspired oxygen (FiO2).
Methods.
A narrow laser line was projected at an angle on the retina, and phosphorescence emission was imaged after intravitreal injection of an oxygen-sensitive molecular probe. A frequency-domain approach was used for phosphorescence lifetime measurements. Retinal PO2 maps were computed from phosphorescence lifetime images, and oxygen profiles through the retinal depth were derived in rats in conditions of 10%, 21%, and 50% FiO2.
Results.
Retinal PO2 measurements were repeatable, and variations in outer and inner retina PO2 at different locations along the image were not significant (P ≥ 0.3). Maximum outer retinal PO2 obtained in 10%, 21%, and 50% FiO2 were significantly different (P < 0.0001). Maximum outer retinal PO2 correlated with systemic arterial PO2 (R = 0.70; P < 0.0001). The slope of the outer retina PO2 profile correlated with maximum outer retinal PO2 (R = 0.84; P < 0.0001). Mean inner retina PO2 correlated with maximum outer retinal PO2 (R = 0.88; P < 0.0001).
Conclusions.
A technique has been developed for quantitative mapping of retinal tissue oxygen tension with the potential to enable sequential monitoring of retinal oxygenation in health and disease.
Retinal cells demand oxygen and nutrients to maintain normal metabolic function. Abnormalities in retinal oxygenation occur in acute retinal artery embolic disease, retinal vein occlusion, retinopathy of prematurity, and diabetic retinopathy1–8 and are implicated in the development of glaucoma and age-related macular degeneration.9,10 Development of technologies for assessment of retinal oxygenation can advance health care by providing a better understanding of disease pathophysiology and improving treatment outcomes.
Several techniques have been developed for assessment of oxygen delivery to the retinal tissue via choroidal and retinal circulations. Multiwavelength reflectance spectrophotometry measures oxygen saturation of blood,11–15 phosphorescence lifetime imaging measures intravascular oxygen tension (PO2),16–21 and a laser Doppler method measures blood flow.22–24 However, these techniques provide measurements only in the retinal vasculature and therefore are limited for assessment of retinal tissue PO2.
Retinal tissue oxygenation has been evaluated by imaging methods and oxygen-sensitive microelectrodes. Magnetic resonance imaging25–27 provides an indirect measure of retinal tissue PO2, with limited resolution compared with optical techniques. A fluorescence imaging technique28 has been reported for measurement of retinal tissue PO2, but it has limited depth discrimination. Oxygen-sensitive microelectrodes29–35 measure retinal tissue PO2 directly with high-depth resolution. This technique is considered the gold standard, but it is invasive, requiring physical penetration of the tissue.
We have reported an optical imaging system for mapping of PO2 in the retinal vasculature.36–39 In the present study, we report a novel imaging technique for quantitative mapping of PO2 at different depths of retinal tissue of rats. Lateral (along the retinal plane) and axial (through the retinal depth) variations in retinal tissue PO2 were determined in three different fractions of inspired oxygen (FiO2).
Materials and Methods
Animals
Thirteen male Long-Evans pigmented rats (450–650 g) were used. The animals were treated in compliance with the ARVO Statement for the Use of Animals in Ophthalmic and Vision Research. The rats were anesthetized using ketamine (85 mg/kg IP) and xylazine (3.5 mg/kg IP). An oxygen-sensitive molecular probe40,41 (Oxyphor R2; Oxygen Enterprises, Ltd., Philadelphia, PA) was dissolved in saline and 3 μL (0.5 mM) was injected intravitreally. The presence of the probe in the vitreous was confirmed immediately after injection, by imaging the vitreous cavity with a slit lamp biomicroscope to visualize the bolus. The animals were imaged 24 hours after injection, an experimentally determined duration for the probe to diffuse from the vitreous into the retina. For monitoring systemic arterial PO2, a catheter was placed in the femoral artery to obtain blood samples. Blood pressure and heart rate were monitored with a pressure transducer attached to the catheter and linked to a data-acquisition system (Biopac Systems Inc., Goleta, CA). Before imaging, the pupils were dilated with 2.5% phenylephrine and 1% tropicamide. Hydroxypropyl methylcellulose (1%) was applied to the cornea, and a glass coverslip was placed on the cornea to eliminate its refractive power and to prevent corneal dehydration. Normal body temperature was maintained with an animal holder connected to a water heater composed of copper tubing. FiO2 was varied via a high-flow face mask system. Gas mixtures containing 10%, 21% (room air), and 50% oxygen were administered to the rats 10 minutes before and during imaging. Concurrent with imaging, arterial blood was drawn through the catheter without exposure to air, and systemic arterial PO2 was measured with a blood gas analyzer (Radiometer, Westlake, OH). The rat was placed in front of the imaging instrument. The laser power was adjusted to 100 μW at the cornea. Because of pupil size, 40 μW entered the eye, yielding a retinal irradiance of approximately 30 mW/cm2, which is safe for continuous viewing for 3600 seconds, according to the American National Standard Institute for Safety Standards.42 Three images were acquired at each location within 2 disc diameters of the optic nerve head, over a period of approximately 60 seconds. Of the 13 rats, 3 were imaged in all three FiO2 conditions, 5 in two, and 5 in one. In total, in each of the three FiO2 conditions, data from eight rats were available, yielding a total of 24 data points.
Methods
The instrument for optical section phosphorescence imaging has been described.36 Briefly, a narrow, focused, laser line was projected vertically at an angle on the retina, and the phosphorescence of the oxygen-sensitive molecular probe was imaged. Because of the 10° angle between the incident laser and imaging path, an optical section phosphorescence image was acquired by a digital camera. Phosphorescence was imaged by matching the laser wavelength (532 nm) to the excitation wavelength of the molecular probe and placing a filter with transmission overlapping the phosphorescence emission in the imaging path. The phosphorescence lifetime was measured with a frequency-domain approach, as published elsewhere.20,36,43,44 According to the principles of this approach, the laser light and sensitivity of the camera were independently modulated at a frequency of 1600 Hz. The phase between the two modulators was incrementally delayed at 74-μs intervals and a set of 10 optical section phosphorescence images were acquired. The phase-delayed images were analyzed to determine phosphorescence lifetime, which is related to PO2 according to the Stern-Volmer expression: τ0/τ = 1 + (κQ)(τ0)(PO2), where PO2 (mm Hg) is the oxygen tension, τ (in microseconds) is the phosphorescence lifetime, κQ (1/mm Hg μs) is the quenching constant for the triplet-state phosphorescence probe, and τ0 is the lifetime in a zero-oxygen environment.40 A small error in retinal PO2 calculations may be present, since the constants of the Stern-Volmer relation are not known precisely in tissue. A retinal PO2 map was generated by calculating PO2 at each pixel on the image and three repeated PO2 maps were obtained at the same location per eye. In phosphorescence intensity images, a boundary between the retina and vitreous was visible. The location of the boundary on the phosphorescence image coincided with the vitreoretinal interface that was clearly visualized on the reflectance image. The retinal region was isolated by generating a mask by global thresholding of the phosphorescence intensity image with an iterative threshold-selection method.45 The mask assigned a value of 0 to PO2 map pixels with corresponding intensity values below a threshold on the phosphorescence intensity image.
The masked retinal PO2 map was sectioned by contiguous rectangular segments along the image from superior to inferior. Each segment was 20 pixels (100 μm) vertically and spanned the retinal depth. The horizontal position of each segment was established on the basis of the location of the maximum PO2 level in the posterior portion of the retina, corresponding to 100% retinal depth. The number of segments in each PO2 map varied, depending on the vertical extent of the retina that could be visualized. Retinal PO2 maps were sectioned into 13 ± 1 segments (mean ± SD; n = 24). In each segment, a PO2 profile was obtained by vertically integrating pixel values over the segment (20 pixels). The resulting profile displayed PO2 values at 30 retinal depth locations. A total of 13 oxygen profiles were generated from 13 contiguous segments along each retinal PO2 map. The outer and inner retinal areas in an oxygen profile were defined by the region spanning 50% to 100% and <50% of the retinal depth, respectively. An average and SD for the following measures were calculated from oxygen profiles: maximum and minimum outer retina PO2, mean inner retina PO2, and slope of the outer retina PO2 profile between 75% and 100% of the retinal depth.
The reliability of measurements was established in two separate complementary analyses. First, intraclass correlations were calculated between repeated images in each eye on PO2 profiles. Second, the effect of location and repeatability on PO2 measurements was examined by subjecting the data to a two-way analysis of variance (ANOVA), with location and image as between-samples repeated measures. A significant main effect of image suggests differences between the repeated images that would make it difficult to apply the technique reliably. The main effect of location indicates variations at different locations along the image. Interactions between the two (image, location) indicate that measurement variability changes in a systematic manner between repeated images as a function of location. ANOVA was used to compare measurements obtained during 10%, 21%, and 50% FiO2. Linear regression analysis was performed to relate systemic arterial PO2, slope of the outer retina PO2 profile, and mean inner retina PO2 to maximum outer retina PO2. Statistical significance was accepted at P < 0.05.
Results
Blood pressure was 90 ± 15 (mean ± SD), 139 ± 25, and 135 ± 21 mm Hg (significant change at P = 0.0002); heart rate was 257 ± 17, 278 ± 46, and 241 ± 23 beats per minute (P = 0.08); and systemic arterial PO2 measurements were 39 ± 11, 54 ± 7, and 156 ± 40 mm Hg (significantly different at P < 0.0001) with 10%, 21%, and 50% FiO2, respectively.
An example of an optical section phosphorescence image, displaying a cross-sectional view of the retina in a rat during 21% FiO2 is shown in Figure 1A. The phosphorescence from the oxygen probe is visualized distinctly in the retinal tissue. A retinal PO2 map was generated from the phase-delayed optical section phosphorescence images, as shown in Fig. 1B. The locations of contiguous segments along the image are marked by rectangles. Retinal PO2 was highest at the choroidal interface and decreased incrementally through the outer retinal depth. Examples of oxygen profiles derived from retinal PO2 maps generated in 10%, 21%, and 50% FiO2 are shown in Figure 2. Each profile was obtained from a single segment of a retinal PO2 map. Systemic arterial PO2 was 28, 50, and 109 mm Hg for the three profiles derived with 10%, 21%, and 50% FiO2, respectively. In the outer retina, PO2 decreased linearly from a maximum PO2 level in the proximity of the choroid and reached a minimum PO2 at the location corresponding to the photoreceptor cell inner segment, as previously reported.34 In the inner retina, PO2 was relatively constant but displayed spatial variations because of the retinal vascular architecture.34
Figure 1.
(A) An example of a phosphorescence image showing an optical section view through the depth of the retina. (B) Retinal PO2 map generated from phase-delayed phosphorescence images. Color bar represents retinal PO2 in mm Hg. Oxygen profiles were generated along the image at locations denoted by rectangles. The horizontal position of each rectangle was established based on the location of the maximum PO2 in the posterior (right) portion of the retina, corresponding to 100% retinal depth.
Figure 2.
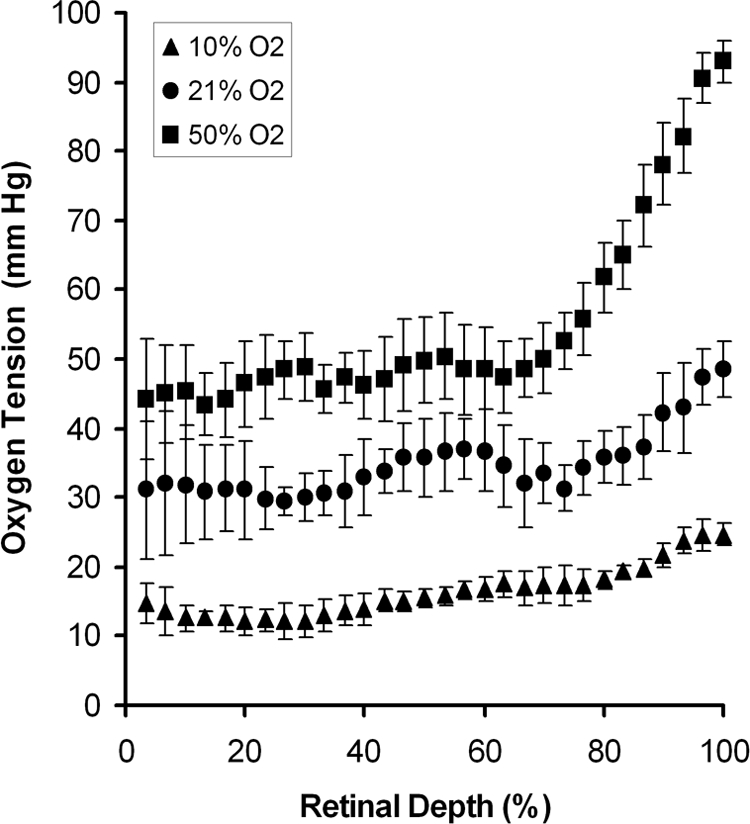
Oxygen profiles derived from retinal PO2 maps generated with 10%, 21%, and 50% FiO2 are shown. Each profile was obtained from a single segment of a retinal PO2 map. Error bars represent standard deviations.
All measures of maximum and minimum outer retina PO2, and mean inner retina PO2 were consistent. Intraclass correlations were greater than 0.94, 0.75, and 0.44 in 10%, 21%, and 50% FiO2 conditions, respectively (P < 0.001). The results of two-way ANOVA analysis for determining the effects of image and location on PO2 measurements are shown in Table 1. There were no significant effects of image, location, or interaction between the two effects on maximum or minimum outer retina PO2 or mean inner retina PO2 with 10%, 21%, or 50% FiO2 (P ≥ 0.3).
Table 1.
Effects of Image (Repeated-Measurement Variability) and Location (Lateral Variations) on Retinal PO2 with 10%, 21%, and 50% FiO2
| FiO2 Effect | Maximum Outer Retina PO2 |
Minimum Outer Retina PO2 |
Mean Inner Retina PO2 |
|||
|---|---|---|---|---|---|---|
| F | P | F | P | F | P | |
| 10% | ||||||
| Image | 0.640 | 0.542 | 0.298 | 0.747 | 0.817 | 0.614 |
| Location | 0.374 | 0.954 | 1.067 | 0.399 | 0.023 | 0.978 |
| Image/location | 0.746 | 0.746 | 0.433 | 0.984 | 1.095 | 0.361 |
| 21% | ||||||
| Image | 0.153 | 0.860 | 0.141 | 0.870 | 0.227 | 0.800 |
| Location | 0.971 | 0.478 | 0.892 | 0.546 | 0.907 | 0.533 |
| Image/location | 0.730 | 0.789 | 0.729 | 0.789 | 0.740 | 0.778 |
| 50% | ||||||
| Image | 0.917 | 0.422 | 0.713 | 0.507 | 1.110 | 0.357 |
| Location | 0.736 | 0.689 | 0.801 | 0.628 | 0.665 | 0.753 |
| Image/location | 1.052 | 0.407 | 0.748 | 0.770 | 1.167 | 0.292 |
Maximum outer retina PO2 measurements obtained with 10%, 21%, and 50% FiO2 were 37 ± 15, 57 ± 20, and 94 ± 23 mm Hg, respectively, and increased significantly with higher FiO2 (P < 0.0001). Maximum outer retina PO2 correlated with systemic arterial PO2 (R = 0.70; P < 0.0001; n = 24). Maximum and minimum outer retina PO2 and mean inner retina PO2 measurements obtained in 10%, 21%, and 50% FiO2 are shown in Figure 3. Mean inner retina and minimum outer retina PO2 measurements were significantly different during the three oxygen breathing conditions (P = 0.001 and P = 0.0003, respectively).
Figure 3.
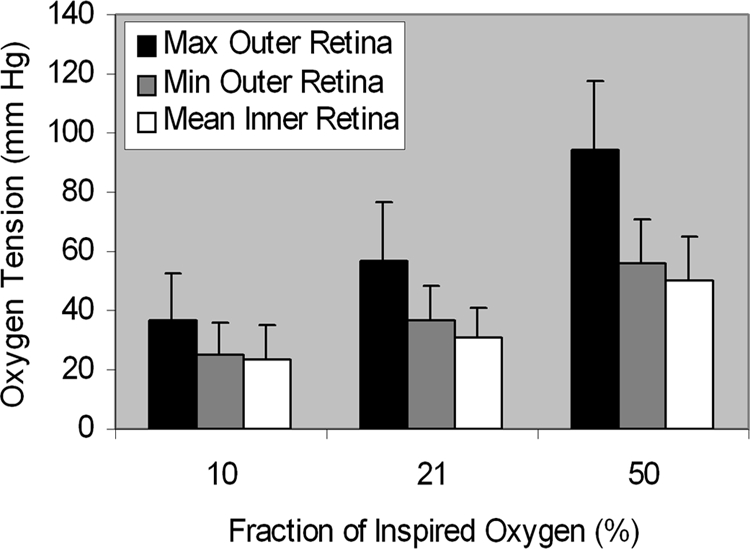
Mean retinal PO2 measurements obtained with 10%, 21%, and 50% FiO2 in eight rats. Error bars, SD.
The relationship between the slope of outer retina oxygen profile and maximum outer retina PO2 is shown in Figure 4. The slope of the outer retina PO2 profile was correlated with maximum outer retina PO2 (R = −0.86; P < 0.0001; n = 24). The relationship between mean inner retina PO2 and maximum outer retina PO2 is shown in Figure 5. Mean inner retina PO2 correlated highly with maximum outer retina PO2 (R = 0.88; P < 0.0001; n = 24).
Figure 4.
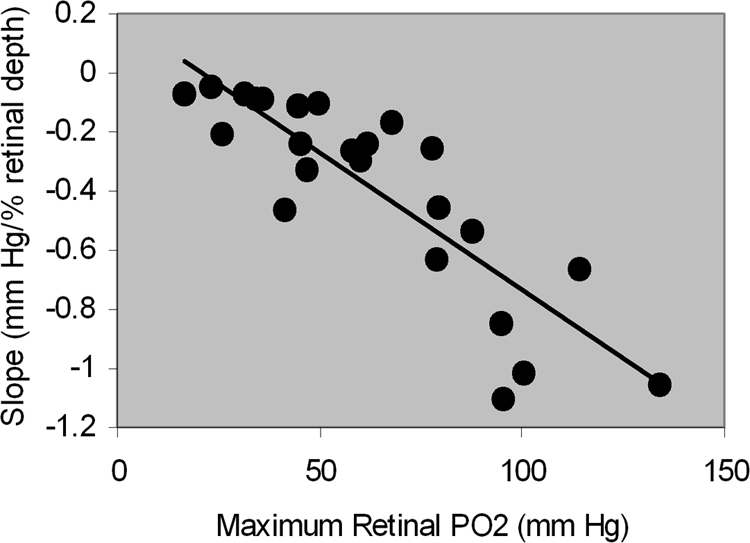
The relationship between the slope of the outer retina PO2 profile and maximum outer retina PO2. The more negative values correspond to a steeper slope.
Figure 5.
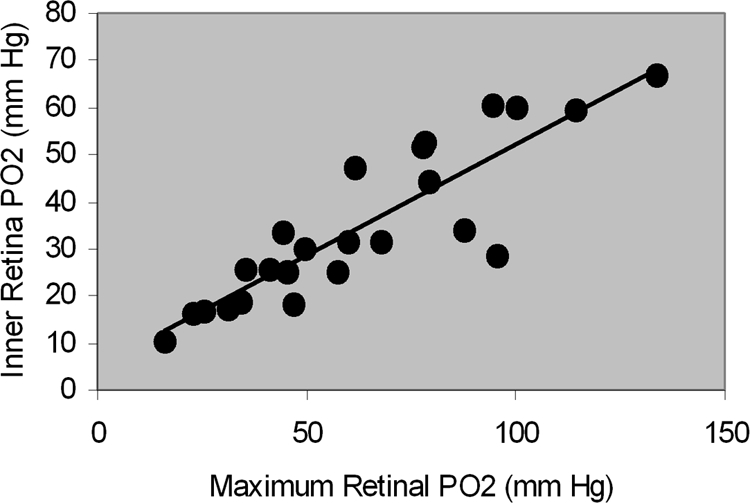
The relationship between mean inner retina PO2 and maximum outer retina PO2.
Discussion
Development of retinal pathologies may be related to retinal tissue hypoxia in common retinal diseases, such as diabetic retinopathy and age-related macular degeneration. Therefore, technologies that provide direct measurement of retinal tissue PO2 are needed to provide better understanding of the role of hypoxia in these retinal diseases. In the present study, an imaging technique was reported for mapping of retinal tissue PO2 and generating PO2 profiles through the retinal depth. The feasibility of the technique was established by determining reproducibility of PO2 measurements and demonstrating a significant increase in inner and outer retinal PO2 with higher fractions of inspired oxygen.
Significant changes in systemic arterial PO2 were induced by varying the fraction of inspired oxygen. In 21% and 50% FiO2, systemic arterial PO2 was lower than measurements obtained in previous studies.46–48 This result is attributable to the hypoxic condition of the rats in our study caused by the respiratory depressant effect of the anesthetics.37 Maximum outer retina PO2 significantly increased according to higher fractions of inspired oxygen, in agreement with prior studies that showed a proportionate increase in choroidal PO2 under hyperoxia.49 As previously reported, maximum outer retina and systemic arterial PO2 measurements were similar under hypoxia.32,39 In the 50% FiO2, maximum outer retina PO2 was approximately 50% of systemic arterial PO2, in agreement with studies performed under systemic arterial PO2 > 80 mm Hg in rats and other species.32,46,50,51 Mean inner and minimum outer retina PO2 increased with higher fractions of inspired oxygen, corresponding to microelectrode data in the cat and the rat.30,46,49 Similar to previous studies using oxygen microelectrodes that found larger outer retina PO2 gradients with increased FiO2,52 steeper slopes of the outer retina PO2 profile were linearly correlated with higher maximum outer retina PO2, indicating that oxygen flux into the outer retina is increased when maximum outer retina PO2 is higher.
Oxygen profiles generated by the optical imaging technique in the present study displayed different features compared with those published using the microelectrode technique.34,46 Inner retina PO2 variations did not display a minimum between two capillary layers, and the gradient of outer retina PO2 was lower. Since the imaging technique uses phosphorescent light for measuring retinal PO2, scattered light from intraretinal structures may have reduced the signal-to-noise ratio of the system, thereby limiting detection of PO2 variations due to inner retina capillary beds. In addition, the contribution of scattered light may have caused the averaging of phosphorescence signals from different retinal depths. This averaging would effectively lower the maximum outer retina PO2 measurement and elevate the minimum outer retina PO2 measurement, resulting in a reduced outer retina oxygen gradient compared with microelectrode data.
Although the retinal irradiance used in the present study was below the level that produces tissue damage, repeated laser exposures have the potential to induce phototoxic injury.53 Phototoxicity would have resulted in a progressive effect on data derived from images acquired repeatedly at the same location. However, data obtained from consecutive images acquired at the same location were found to be highly reproducible. Furthermore, the functional and structural integrity of the retinal tissue was assessed with available techniques after imaging in selected rats. In a light-adapted condition, the maximum amplitudes of the b-wave of the electroretinograms recorded 24 hours after probe and saline intravitreal injections were found to be similar, and retinal structures imaged by optical coherence tomography after PO2 imaging displayed no abnormalities. Future studies are needed to thoroughly assess the potential presence of phototoxicity in the retinal tissue and establish the reliability of the technique for monitoring disease progression over time.
Retinal PO2 measurements were reproducible, providing a reliable means of assessment of retinal oxygenation and metabolism due to retinal diseases. Furthermore, variations in maximum and minimum outer and mean inner retina PO2 at different locations along the image were small; suggesting that retinal PO2 profiles were relatively constant in the spatial extent imaged. One potential limitation of this technique is the dependence of the data on the quality of acquired images, which is a factor in all optical imaging techniques. Blurring of images can occur due to media opacities and aberrations, affecting accuracy of PO2 measurements. In our data set, this type of image degradation was encountered in approximately 20% of animals, in which the maximum outer retina PO2 was significantly lower than the systemic arterial PO2. In the present study, only focused images were analyzed, to minimize inaccuracy due to image blurring. Overall, this technique for quantitative mapping of retinal PO2 in animals may become useful for sequential monitoring of retinal oxygenation and provide a reliable means for assessing treatment regimens for retinal diseases.
Footnotes
Supported by the National Eye Institute Grants EY17918 (MS) and EY01792 (UIC); a Research to Prevent Blindness (RPB), New York, NY, senior scientific investigator award (MS); and an unrestricted departmental award from RPB.
Disclosure: M. Shahidi, None; J. Wanek, None; N.P. Blair, None; D.M. Little, None; T. Wu, None
References
- 1.Yoneya S, Saito T, Nishiyama Y, et al. Retinal oxygen saturation levels in patients with central retinal vein occlusion. Ophthalmology. 2002;109:1521–1526 [DOI] [PubMed] [Google Scholar]
- 2.Dugan JD, Jr, Green WR, Shonat RD, Kight AC. Ophthalmologic manifestations of carotid occlusive disease. Eye. 1991;5:226–238 [DOI] [PubMed] [Google Scholar]
- 3.Zhang W, Ito Y, Berlin E, Roberts R, Berkowitz BA. Role of hypoxia during normal retinal vessel development and in experimental retinopathy of prematurity. Invest Ophthalmol Vis Sci. 2003;44:3119–3123 [DOI] [PubMed] [Google Scholar]
- 4.Stefansson E, Machemer R, de Juan E, Jr, McCuen BW, II, Peterson J. Retinal oxygenation and laser treatment in patients with diabetic retinopathy. Am J Ophthalmol. 1992;113:36–38 [DOI] [PubMed] [Google Scholar]
- 5.Linsenmeier RA, Braun RD, McRipley MA, et al. Retinal hypoxia in long-term diabetic cats. Invest Ophthalmol Vis Sci. 1998;39:1647–1657 [PubMed] [Google Scholar]
- 6.Berkowitz BA, Kowluru RA, Frank RN, Kern TS, Hohman TC, Prakash M. Subnormal retinal oxygenation response precedes diabetic-like retinopathy. Invest Ophthalmol Vis Sci. 1999;40:2100–2105 [PubMed] [Google Scholar]
- 7.Berkowitz BA, Luan H, Gupta RR, et al. Regulation of the early subnormal retinal oxygenation response in experimental diabetes by inducible nitric oxide synthase. Diabetes. 2004;53:173–178 [DOI] [PubMed] [Google Scholar]
- 8.Bursell SE, Clermont AC, Shiba T, King GL. Evaluating retinal circulation using video fluorescein angiography in control and diabetic rats. Curr Eye Res. 1992;11:287–295 [DOI] [PubMed] [Google Scholar]
- 9.Anderson DR. Is ischemia the villain in glaucomatous cupping and atrophy? In: Brockhurst RJ, Boruchoff SA, Hutchinson BT, Lessell S. eds. Controversy in Ophthalmology. Philadelphia: W.B. Saunders Co.; 1977:312–319 [Google Scholar]
- 10.Zarbin MA. Age-related macular degeneration: review of pathogenesis. Eur J Ophthalmol. 1998;8:199–206 [DOI] [PubMed] [Google Scholar]
- 11.Delori FC. Noninvasive technique for oximetry of blood in retinal vessels. Appl Opt. 1988;27:1113–1125 [DOI] [PubMed] [Google Scholar]
- 12.Smith MH, Denninghoff KR, Hillman LW, Chipman RA. Oxygen saturation measurements of blood in retinal vessels during blood loss. J Biomed Opt. 1998;3:296–303 [DOI] [PubMed] [Google Scholar]
- 13.Schweitzer D, Thamm E, Hammer M, Kraft J. A new method for the measurement of oxygen saturation at the human ocular fundus. Int Ophthalmol. 2001;23:347–353 [DOI] [PubMed] [Google Scholar]
- 14.Hammer M, Schweitzer D. Quantitative reflection spectroscopy at the human ocular fundus. Phys Med Biol. 2002;47:179–191 [DOI] [PubMed] [Google Scholar]
- 15.Denninghoff KR, Smith MH, Lompado A, Hillman LW. Retinal venous oxygen saturation and cardiac output during controlled hemorrhage and resuscitation. J Appl Physiol. 2003;94:891–896 [DOI] [PubMed] [Google Scholar]
- 16.Wilson DF, Vanderkooi JM, Green TJ, Maniara G, DeFeo SP, Bloomgarden DC. A versatile and sensitive method for measuring oxygen. Adv Exp Med Biol. 1987;215:71–77 [DOI] [PubMed] [Google Scholar]
- 17.Rumsey WL, Vanderkooi JM, Wilson DF. Imaging of phosphorescence: a novel method for measuring oxygen distribution in perfused tissue. Science. 1988;241:1649–1651 [DOI] [PubMed] [Google Scholar]
- 18.Shonat RD, Wilson DF, Riva CE, Pawlowski M. Oxygen distribution in the retinal and choroidal vessels of the cat as measured by a new phosphorescence imaging method. Appl Optics. 1992;31:3711–3718 [DOI] [PubMed] [Google Scholar]
- 19.Riva CE. Noninvasive measurement of oxygen tension in the optic nerve head. Curr Opin Ophthalmol. 1998;9:56–60 [DOI] [PubMed] [Google Scholar]
- 20.Shonat RD, Kight AC. Oxygen tension imaging in the mouse retina. Ann Biomed Eng. 2003;31:1084–1096 [DOI] [PubMed] [Google Scholar]
- 21.Ferrez PW, Chamot SR, Petrig BL, Pournaras CJ, Riva CR. Effect of visual stimulation on blood oxygenation in the optic nerve head of miniature pigs: a pilot study. Klin Monatsbl Augenheilkd. 2004;221:364–366 [DOI] [PubMed] [Google Scholar]
- 22.Petrig BL, Riva CE, Hayreh SS. Laser Doppler flowmetry and optic nerve head blood flow. Am J Ophthalmol. 1999;127:413–425 [DOI] [PubMed] [Google Scholar]
- 23.Longo A, Geiser M, Riva CE. Subfoveal choroidal blood flow in response to light-dark exposure. Invest Ophthalmol Vis Sci. 2000;41:2678–2683 [PubMed] [Google Scholar]
- 24.Falsini B, Riva CE, Logean E. Flicker-evoked changes in human optic nerve blood flow: relationship with retinal neural activity. Invest Ophthalmol Vis Sci. 2002;43:2309–2316 [PubMed] [Google Scholar]
- 25.Berkowitz RA, Klyce SD, Kaufman HE. Aqueous hyposecretion after penetrating keratoplasty. Ophthalmic Surg. 1984;15:323–324 [PubMed] [Google Scholar]
- 26.Ito Y, Berkowitz BA. MR studies of retinal oxygenation. Vision Res. 2001;41:1307–1311 [DOI] [PubMed] [Google Scholar]
- 27.Roberts R, Zhang W, Ito Y, Berkowitz BA. Spatial pattern and temporal evolution of retinal oxygenation response in oxygen-induced retinopathy. Invest Ophthalmol Vis Sci. 2003;44:5315–5320 [DOI] [PubMed] [Google Scholar]
- 28.Zuckerman R, Cheasty JE, Wang Y. Optical mapping of inner retinal tissue PO2. Curr Eye Res. 1993;12:809–825 [DOI] [PubMed] [Google Scholar]
- 29.Linsenmeier RA. Effects of light and darkness on oxygen distribution and consumption in the cat retina. J Gen Physiol. 1986;88:521–542 [DOI] [PMC free article] [PubMed] [Google Scholar]
- 30.Linsenmeier RA, Yancey CM. Effects of hyperoxia on the oxygen distribution in the intact cat retina. Invest Ophthalmol Vis Sci. 1989;30:612–618 [PubMed] [Google Scholar]
- 31.Alder VA, Cringle SJ. Vitreal and retinal oxygenation. Graefes Arch Clin Exp Ophthalmol. 1990;228:151–157 [DOI] [PubMed] [Google Scholar]
- 32.Linsenmeier RA, Braun RD. Oxygen distribution and consumption in the cat retina during normoxia and hypoxemia. J Gen Physiol. 1992;99:177–197 [DOI] [PMC free article] [PubMed] [Google Scholar]
- 33.Linsenmeier RA, Padnick-Silver L. Metabolic dependence of photoreceptors on the choroid in the normal and detached retina. Invest Ophthalmol Vis Sci. 2000;41:3117–3123 [PubMed] [Google Scholar]
- 34.Cringle SJ, Yu DY, Yu PK, Su EN. Intraretinal oxygen consumption in the rat in vivo. Invest Ophthalmol Vis Sci. 2002;43:1922–1927 [PubMed] [Google Scholar]
- 35.Wangsa-Wirawan ND, Linsenmeier RA. Retinal oxygen: fundamental and clinical aspects. Arch Ophthalmol. 2003;121:547–557 [DOI] [PubMed] [Google Scholar]
- 36.Shahidi M, Shakoor A, Shonat R, Mori M, Blair NP. A method for measurement of chorioretinal oxygen tension. Curr Eye Res. 2006;31:357–366 [DOI] [PMC free article] [PubMed] [Google Scholar]
- 37.Shakoor A, Gupta M, Blair NP, Mori M, Shahidi M. Chorioretinal vascular oxygen tension in spontaneously breathing anesthetized rats. Ophthalmic Res. 2007;39:103–107 [DOI] [PMC free article] [PubMed] [Google Scholar]
- 38.Shakoor A, Blair NP, Mori M, Shahidi M. Chorioretinal vascular oxygen tension changes in response to light flicker. Invest Ophthalmol Vis Sci. 2006;47:4962–4965 [DOI] [PMC free article] [PubMed] [Google Scholar]
- 39.Shahidi M, Wanek J, Blair NP, Mori M. Three-dimensional mapping of chorioretinal vascular oxygen tension in the rat. Invest Ophthalmol Vis Sci. 2009;50:820–825 [DOI] [PMC free article] [PubMed] [Google Scholar]
- 40.Dunphy I, Vinogradov SA, Wilson DF. Oxyphor R2 and G2: phosphors for measuring oxygen by oxygen-dependent quenching of phosphorescence. Anal Biochem. 2002;310:191–198 [DOI] [PubMed] [Google Scholar]
- 41.Vinogradov SA, Lo L-W, Wilson DF. Dendritic polyglutamic porphyrins: Probing porphyrin protection by oxygen-dependent quenching of phosphorescence. Chem Eur J. 1999;5:1338–1347 [Google Scholar]
- 42.ANSI American National Standard for Safe Use of Lasers. ANSI Z136.1-1993. Orlando, FL: The Laser Institute of America; 1993 [Google Scholar]
- 43.Lakowicz JR, Laczko G, Cherek H, Gratton E, Limkeman M. Analysis of fluorescence decay kinetics from variable-frequency phase shift and modulation data. Biophys J. 1984;46:463–477 [DOI] [PMC free article] [PubMed] [Google Scholar]
- 44.Lakowicz JR, Szmacinski H, Nowaczyk K, Berndt KW, Johnson M. Fluorescence lifetime imaging. Anal Biochem. 1992;202:316–330 [DOI] [PMC free article] [PubMed] [Google Scholar]
- 45.Ridler TW, Calvard S. Picture thresholding using an iterative selection method. IEEE Trans Syst Man Cybernet. 1978;SMC-8:630–632 [Google Scholar]
- 46.Yu DY, Cringle SJ. Oxygen distribution and consumption within the retina in vascularised and avascular retinas and in animal models of retinal disease. Prog Retin Eye Res. 2001;20:175–208 [DOI] [PubMed] [Google Scholar]
- 47.Torbati D, Totapally BR, Camacho MT, Wolfsdorf J. Experimental critical care in ventilated rats: effect of hypercapnia on arterial oxygen-carrying capacity. J Crit Care. 1999;14:191–197 [DOI] [PubMed] [Google Scholar]
- 48.Sumitra M, Manikandan P, Rao KV, Nayeem M, Manohar BM, Puvanakrishnan R. Cardiorespiratory effects of diazepam-ketamine, xylazine-ketamine and thiopentone anesthesia in male Wistar rats: a comparative analysis. Life Sci. 2004;75:1887–1896 [DOI] [PubMed] [Google Scholar]
- 49.Yu DY, Cringle SJ, Alder V, Su EN. Intraretinal oxygen distribution in the rat with graded systemic hyperoxia and hypercapnia. Invest Ophthalmol Vis Sci. 1999;40:2082–2087 [PubMed] [Google Scholar]
- 50.Yu DY, Cringle SJ, Su EN. Intraretinal oxygen distribution in the monkey retina and the response to systemic hyperoxia. Invest Ophthalmol Vis Sci. 2005;46:4728–4733 [DOI] [PubMed] [Google Scholar]
- 51.Pournaras CJ, Riva CE, Tsacopoulos M, Strommer K. Diffusion of O2 in the retina of anesthetized miniature pigs in normoxia and hyperoxia.1989;49:347–360 [DOI] [PubMed] [Google Scholar]
- 52.Cringle SJ, Yu DY. A multi-layer model of retinal oxygen supply and consumption helps explain the muted rise in inner retinal PO(2) during systemic hyperoxia. Comp Biochem Physiol A Mol Integr Physiol. 2002;132:61–66 [DOI] [PubMed] [Google Scholar]
- 53.Stepinac TK, Chamot SR, Rungger-Brandle E, et al. Light-induced retinal vascular damage by Pd-porphyrin luminescent oxygen probes. Invest Ophthalmol Vis Sci. 2005;46:956–966 [DOI] [PubMed] [Google Scholar]


