Ferritin subunit composition is cell-type specific and controls iron metabolism in cells. In this study, alterations of subunit composition in lens epithelial cells had profound effects on cellular homeostatic mechanisms dependent on iron metabolism.
Abstract
Purpose.
The iron storage protein ferritin is necessary for the safe storage of iron and for protection against the production of iron-catalyzed oxidative damage. Ferritin is composed of 24 subunits of two types: heavy (H) and light (L). The ratio of these subunits is tissue specific, and alteration of this ratio can have profound effects on iron storage and availability. In the present study, siRNA for each of the chains was used to alter the ferritin H:L chain ratio and to determine the effect of these changes on ferritin synthesis, iron metabolism, and downstream effects on iron-responsive pathways in canine lens epithelial cells.
Methods.
Primary cultures of canine lens epithelial cells were used. The cells were transfected with custom-made siRNA for canine ferritin H- and L-chains. De novo ferritin synthesis was determined by labeling newly synthesized ferritin chains with 35S-methionine, immunoprecipitation, and separation by SDS-PAGE. Iron uptake into cells and incorporation into ferritin was measured by incubating the cells with 59Fe-labeled transferrin. Western blot analysis was used to determine the presence of transferrin receptor, and ELISA was used to determine total ferritin concentration. Ferritin localization in the cells was determined by immunofluorescence labeling. VEGF, glutathione secretion levels, and cystine uptake were measured.
Results.
FHsiRNA decreased ferritin H-chain synthesis, but doubled ferritin L-chain synthesis. FLsiRNA decreased both ferritin H- and L-chain synthesis. The degradation of ferritin H-chain was blocked by both siRNAs, whereas only FHsiRNA blocked the degradation of ferritin L-chain, which caused significant accumulation of ferritin L-chain in the cells. This excess ferritin L-chain was found in inclusion bodies, some of which were co-localized with lysosomes. Iron storage in ferritin was greatly reduced by FHsiRNA, resulting in increased iron availability, as noted by a decrease in transferrin receptor levels and iron uptake from transferrin. Increased iron availability also increased cystine uptake and glutathione concentration and decreased nuclear translocation of hypoxia-inducible factor 1-α and vascular endothelial growth factor (VEGF) accumulation in the cell-conditioned medium.
Conclusions.
Most of the effects of altering the ferritin H:L ratio with the specific siRNAs were due to changes in the availability of iron in a labile pool. They caused significant changes in iron uptake and storage, the rate of ferritin synthesis and degradation, the secretion of VEGF, and the levels of glutathione in cultured lens epithelial cells. These profound effects clearly demonstrate that maintenance of a specific H:L ratio is part of a basic cellular homeostatic mechanism.
Ferritin is a multimeric iron-storage protein consisting of 24 subunits of two types: heavy (H) and light (L). The ratio of these two chains is tissue specific and controls iron storage and availability.1 Ferritin H- and L-chain expression is regulated at both the transcriptional2 and translational levels.3 In addition, cells can regulate the H:L ratio through differential rates of degradation and secretion for each chain.4,5
The role of ferritin H- and L-chains and the effects of alteration of the H:L ratio on iron storage and physiological and pathologic processes, have been studied by inducing the overexpression and underexpression (siRNA knockdown) of each chain. Overexpression of H-chain ferritin decreases the cytosolic labile iron pool (LIP; considered to be a pool of available iron in the cytosol), increases iron incorporation into ferritin, and increases cell resistance to oxidative stress and UV irradiation in cultured erythroid cells and in lens epithelial cells (LECs).6–8 In addition, altering the H:L ratio with siRNA has significant effects on iron availability in HeLa cells. Ferritin L-chain siRNA (FLsiRNA) decreases L-chain levels by 80%, but has no effect on H-chain levels or any parameters indicative of iron availability. On the other hand, ferritin H-chain siRNA (FHsiRNA) decreases H-chain levels by 75% and increases L-chain levels threefold. FHsiRNA also increases iron availability and decreases resistance to oxidative stress induced by hydrogen peroxide.9
We have recently shown that ferritin chains are significantly modified in canine and human lens fiber cells and that these modifications increase with age.10 Although it is unclear how these modifications affect the assembly of the whole ferritin molecule, they most likely affect the iron storage capability of ferritin. Such changes could contribute to cataractogenesis, either by the aggregation of abnormal chains or by increasing the availability of reactive iron that cannot be safely stored.
Ferritin chains have other physiologic roles beyond safely storing potentially reactive iron. For example, siRNA knockdown showed that H-chain ferritin contributes to malignant mesothelioma cell resistance to apoptosis11 and that L-chain ferritin plays a role in iron-independent cellular proliferation.9
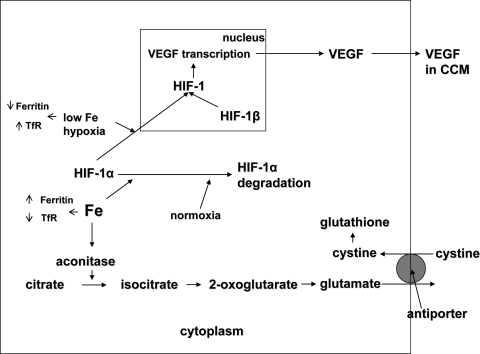
Indeed, the physiological roles of iron are numerous, and new activities have recently been uncovered (Fig. 1), such as the regulation of the levels of hypoxia inducible factor (HIF)-1,12,13 a transcription factor that regulates many genes, including vascular endothelial growth factor (VEGF),14,15 which is made by the lens.16 We have recently shown that iron controls VEGF secretion in both LECs (McGahan MC, et al. IOVS 2007;48:ARVO E-Abstract 2436) and retinal pigmented epithelial (RPE) cells (Ferrell J, Harned J, unpublished data, 2008). Furthermore, iron controls the synthesis and secretion of glutamate in LECs, RPE cells, and neurons.17 The iron-regulated secretion of glutamate had downstream effects on cystine uptake by the cystine/glutamate antiporter and the levels of glutathione (GSH) in these cells.18
Figure 1.
The role of iron in HIF-1 activation and GSH production.
The goal of the present study was to alter the ferritin H:L ratio with siRNA for each ferritin chain and to determine how these changes affect iron storage and availability, ferritin levels (including the kinetics of its synthesis and degradation), cystine uptake, GSH levels, HIF-1α translocation to the nucleus, and VEGF production in LECs.
Methods
Tissue Culture
Dogs were obtained from the Johnston County Animal Shelter (North Carolina) after they had been euthanatized. The eyes were removed and the anterior lens capsule dissected from the lens and placed on a 100-mm tissue culture plate in DMEM (Invitrogen, Carlsbad, CA) containing 10% fetal bovine serum (Hyclone, Logan, UT) and 1% antibiotic-antimycotic (Mediatech, Manassas, VA). LECs were grown to confluence and subsequently seeded onto six-well plates for the experiments.
siRNA Transfection
Custom siRNA for canine ferritin H- and L-chains (SMARTpools, M-010264-00 and M-040576-00, respectively) chains were designed and produced by Dharmacon RNA Technologies (Lafayette, CO), by using canine ferritin sequences determined in this laboratory.7 Dharmacon siRNA design utilizes innovative strategies to optimally reduce off-target effects, including advanced rational design based on bioinformatic analysis, pooling of duplexes, and unique chemical modifications to both the sense and antisense strands to enhance siRNA specificity. Furthermore, the FLsiRNA includes modification reagents (On-TARGET Plus; Dharmacon) to minimize seed region–related mRNA off-target silencing.
Cells were plated at a density of 90,000 to 105,000/well on six-well plates in DMEM+10% fetal bovine serum and incubated overnight at 37°C, typically reaching 40% to 50% confluence. A control nontargeting siRNA pool (Dharmacon) was transfected alongside the ferritin H- and L-siRNA (FH- and FLsiRNA) on each plate to account for any non–sequence-specific cell responses. Lipophilic transfection reagent (0.93 μL/mL, Lipofectamine 2000; Invitrogen) siRNA complexes were formed, according to the manufacturer's protocol, in serum-free DMEM and added to each well at a final concentration of 100 nM siRNA. After overnight incubation, transfection medium was replaced with the appropriate medium, depending on the specific treatment to follow. De novo ferritin chain synthesis was monitored for each experiment to confirm knockdown.
Reverse Transcription and Quantitative Real-Time PCR
Total RNA was extracted from cultured LECs, 24 hours after transfection with CTL, FH, or FLsiRNA (RNeasy kit and Qiashredders; Qiagen, Valencia CA) according to the manufacturer's protocol. Cell lysates from four 3.5-cm wells were combined for RNA extraction. The RNA samples were quantitated with a spectrophotometer (NanoDrop Technologies, Wilmington, DE), and 1.0 μg of RNA from each sample was reverse transcribed using oligo dT primers and a transcription system (ImProm-II Reverse Transcription System; Promega, Madison, WI). Real-time PCR was performed with master mix (PowerSYBR Green; Applied Biosystems [ABI], Foster City, CA) in a thermocycler (iCycler iQ; Bio-Rad Laboratories, Hercules, CA). The following primers were used at a concentration of 0.3 μM each: FH upstream primer, 5′-CGATGATGTGGCTTTGAAGA-3′; FH downstream primer, 5′-AAGATTCGACCACCTCGTTG-3′; FL upstream primer, 5′-AAACCGTCCCAAGATGAGTG-3′; FL downstream primer, 5′- TGGTTCTCCAGGAAGTCACA-3′. Prepared in duplicate, 25-μL reactions contained 5 μL of template corresponding to 0.5% or 0.05% of the RT product. Coding sequences of ferritin light and heavy cDNAs that we had previously cloned into mammalian expression vector (pTargeT; Promega)7 were excised (ECoRI, purified with QIAquick Gel Extraction Kit; Qiagen) and used to generate a standard curve. The thermal cycler's system software was used to analyze the data (ver. 3.0. iCyclerTM iQ Optional System Software; Bio-Rad).
De Novo Ferritin Synthesis
The accumulation of newly synthesized ferritin was quantified by incubating transfected cells for 20 hours in serum- and methionine-free DMEM with 60 μCi translabel-35S-methionine (MP Biomedicals, Solon, OH). The cells were lysed on ice in Tris lysis buffer (pH 8.0; 50 mM Tris, 150 mM NaCl, 1% Triton X-100, 0.02% sodium azide, and 0.006% protease inhibitor cocktail) and the supernatants collected after 12,000g centrifugation. Ferritin was immunoprecipitated with goat anti-horse ferritin (Bethyl Laboratories, Montgomery, TX), and the ferritin subunits were separated by 12% SDS-PAGE in reducing conditions. Radioactivity was quantified with an electronic autoradiography system (Instant Imager; Perkin-Elmer, Waltham, MA) and normalized to radioactivity incorporated into total cell protein precipitated with TCA.
Total Iron Uptake
Transfected cells were preincubated for 1 hour in serum-free DMEM to remove any transferrin that was still bound to receptors in the membrane, after which the medium was replaced with fresh serum-free DMEM containing 240 μg/mL 59Fe-Tf and incubated for 24 hours. The cells were washed with cold PBS and lysed by adding 200 μL of distilled water to each well, followed by freezing and thawing. Radioactivity in the lysates was measured with a gamma counter (Wallac Wizard; PerkinElmer). Protein content was quantified by bicinchoninic acid (BCA) assay.
Iron Incorporation into Ferritin
Transfected cells were preincubated in serum-free DMEM for 1 hour, medium removed and replaced with fresh serum-free medium containing 59Fe-transferrin (4 μM human apotransferrin, 5.8 μM Fe, and 8 μCi/mL, prepared as previously described19 for 20 hours. The cells were rinsed on ice with cold PBS, then lysed in 10 mM Tris-Cl (pH 7.4) containing protease inhibitor cocktail and phenylmethylsulfonyl fluoride (PMSF; Sigma, St. Louis, MO). Proteins in the 30,000g supernatant were acetone precipitated, and the resulting pellet was air-dried and resuspended in a small volume of PBS. After removing an aliquot for protein determination, the remaining sample was loaded and subjected to 8% native PAGE. Radioactivity in the ferritin bands was quantified with electronic autoradiography (Instant Imager; PerkinElmer).
Western Blot Analysis of Transferrin Receptor
Twenty-four hours after transfection, the cells were rinsed and incubated in serum-free MEM for 24 hours. After lysis in RIPA buffer (Pierce, Rockford, IL) and centrifugation at 14,000g for 15 minutes, the supernatants were concentrated on centrifugal columns (Microcon 30; Millipore, Billerica, MA) and analyzed for protein content by BCA assay (Pierce). Twenty-five micrograms of protein from each sample was loaded onto an 8% denaturing Tris-tricine gel along with 6 μg of purified human placenta Tf receptor (TfR; Alpha Diagnostics, San Antonio, TX) as a positive control. The proteins were transferred for 30 minutes at 20 V to a nitrocellulose membrane (Hybond-ECL; GE Healthcare, Munich, Germany). Blots were blocked in 10 mM Tris buffer (pH 7.5), containing 100 mM NaCl, 0.1% Tween-20, and 5% nonfat dry milk. All incubations were performed for 1 hour at room temperature in blocking buffer. The membranes were incubated in a 1:2000 dilution of monoclonal mouse anti-human TfR (Invitrogen) followed by a series of six washes (6 minutes each) in Tris buffer without milk. The secondary antibody used was HRP-labeled goat anti-mouse (BD Biosciences, Palo Alto, CA) at a dilution of 1:750. After another set of washes and a final wash in Tris-buffered saline, ECL (GE Healthcare) was used for detection. After blocking overnight at 4°C, blots were then reprobed with a 1:500 dilution of HRP-goat anti-human β-actin (Santa Cruz Biotechnology, Santa Cruz, CA), which was used as a loading control.
Ferritin Chain Degradation
Twenty-four hours after transfection with the nontargeting control siRNA, FHsiRNA, or FLsiRNA, LECs were incubated for 18 hours with 60 μCi translabel 35S-methionine. After the labeling period, the cells were either harvested (time 0) or rinsed and incubated for an additional 12 or 28 hours in DMEM with 10% FBS containing a large excess of unlabeled methionine (2 mM) and cysteine (0.7 mM) to prevent recycling of the radioactive amino acids. The cells were lysed and the ferritin immunoprecipitated by using the same protocol as for de novo ferritin synthesis, followed by separation of the FH and FL chains by 12% SDS-PAGE. Radioactivity in the ferritin bands was quantified by electronic autoradiography (InstantImager; PerkinElmer) and normalized to radioactivity incorporated into total cell protein precipitated with TCA.
Determination of Total Ferritin within the Cells
Ferritin concentration in cell lysates was measured by sandwich ELISA. Transfected cells were lysed in 10 mM Tris-Cl (pH 7.4) containing protease inhibitors and PMSF. Lysates from similar treatments were pooled and concentrated 6- to 10-fold on centrifugal columns (Centricon 10; Millipore). Assay plates (ProBind; BD Biosciences) were coated with affinity-purified goat anti-horse ferritin (4 μg/mL) overnight at 4°C. After the reactions were blocked, samples and standards (dog liver ferritin; NEIA, Inc., Cambridge MA) were applied and incubated for 1 hour at 37°C. After the plates were washed three times with 0.05% Tween-20 in PBS, HRP-labeled goat anti-horse ferritin (Bethyl; 0.5 μg/mL) was added and incubated for 1 hour at room temperature. After further washing, ABTS peroxidase substrate (KPL, Gaithersburg, MD) was applied for 10 to 20 minutes, and absorbance was read at 405 nm on a microplate reader (Sunrise; Tecan, Research Triangle Park, NC).
Ferritin Immunofluorescence
LECs were cultured and transfected as described, but on 22-mm glass coverslips in six-well plates. All labeling steps were performed at room temperature. Four days after transfection with control and ferritin H- and L-siRNAs, the cells were washed twice with 37°C Dulbecco's phosphate-buffered saline (DPBS) and then fixed for 15 minutes with 4% formaldehyde in DPBS (37°C). After permeabilization with ice-cold methanol for 10 minutes, the cells were washed three times with 1× PBS, blocked with 5% normal goat serum for 1 hour, and then incubated with rabbit H- and L-ferritin–specific antisera4 diluted 1:1000 in 1× PBS + 0.1% BSA for 1 hour. Negative antibody controls were incubated with normal rabbit serum in place of ferritin antisera. After three 10-minute washes in 1× PBS, the cells were incubated with goat anti-rabbit Alexa Fluor 488-conjugated IgG (Invitrogen) diluted 1:1000 in 1× PBS for 1 hour in darkness. After three 10-minute washes in 1× PBS, coverslips were mounted on slides in antifade reagent containing DAPI (ProLong Gold; Invitrogen). Some cells were incubated for 1 hour at 37°C with 2.0 μM red fluorescent dye (Lysotracker Red; Invitrogen) in DMEM, to label lysosomes before fixation and ferritin detection. The cells were then imaged with a microscope (DM5000B; Leica, Bannockburn, IL) with conventional epifluorescence and DIC optics. Images were captured with a cooled CCD camera (Retiga 1300; QImaging, Surrey, BC, Canada) and imaging software (Simple PCI; Compix, Inc., Cranberry Township, PA) and arranged with image-editing software (Photoshop CS2; Adobe, San Jose, CA).
Determination of HIF-1α Levels in Nuclear Extracts
LECs were transfected as described with control, FHsiRNA, or FLsiRNA. Ten hours after transfection, nuclear extracts were prepared (NE-PER kit; Pierce) and stored at −80°C. HIF1α levels in the nuclear extracts were measured by sandwich ELISA with an HIF-1α kit (DuoSet IC Human/Mouse; R&D Systems, Minneapolis, MN) according to the manufacturer's protocol. The quantity of HIF-1α was normalized to the amount of protein in the corresponding cytosolic extracts and expressed as a percentage of the HIF-1α found in the control transfected cells.
Determination of VEGF in Cell-Conditioned Medium (CCM)
VEGF was determined by ELISA, with antibodies, standard, and reagents from R&D Systems, Inc. LECs were transfected as described, medium replaced with serum-free, glutamine-free MEM and then incubated for 24 hours at 37°C. The plates were placed on ice, CCM collected, and any floating cells removed by centrifugation at 1200g. Samples were stored at −80°C. For the VEGF assay, 96-well assay plates (ProBind; BD Biosciences) were coated with monoclonal anti-human VEGF in PBS (0.8 μg/mL) overnight (all incubations were performed at room temperature). After three washes in PBS+0.05% Tween-20, standards (recombinant human VEGF165) and samples were applied and incubated for 2 hours. PBS+1% BSA was used as diluent throughout the assay. The washes were repeated, followed by incubation with biotinylated anti-human VEGF (25 ng/mL) for another 2 hours. The plate was washed, and a 1:200 dilution of streptavidin-HRP was added for 20 minutes. After the final set of washes, the substrate (H2O2/tetramethylbenzidine) was added for 20 minutes followed by 1 M H2SO4 to stop the reaction. Absorbance at 450/540 nm was read within 30 minutes on a microplate reader (Sunrise; Tecan).
Determination of GSH within the Cells
Transfected LECs were analyzed for intracellular GSH concentration by using a commercially available kit (Chemicon, Temecula, CA). Four days after transfection, the cells were lysed, centrifuged at 12,000g (at 4°C) and put on ice. The lysates were incubated for 1 hour at room temperature and protected from light in black-walled 96-well plates after addition of monochlorobimane dye dissolved in acetonitrile. A fluorometer (Fluoroskan Ascent; Thermo-Scientific, Waltham, MA) was used to measure fluorescence (390-nm excitation, 460-nm emission). GSH levels were standardized to the amount of protein in the lysates.
Cystine Uptake
Transfected cells were labeled with 5 μM l-35S-cystine in uptake buffer (pH 7.4), consisting of 137 mM NaCl, 10 mM HEPES, 5 mM glucose, 1 mM MgCl2, 1 mM CaCl2, and 0.7 mM KH2PO4 and incubated for 2 minutes at 37°C in 5% CO2. Uptake was terminated by removing the buffer and washing the cells three times with ice-cold PBS. The lysates were prepared by incubating the cells, on ice, in 10 mM Tris buffer containing protease inhibitors and PMSF for 20 minutes, followed by a 5-minute centrifugation (14,600g) at 4°C. Radioactivity was measured in a sample of the lysate using a liquid scintillation counter (1409 Wallac; Perkin Elmer). Incorporation of radioactivity into protein was determined by TCA precipitation.
Statistics
The data were analyzed by ANOVA with Tukey's HSD test for multiple comparisons; differences were significant at P < 0.05.
Results
In this study, we altered the ferritin H:L chain ratio by transfecting cultured LECs with siRNA for either ferritin chain (FH- or FLsiRNA) and determining the effects on de novo ferritin H- and L-chain synthesis and degradation rate, iron availability and storage in ferritin, total ferritin concentration, and downstream effects on iron-regulated pathways (see Fig. 1).
Effect of FH- and FLsiRNA on FH- and FLmRNA and on De Novo Synthesis of Ferritin H- and L-Chains
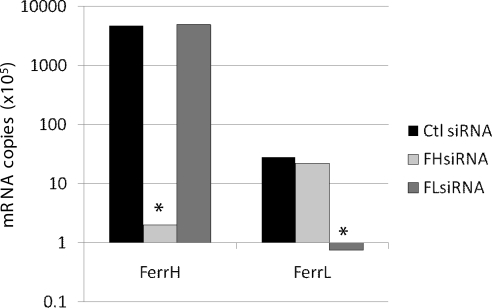
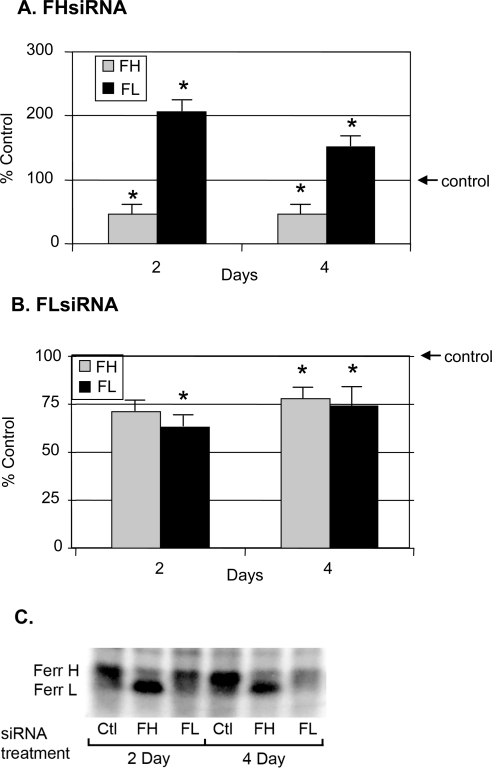
FHsiRNA greatly reduced the copy number of FH mRNA while having no effect on FL mRNA. The same specificity of effect on target mRNA was true for FLsiRNA (Fig. 2). FHsiRNA significantly decreased synthesis of ferritin H-chain as early as 2 days after transfection (Fig. 3A). This decrease was maintained at 4 days after transfection. Surprisingly, FHsiRNA caused a very large increase (100%) in de novo ferritin L-chain synthesis by day 2 after transfection. A large increase (50%) was still noted on day 4. Transfection with FLsiRNA did not have similar dramatic effects. De novo synthesis of L-chain was significantly decreased by approximately 40% on day 2 and 26% on day 4 (Fig. 3B). Unexpectedly, H-chain synthesis was also significantly decreased (22%) on posttransfection day 4.
Figure 2.
The effect of FH and FLsiRNA on FH and FL mRNA in cultured LECs. Total RNA was extracted from cultured LECs differentially transfected with siRNAs designed to suppress FH- or FLsiRNA expression or with nontargeting Ctl siRNA. Changes in the expression of ferritin H- and L-chain genes were analyzed at mRNA level by qRT-PCR with SYBR green master mix. Copy number was determined based on a standard curve generated from serial dilution of a known concentration of each gene's cDNA. *Significantly different from control (P < 0.05).
Figure 3.
Effect of H- and L-chain siRNA on de novo ferritin subunit synthesis in LECs. (A, B) LECs were seeded in six-well plates, then transfected with nontargeting control or FH- or FLsiRNA. Two and 4 days later, the cells were incubated with 35S-methionine for 20 hours. A sample for TCA precipitation was removed from the cell lysates, followed by immunoprecipitation of ferritin from the lysates. The solubilized immunoprecipitate was subjected to 12% SDS-PAGE, and radioactivity in the ferritin H- and L-chain bands was normalized to the total amount of radioactivity incorporated into protein (TCA). The data are expressed as a percentage of that of control cells transfected with nontargeting siRNA. The histograms represent the mean ± SEM of at least eight samples. *Significantly different from control (P < 0.05); ANOVA and Tukey's test. (C) A representative gel showing newly synthesized H- and L-chain ferritin subunits labeled with 35S-methionine after siRNA treatment.
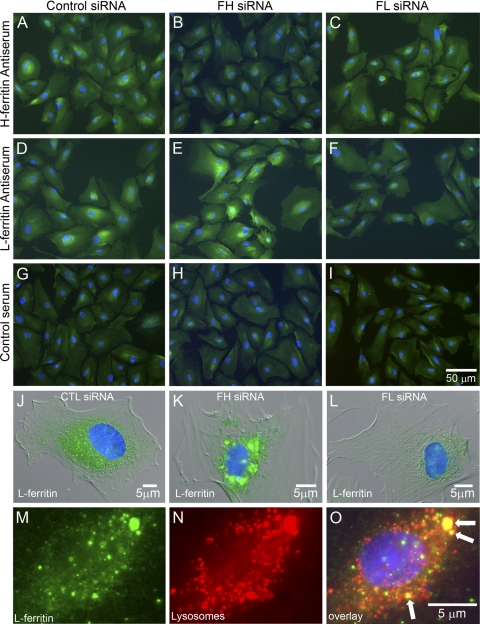
With such a dramatic increase in L-chain ferritin levels in cells transfected with FHsiRNA, we wanted to visualize how ferritin chains were distributed and whether the large increase in L-chain ferritin was localized to any particular subcellular compartment. Cells transfected with a nontargeting control siRNA showed endogenous levels of ferritin H- and L-chain at 4 days after transfection (Figs. 4A, 4D). FHsiRNA transfection resulted in a large decrease in staining for ferritin H-chain (Fig. 4B), whereas ferritin L-chain became even more abundant than in cells transfected with control siRNA (Fig. 4E). Decreases in signal were noted for both H- and L-chain ferritin after FLsiRNA transfection (Figs. 4C, 4F).
Figure 4.
Transfection with FH- or FLsiRNA altered the levels of ferritin chains as determined by immunolocalization. The cells were transfected with control nontargeting siRNA (A, D, G, J), FHsiRNA (B, E, H, K, M–O), or FLsiRNA (C, F, I, L) and immunolabeled after 4 days for ferritin chains using (A, B, C) H- or (D–F, J–M) L-specific antisera followed by Alexa Fluor-488-conjugated secondary antibodies (green fluorescence) and DAPI staining (blue nuclei). Negative antibody controls were incubated with normal rabbit serum (Control serum) in place of ferritin-specific antisera (G, H, I). Higher magnifications of representative cells for each siRNA treatment and labeled for L-ferritin are shown (J–L). (M) A cell transfected with FHsiRNA for 4 days and labeled for 1 hour with red fluorescent dye before fixation (N). The overlay (O) shows colocalization (yellow) of ferritin within lysosomes (arrows).
Effect of FH- and FLsiRNA on Ferritin Chain Degradation
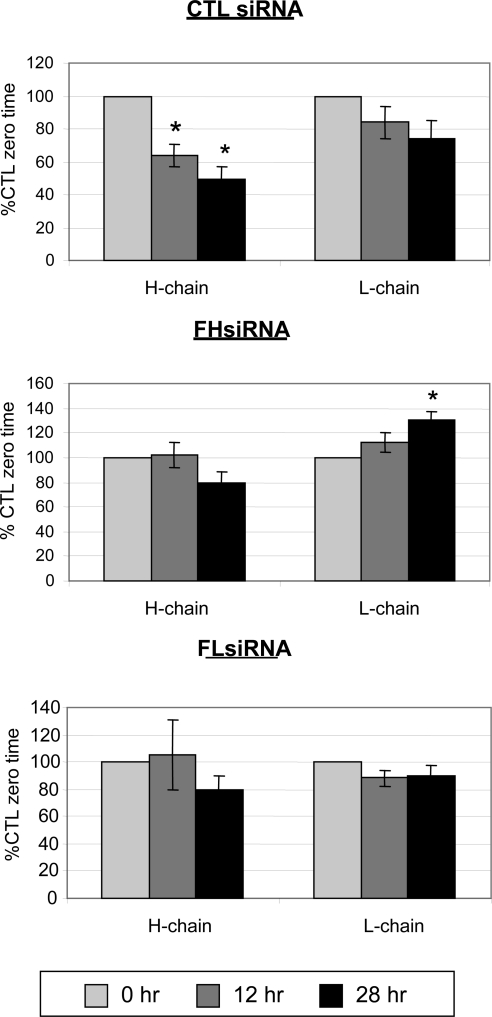
Total ferritin levels are also controlled by the rates of degradation of ferritin H- and L-chains, which are normally quite low.5 To determine how ferritin siRNAs affect these rates, cellular ferritin in each of the three treatment groups (CTL siRNA, FHsiRNA, and FLsiRNA) was labeled with 35S-methionine for 18 hours. The amount of label present in each chain was then measured 0, 12, and 28 hours later. In control cells, H-chain steadily degraded over 28 hours, whereas L-chain did not significantly decrease over time. FLsiRNA did not alter L-chain ferritin levels at any time compared with the control, but it did inhibit H-chain degradation. In contrast, FHsiRNA significantly blocked degradation of H-chain and caused a large and significant accumulation of labeled L-chain ferritin (Fig. 5).
Figure 5.
Ferritin chain degradation after siRNA knockdown. Twenty-four hours after transfection with a control nontargeting siRNA, FHsiRNA, or FLsiRNA, LECs were incubated for 18 hours with 60 μCi translabel 35S-methionine. After the labeling period, the cells were either harvested (time 0) or rinsed and incubated an additional 12 or 28 hours in DMEM with 10% FBS and a large excess of cold methionine and cysteine, to prevent recycling of the radioactive label. Ferritin was immunoprecipitated from lysates with goat anti-horse ferritin and H- and L-ferritin chains separated by 12% SDS-PAGE. Radioactivity in the ferritin bands was measured and normalized to radioactivity incorporated into total cell protein. Degradation of each chain at 12 and 28 hours is expressed as a percentage of the corresponding chain and transfection treatment at time 0 (%CTL time 0). Each bar represents the mean ± SEM of four samples. *Significantly different from its time 0 counterpart (P < 0.05); ANOVA and Tukey's test.
We were curious as to why L-chain ferritin seemed not to be degraded, and its levels even continued to increase. At higher magnification, cells transfected with control or FLsiRNA generally showed diffuse L-chain ferritin labeling (Figs. 4J, 4L), whereas many cells transfected with FHsiRNA often displayed aggregates of L-chain ferritin accumulation around the nucleus (Fig. 4K). In another study, we had shown that overexpression of L-chain ferritin in LECs results in the accumulation of L-chain ferritin cytoplasmic inclusions.5 In the present study, many of the cells transfected with FHsiRNA contained larger, spherical areas of L-chain ferritin accumulation that were reminiscent of lysosomes (Fig. 4M). To determine whether L-chain ferritin was targeted to lysosomes, as would be expected as part of the normal degradation process, we labeled the transfected cells with red fluorescent dye (Lysotracker Red; Invitrogen) for 1 hour at 4 days after transfection (Fig. 4N). This fluorescent, membrane-permeant dye labels acidic organelles, primarily lysosomes and endosomes. Some structures labeled with the red dye also contained L-chain ferritin (Fig. 4O). However, not all L-chain ferritin colocalized with lysosomes, which would be expected due to the dynamic nature of protein turnover. Of note, the largest ferritin-positive structures colocalized with the largest lysosomes.
Total Ferritin Concentration in Transfected Cells
Since ferritin is a long-lived protein, it was important to determine the effects of siRNA-induced changes in de novo ferritin synthesis and degradation on total ferritin concentration in the LECs. As determined by ELISA, transfection with FLsiRNA decreased total ferritin concentration more than 10-fold at 2 days after transfection. This was followed by a rebound to approximately threefold lower than control ferritin at 4 days. In contrast, FHsiRNA increased the concentration of ferritin in LECs almost 200-fold 2 days after transfection. Ferritin concentration continued to increase, reaching levels 500-fold higher than that of the control 4 days after transfection (Table 1). These dramatic increases were most likely due to the very large increase in de novo ferritin L-chain synthesis combined with complete inhibition of L-chain ferritin degradation.
Table 1.
Effect of siRNAs on Ferritin Concentration in LECs
| Treatment | 2 d | 4 d |
|---|---|---|
| Ctl siRNA | 5.9 ± 4.0 | 4.9 ± 1.8 |
| FHsiRNA | 1066 ± 274* | 2497 ± 1140* |
| FLsiRNA | 0.4 ± 0.3* | 1.5 ± 1.1* |
Data are mean ferritin concentration (ng/mg ± SD).
Significantly different versus control siRNA.
Iron Incorporation into Assembled Ferritin with Different H:L Ratios
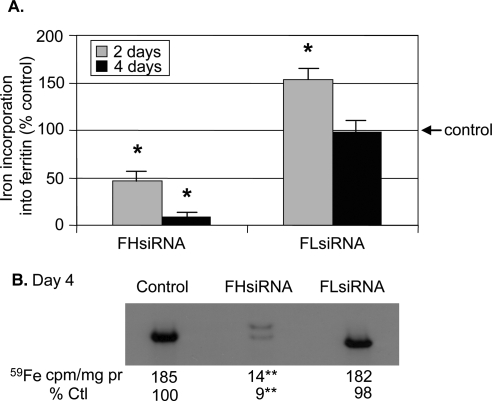
Other studies have demonstrated that alterations in the ferritin H:L ratio affect the ability of ferritin to store iron.9 Since transfection with FHsiRNA dramatically altered the H:L ratio in LECs, the iron storage capability of ferritin in LECs was determined. The cells were loaded with 59Fe-transferrin after transfection, cytosolic proteins were separated by PAGE, and the radioactivity of the bands determined. The radioactive band corresponded in size to a ferritin standard (450 kDa, not shown). FH siRNA-transfected cells had dramatically reduced iron incorporation into ferritin on day 2 and continued to decrease, reaching as low as 9% of that found in control cells by day 4 (Figs. 6A, 6B). Two ferritin bands of slightly different mobility were detected on the autoradiogram of FHsiRNA-treated cells. FLsiRNA-transfected LECs exhibited a significant increase in iron incorporation into ferritin 2 days after transfection. However, by day 4, the iron incorporation was not different from control levels.
Figure 6.
Effect of H- and L-chain siRNA on iron incorporation into ferritin. (A) Two and 4 days after transfection with either nontargeting control, FHsiRNA, or FLsiRNA, LECs were incubated for 20 hours with 59Fe-transferrin. After cell lysis, proteins were precipitated with acetone, resuspended in PBS, an aliquot removed for protein determination and the remaining sample subjected to 8% native PAGE. The amount of 59Fe in the ferritin band was normalized to total protein in each sample and data expressed as a percentage of that of control cells transfected with nontargeting siRNA. The histogram bars represent the mean of at least five samples. (B) A representative autoradiogram from the 4-day time point. *Significantly different from control (P < 0.05); **significantly different from control (P < 0.01); ANOVA and Tukey's test.
Changes in Iron Availability in Transfected Cells
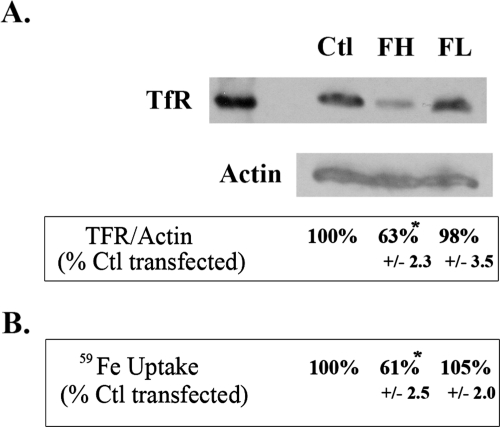
Since synthesis of ferritin is regulated by iron, the FHsiRNA-induced increase in L-chain ferritin may have been due to an increase in iron availability. Since transferrin receptor (TfR) levels decrease when intracellular iron availability increases, TfR levels are often used as an index of cellular iron status. Indeed, TfR levels detected by Western blot analysis were reduced by almost 40% when the cells were treated with FHsiRNA compared with cells treated with nontargeting siRNA controls (Fig. 7A). Furthermore, a functional assay of iron uptake from diferric transferrin by the TfR demonstrated a nearly identical reduction of iron uptake in FHsiRNA-transfected cells (almost 40%, Fig. 7B). These results indicate that FHsiRNA treatment increased iron availability, which explains why L-chain ferritin synthesis increased in these cells. FLsiRNA had no effect on either TfR levels or iron uptake in the LECs.
Figure 7.
Effect of siRNA knockdown of ferritin H- and L-chain on transferrin receptor and iron uptake in LECs. (A) TfR Western blot. Twenty-four hours after transfection with a nontargeting control, FHsiRNA, or FLsiRNA, the cells were rinsed and incubated in serum-free MEM for 24 hours. After lysis in RIPA buffer and centrifugation, supernatants were concentrated on centrifugal filtering columns. Twenty-five micrograms of protein from each sample was loaded onto an 8% denaturing Tris-tricine gel, along with 6 μg of purified human placenta TfR as the positive control. Transferrin receptor was detected after Western transfer using a monoclonal mouse anti-human TfR, a secondary HRP antibody and ECL. Blots were reprobed with a 1:500 dilution of HRP-goat anti-human β-actin which was used as a loading control. The blot shown is representative of three experiments and data expressed as the mean ± SEM. *Significantly different from control (P < 0.01); ANOVA and Tukey's test. (B) Iron uptake. Transfected cells were incubated with 240 μg/mL 59Fe-Tf for 20 hours in serum-free DMEM, lysates prepared, and radioactivity counted in the cytosol fraction using a gamma counter. Radioactivity in each sample was normalized to protein and data are expressed as a percentage of control cells transfected with nontargeting siRNA. Data are shown as the mean ± SEM of eight samples. *Significantly different from control (P < 0.05); ANOVA and Tukey's test.
Cystine Uptake and GSH Levels in Differentially Transfected LECs
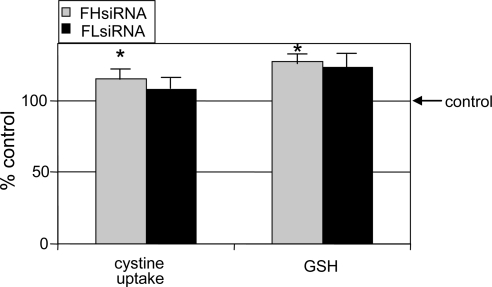
As we recently demonstrated, increased intracellular iron availability increased cystine uptake by the glutamate/cystine antiporter with a concomitant increase in GSH concentration in LECs.18 In the present study, the amount of available iron in the LIP was increased by FHsiRNA transfection. This increase was confirmed by a decrease in the amount of 59Fe found in ferritin (Fig. 6), a decrease in the level of TfR in LECs (Fig. 7A), and decreased 59Fe-transferrin uptake by LECs (Fig. 7B). Levels of TfR are generally considered a reflection of cellular iron status. Indeed, FHsiRNA treatment caused a significant increase in cystine uptake and GSH concentration in LECs, as would be expected in the presence of increased intracellular iron (Fig. 8). In contrast, 4 days after FLsiRNA transfection, there was no significant change in either cystine uptake or GSH levels in LECs.
Figure 8.
Effect of ferritin H- and L-chain siRNA on cystine uptake and GSH concentration 4 days after transfection. LECs were transfected with either nontargeting control, FHsiRNA, or FLsiRNA, lysed, and intracellular GSH measured in the lysates. In a parallel set of experiments, l-35S-cystine uptake was then determined. Data are expressed as a percentage of control cells transfected with nontargeting siRNA. Histograms represent the mean ± SEM of at least four samples. *Significantly different from control (P < 0.01); ANOVA and Tukey's test.
Concentration of VEGF in Conditioned Medium of Differentially Transfected LECs
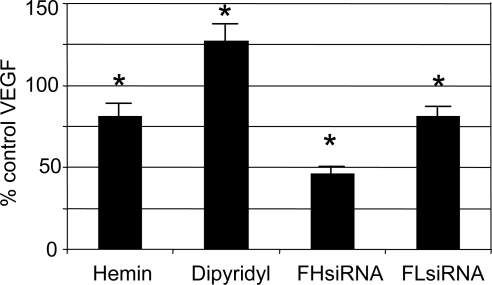
Iron is a key regulator of the activity of the transcription factor, HIF-1.20 HIF-1 regulates production of numerous proteins, including VEGF (Fig. 1). In the present study, excess iron, added in the form of hemin, decreased VEGF, whereas the iron chelator dipyridyl increased VEGF accumulation in the CCM of cultured LECs (Fig. 9). Not surprisingly, FHsiRNA, which increased intracellular iron availability in LECs, significantly decreased the amount of HIF-1α movement into the nucleus by 50%, compared with the control (P < 0.002, n = 4). FHsiRNA also decreased VEGF accumulation in the CCM by approximately 60% (Fig. 9). FLsiRNA had no effect on HIF-1α levels in the nucleus, but caused a small decrease in VEGF accumulation in CCM.
Figure 9.
Effect of iron, iron chelation, FHsiRNA, and FLsiRNA on VEGF accumulation in LEC conditioned medium. LECs were transfected, and 4 days after transfection, VEGF was measured in the CCM. In a parallel set of experiments, nontransfected cells (LECs) were grown to confluence and treated with iron in the form of hemin (1.5 μM) or an iron chelator, dipyridyl (0.3 mM), in serum-free medium for 6 hours. VEGF accumulation in the CCM was determined. Data are expressed as a percentage of VEGF in the CCM of control cells for each respective experiment. *Significantly different from control, P < 0.05, ANOVA and Tukey's test.
Discussion
The multimeric protein, ferritin, is responsible for the safe storage of iron within cells. Ferritin H-chain has ferroxidase activity that facilitates deposition of iron into the ferritin core, whereas ferritin L-chain is thought to facilitate the consolidation of the core.21 The ratio of ferritin H- and L-chains is tissue specific and significantly affects the ability of cells to store and retrieve iron.22
Overexpression of ferritin H- and L-chains was initially used to alter the H:L ratio in several different cell types, allowing for the study of the physiological importance of differences in the composition of this protein. The results of these studies indicate that overexpression of ferritin H-chain increased iron storage in ferritin, decreased the size of the LIP,7,8,23 protected the cells against damage from ultraviolet light or hydrogen peroxide exposure7,8 and was antiapoptotic.24 Overexpression of ferritin L-chain did not significantly affect intracellular iron distribution and was not protective against oxidative stress.7
Overexpression of ferritin L-chain occurs naturally in hereditary hyperferritinemia cataract syndrome (HHCS).25 In this dominantly inherited syndrome, patients have a mutation in the regulatory element of ferritin L-chain mRNA which results in its constitutive synthesis. As a result, high levels of L-chain-rich ferritin accumulate in tissues, including the lens. However, this L-chain-rich ferritin has little, if any, iron sequestered.26 Indeed, iron homeostasis is apparently unaffected in HHCS patients in whom L-chain ferritin is overexpressed. The only tissue adversely affected by ferritin accumulation is the lens, which becomes cataractous as early as during infancy. This effect is most likely due to aggregation of overexpressed ferritin subunits. Of note, constitutive downregulation of L-chain synthesis in a patient with a mutation in the L-chain ferritin start codon had no measurable effect on iron metabolism.27 Taken together, these observations lead to the conclusion that even dramatic alterations in L-chain ferritin synthesis have no significant effect on iron metabolism. Despite the fact that ferritin L- and H-chains are very similar in structure, there are no known naturally occurring mutations in the H-chain ferritin gene that modify ferritin expression.
Experimentally, the H:L ratio can be altered by using siRNA specific for each of the subunits. Indeed, transfection of HeLa cells with siRNA for H- or L-chain ferritin far more effectively reduced ferritin chain synthesis than did antisense treatment.9 In this earlier study, FLsiRNA had no direct effect on cellular iron homeostasis but enhanced cellular proliferation. On the other hand, FHsiRNA treatment made cells less resistant to iron supplementation and chelation. It was concluded that H-chain ferritin functions as an iron buffer, controlling the level of potentially redox-active iron.
In our present study, treatment of cultured canine LECs with siRNA custom-made to canine ferritin H- and L-chains, very effectively decreased synthesis of each chain. Quantitation of FH and FL mRNA revealed no off-target effects of either siRNA on the mRNA of the other chain. In an interesting finding, FHsiRNA or FLsiRNA significantly altered the de novo synthesis of the other chain and the iron storage ability/capacity of ferritin. For example, FHsiRNA decreased ferritin H-chain synthesis by 50%, but also caused a dramatic increase in L-chain synthesis and completely blocked degradation of both chains. As a result, there was a 500-fold increase in the accumulation of ferritin in the LECs. This accumulation of ferritin, which had a very high L:H ratio, reduced the intracellular storage capacity for iron and likely increased the size of the LIP. Increased availability of iron has been reported to block lysosomal degradation of proteins in RPE cells28 and ferritin degradation specifically.29 This mechanism may be an important protective one to increase iron storage capacity, since iron stored in ferritin does not catalyze damaging reactions.
We found large amounts of L-chain ferritin accumulated within lysosomes of some LECs in which ferritin L-chain expression was increased (FHsiRNA treatment). However, some was also found free in the cytoplasm or within inclusion bodies that did not colocalize with lysosomes. These nonlysosomal, ferritin-containing structures may be similar to those observed when L-chain ferritin was overexpressed in transfected LECs.5 The presence of a portion of L-chain ferritin in lysosomes suggests that “normal” lysosome-mediated degradation was occurring in LECs. However, it did not reveal any information as to the rate of degradation or whether degradation is blocked after ferritin enters the lysosome. In some of the cells, the largest lysosomes contained the largest amounts of ferritin, which may reflect an attempt to degrade the bulk of excess ferritin L-chain induced by FHsiRNA transfection. The resulting increase in intracellular iron availability as well as perturbation of “normal” iron dynamics in the cell may reduce the efficiency of ferritin turnover in lysosomes. Since L-chain-specific antibodies used for immunofluorescence label L-chains in assembled ferritin (“normal” or L-rich) as well as free L-chains, we cannot determine whether any specific form predominates in the lysosome compared with the cytoplasm.
The inhibitory effect of FLsiRNA on H-chain synthesis is quite intriguing, especially since we demonstrated that FLsiRNA had no effect on FH mRNA levels. FLsiRNA decreased de novo synthesis of both L- and H-chain ferritin, thereby decreasing total ferritin levels in these cells. This decrease in total ferritin occurred despite the fact that FLsiRNA blocked the degradation of H-chain ferritin. In an earlier study of LECs transfected with H- or L-chain ferritin expression vectors,4,5 we hypothesized that LECs strictly control H-chain ferritin levels by secreting or degrading this chain when insufficient L-chain ferritin is available to form heteropolymeric ferritin. The results of the present study indicate that FLsiRNA reduced L-chain ferritin availability. The decreased availability would increase H-chain ferritin secretion, lowering levels of newly synthesized (labeled) ferritin, and reduce total ferritin concentration in the LECs. A significant decrease in de novo synthesis of L-chain ferritin may initially increase the H:L-chain ratio and would favor increased incorporation of iron into ferritin (as seen at day 2). However, by day 4, due to persistent reduced availability of newly synthesized H-chain ferritin, the H:L ratio may have stabilized to the extent that iron incorporation into ferritin was no longer different from that in the control.
Ferritin synthesis, TfR levels, and iron uptake from Tf are recognized indices of iron availability and the size of the redox-active LIP. Expression of proteins involved in iron metabolism such as ferritin and TfR are regulated at the translational level by iron, since iron dictates the activity of the cytoplasmic iron regulatory protein (IRP). In iron depleted cells, the IRP can bind to ferritin mRNA and block its translation. In contrast, IRP binding to TfR mRNA stabilizes it and increases TfR synthesis.30 Therefore a decrease in TfR expression reflects an increase in iron availability. IRP contains an iron sulfur cluster. In cells with a sufficient amount of iron, IRP does not bind to mRNAs, but functions as a cytosolic aconitase. We have shown that when IRP functions as an aconitase (i.e., under conditions of adequate iron availability) it regulates production of glutamate.17 This regulatory system makes sense from a physiological perspective, because cells that are iron-replete do not need more iron. In fact they must decrease iron uptake to avoid the damaging consequences of excess iron, which include damaging free radical reactions.
The results of our present study indicate that the IRP regulatory system functions as expected. FHsiRNA-treated LECs exhibited increased iron availability as measured by decreases in TfR levels, iron uptake from Tf, and iron incorporation into ferritin in LECs. After FHsiRNA treatment, the LECs contained two pools of iron-labeled ferritin with different mobilities. The lower mobility (upper) band was mainly composed of L-chain ferritin, perhaps only L-chain (data not shown). This finding is not surprising since L-chain ferritin is present in huge excess and is less acidic than ferritin H-chain. Therefore, it has a lower electrophoretic mobility. The low level of iron in both bands is consistent with the low iron storage ability of L-chain rich ferritin.
De novo ferritin synthesis and ferritin degradation maintain the level of total ferritin within cells. A 500-fold increase of total ferritin in FHsiRNA-treated LECs after 4 days is much larger than the effects on de novo synthesis and degradation would indicate. However, the very long half-life of this protein and different ways of measuring ferritin synthesis and total content makes it difficult or impossible to make quantitative comparisons. Measurement of de novo synthesis and degradation require not only interaction of primary antibodies with ferritin; but also additional steps: isolation of antigen-antibody complexes, several washes, gel electrophoresis, and autoradiography. Therefore, only newly synthesized, 35S-labeled ferritin is detected and it is possible that not all newly synthesized ferritin was captured or detected under these conditions. In contrast, determination of total ferritin concentration by ELISA would capture most, if not all ferritin in the cell lysate, including previously synthesized, nondegraded ferritin. Considering the long half-life of this protein, as well as the decrease in degradation rate resulting from siRNA treatment, it would be expected that the ELISA results would differ greatly from the de novo synthesis data.
Clearly, the alteration of ferritin subunit synthesis and ultimately the H:L ratio in a complete ferritin molecule significantly changes intracellular iron dynamics. Our results indicate that these alterations probably affect the binding activity of the IRP and its aconitase activity. We have demonstrated in other work that regulation of aconitase activity by iron has important downstream effects on glutamate synthesis, cystine uptake, and GSH levels in both LECs and RPE cells.17,18 As expected, increased iron availability caused by FHsiRNA significantly increased cystine uptake and GSH levels in LECs.
Iron is also important in regulation of VEGF production (Fig. 1) through its effects on HIF-1, which regulates VEGF synthesis at the transcriptional level. An increase in iron levels increases HIF-1α degradation and therefore decreases its movement into the nucleus, where it combines with HIF-1β to form the heterodimer transcription factor HIF-1. HIF-1 controls the synthesis of dozens of proteins, including VEGF. FHsiRNA decreased HIF-1α levels in the nuclei of LECs as well as VEGF accumulation in the CCM, which is consistent with its ability to increase intracellular iron availability. FLsiRNA had no effect on HIF-1α levels in LECs nuclei, but did have a small effect on VEGF secretion. The reasons for this are unclear; however, they may be consistent with FLsiRNA's effect in reducing ferritin H-chain levels or may be related to the different time points at which the measurements were made.
The ability of cells to regulate the ferritin H:L chain ratio is essential for control of iron metabolism as well as the downstream regulation of the critical intracellular antioxidant GSH. Furthermore, secretion of VEGF is also affected by alterations in the ferritin H:L ratio. Although the role of VEGF in the lens is unknown, this growth factor plays critical roles in the physiology and pathology of the retina. The results of the current investigation suggest that there are potentially important relationships between intracellular iron metabolism and VEGF and clearly warrant further investigation. It is clear from the present study that maintenance of cell-type–specific ferritin H:L ratio is critical for cellular homeostasis, since this ratio governs cellular iron availability and the multitude of essential processes dependent on iron, including increasing the level of the antioxidant GSH, which can protect cells against iron catalyzed free radical reactions.
Footnotes
Supported by National Institutes of Health Grant EY04900 and Funds from the State of North Carolina.
Disclosure: J. Harned, None; J. Ferrell, None; M.M. Lall, None; L.N. Fleisher, None; S. Nagar, None; M. Goralska, None; M.C. McGahan, None
References
- 1.Harrison PM, Arosio P. The ferritins: molecular properties, iron storage function and cellular regulation. Biochim Biophys Acta. 1996;1275:161–203 [DOI] [PubMed] [Google Scholar]
- 2.Iwasaki K, Hailemariam K, Tsuji Y. PIAS3 interacts with ATF1 and regulates human ferritin H gene through an antioxidant responsive element. J Biol Chem. 2007;282:22335–22343 [DOI] [PMC free article] [PubMed] [Google Scholar]
- 3.Hentze MW, Muckenthaler MU, Andrews NC. Balancing acts: molecular control of mammalian iron metabolism. Cell. 2004;117:285–297 [DOI] [PubMed] [Google Scholar]
- 4.Goralska M, Holley BL, McGahan MC. Identification of a mechanism by which lens epithelial cells limit accumulation of overexpressed H-chain ferritin. J Biol Chem. 2003;278:42920–42926 [DOI] [PubMed] [Google Scholar]
- 5.Goralska M, Nagar S, Fleisher LN, McGahan MC. Differential degradation of ferritin H- and L-chains: accumulation of L-chain-rich ferritin in lens epithelial cells. Invest Ophthalmol Vis Sci. 2005;46:3521–3529 [DOI] [PubMed] [Google Scholar]
- 6.Picard V, Renaudie F, Porcher C, Hentze MW, Grandchamp B, Beaumont C. Overexpression of the ferritin H subunit in cultured erythroid cells changes the intracellular iron distribution. Blood. 1996;87:2057–2064 [PubMed] [Google Scholar]
- 7.Goralska M, Holley BL, McGahan MC. Overexpression of H and L ferritin subunits in lens epithelial cells alters Fe metabolism and cellular response to UVB irradiation. Invest Ophthalmol Vis Sci. 2001;42:1721–1727 [PubMed] [Google Scholar]
- 8.Cozzi A, Corsi B, Levi S, Santambrogio P, Albertini A, Arosio P. Overexpression of wild type and mutated human ferritin H-chain in HeLa cells: in vivo role of ferritin ferroxidase activity. J Biol Chem. 2000;275:25122–25129 [DOI] [PubMed] [Google Scholar]
- 9.Cozzi A, Corsi B, Levi S, Santambrogio P, Biasiotto G, Arosio P. Analysis of the biologic functions of H- and L-ferritins in HeLa cells by transfection with siRNAs and cDNAs: evidence for a proliferative role of L-ferritin. Blood. 2004;103:2377–2383 [DOI] [PubMed] [Google Scholar]
- 10.Goralska M, Fleisher LN, McGahan MC. Ferritin H- and L-chains in fiber cells from canine and human lenses of different ages. Invest Ophthalmol Vis Sci. 2007;48:3968–3975 [DOI] [PubMed] [Google Scholar]
- 11.Aung W, Hasegawa S, Furukawa T, Saga T. Potential role of ferritin heavy chain in oxidative stress and apoptosis in human mesothelial and mesothelioma cells: implications for asbestos-induced oncogenesis. Carcinogenesis. 2007;28(9):2047–2052 [DOI] [PubMed] [Google Scholar]
- 12.Bruick RK, McKnight SL. A conserved family of prolyl-4-hydroxylases that modify HIF. Science. 2001;294:1337–1340 [DOI] [PubMed] [Google Scholar]
- 13.Epstein ACR, Gleadle JM, McNeill LA, et al. C. elegans EGL-9 and mammalian homologs define a family of dioxygenases that regulate HIF by prolyl hydroxylation. Cell. 2001;107:43–54 [DOI] [PubMed] [Google Scholar]
- 14.Forsythe JA, Jiang B-H, Iyer NV, et al. Activation of vascular endothelial growth factor gene transcription by hypoxia-inducible factor 1. Mol Cell Biol. 1996;16:4604–4613 [DOI] [PMC free article] [PubMed] [Google Scholar]
- 15.Liu Y, Cox SR, Morita T, Kourembanas S. Hypoxia regulates vascular endothelial growth factor gene expression in endothelial cells. Circ Res. 1995;77:638–643 [DOI] [PubMed] [Google Scholar]
- 16.Shui Y-B, Wang X, Hu JS, et al. Vascular endothelial growth factor expression and signaling in the lens. Invest Ophthalmol Vis Sci. 2003;44:3911–3919 [DOI] [PubMed] [Google Scholar]
- 17.McGahan MC, Harned J, Mukunnemkeril M, Goralska M, Fleisher LN, Ferrell JB. Iron alters glutamate secretion by regulating cytosolic aconitase activity. Am J Physiol Cell Physiol. 2005;288:C1117–C1124 [DOI] [PubMed] [Google Scholar]
- 18.Lall MM, Ferrell JB, Nagar S, Fleisher LN, McGahan MC. Iron regulates L-glutamate secretion, Xc− activity and glutathione levels in lens epithelial and retinal pigment epithelial cells by its effect on cytosolic aconitase. Invest Ophthalmol Vis Sci. 2008;49:310–319 [DOI] [PubMed] [Google Scholar]
- 19.Goralska M, Harned J, Fleisher LN, McGahan MC. The effect of ascorbic acid and ferric ammonium citrate on iron uptake and storage in lens epithelial cells. Exp Eye Res. 1998;66:207–215 [DOI] [PubMed] [Google Scholar]
- 20.Chong TW, Horwitz LD, Moore JW, Sowter HM, Harris AL. A mycobacterial iron chelator, desferri-exochelin, induces hypoxia-inducible factors 1 and 2, NIP3 and vascular endothelial growth factor in cancer cell lines. Cancer Res. 2002;62:6924–6927 [PubMed] [Google Scholar]
- 21.Santambrogio P, Levi S, Cozzi A, Rovida E, Albertini A, Arosio P. Production and characterization of recombinant heteropolymers of human ferritin H and L chains. J Biol Chem. 1993;268:12744–12748 [PubMed] [Google Scholar]
- 22.MacKenzie EL, Iwasaki K, Tsuji Y. Intracellular iron transport and storage: from molecular mechanisms to health implications. Antioxidants Redox Signal. 2008;10:997–1030 [DOI] [PMC free article] [PubMed] [Google Scholar]
- 23.Epsztejn S, Glickstein H, Picard V, et al. H-ferritin subunit overexpression in erythroid cells reduces the oxidative stress response and induces multidrug resistance properties. Blood. 1999;94:3593–3603 [PubMed] [Google Scholar]
- 24.Cozzi A, Levi S, Santambrogio P, Campanella A, Gerardi G, Arosio P. Role of iron and ferritin in TNFα-induced apoptosis in HeLa cells FEBS Lett 2003;537:187–192 [DOI] [PubMed] [Google Scholar]
- 25.Girelli D, Corrocher R, Bisceglia L, et al. Molecular basis for the recently described hereditary hyperferritinemia-cataract syndrome: a mutation in the iron-responsive element of ferritin L-subunit gene (the “Verona mutation”). Blood. 1995;86:4050–4053 [PubMed] [Google Scholar]
- 26.Levi S, Girelli D, Perrone F, et al. Analysis of ferritins in lymphoblastoid cell lines and in the lens of subjects with hereditary hyperferritinemia-cataract syndrome. Blood. 1998;91:4180–4187 [PubMed] [Google Scholar]
- 27.Cremonesi L, Cozzi A, Girelli D, et al. Case report: a subject with a mutation in the ATG start codon of L-ferritin has no haematological or neurological symptoms. J Med Genet. 2004;41:e81. [DOI] [PMC free article] [PubMed] [Google Scholar]
- 28.Chen H, Lukas TJ, Du N, Suyeoka G, Neufeld AH. Dysfunction of the retinal pigment epithelium with age: increased iron decreases phagocytosis and lysosomal activity. Invest Ophthalmol Vis Sci. 2009;50(4):1895–1902 [DOI] [PubMed] [Google Scholar]
- 29.Truty J, Malpe R, Linder MC. Iron prevents ferritin turnover in hepatic cells. J Biol Chem. 2001;276:48775–48780 [DOI] [PubMed] [Google Scholar]
- 30.Pantopoulos K. Iron metabolism and the IRE/IRP regulatory system: an update. Ann NY Acad Sci. 2004;1012:1–13 [DOI] [PubMed] [Google Scholar]


