Abstract
Prior work indicated that SERT inhibitors competitively inhibit substrate-induced [3H]5-HT release, producing rightward shifts in the substrate-dose response curve and increasing the EC50 value without altering the EMAX. We hypothesized that this finding would not generalize across a number of SERT inhibitors and substrates, and that the functional dissociation constant (Ke) of a given SERT inhibitor would not be the same for all tested substrates. To test this hypothesis, we utilized a well characterized [3H]5-HT release assay that measures the ability of a SERT substrate to release preloaded [3H]5-HT from rat brain synaptosomes. Dose-response curves were generated for six substrates (PAL-287 [naphthylisopropylamine], (+)-fenfluramine, (+)-norfenfluramine, mCPP [meta-chlorophenylpiperazine], (±)-MDMA, 5-HT) in the absence and presence of a fixed concentration of three SERT inhibitors (indatraline, BW723C86, EG-1-149 [4-(2-(benzhydryloxy)ethyl)-1-(4-bromobenzyl)piperidine oxalate]). Consistent with simple competitive inhibition, all SERT inhibitors increased the EC50 value of all substrates. However, in many cases a SERT inhibitor decreased the EMAX value as well, indicating that in the presence of the SERT inhibitor the substrate became a partial releaser. Moreover, the Ke values of a given SERT inhibitor differed among the six SERT substrates, indicating that each inhibitor/substrate combination had a unique interaction with the transporter. Viewed collectively, these findings suggest that it may be possible to design SERT inhibitors that differentially regulate SERT function.
Introduction
The biogenic amine transporters for dopamine (DAT), norepinephrine (NET) and serotonin (SERT), are important targets for a wide range of medications used to treat psychiatric conditions such as anxiety, depression, obsessive compulsive disorder (Gorman and Kent, 1999; Zohar and Westenberg, 2000) and stimulant dependence (Grabowski et al., 2004; Rothman et al., 2008; Rothman et al., 2006). Transporter ligands generally interact with these proteins in two distinct ways. Reuptake inhibitors bind to transporter proteins but are not transported. These drugs elevate extracellular concentrations of transmitter by blocking transporter-mediated uptake of transmitters (substrates) from the synapse. Substrate-type releasers bind to transporter proteins and are subsequently transported into the cytoplasm of nerve terminals, releasing neurotransmitter via a process originally described as carrier mediated exchange (Rothman and Baumann, 2006; Rudnick and Clark, 1993). Although the term “carrier mediated exchange” accurately describes the overall process, the mechanism by which a substrate induces release of neurotransmitter is more complex than a simple exchange of substrate for neurotransmitter. More recent studies of the dopamine transporter have shown, for example, that the inward transport of a substrate like amphetamine induces an inward current of sodium, which increases the concentration of internal cellular sodium at the transporter, thereby facilitating reverse transport of dopamine (Goodwin et al., 2008; Pifl et al., 2009).
For many years, our lab has utilized an in vitro assay system that measures substrate-induced [3H]neurotransmitter release. As described in detail elsewhere (Rothman et al., 2001), rat brain synaptosomes are preloaded with [3H]neurotransmitter. After steady state is achieved, test drugs are then added and the samples are filtered at a set time afterward. The amount of released [3H]neurotransmitter is calculated as the difference between radioactivity remaining on the filter in the absence and presence of the test drug. This method permits the pharmacological evaluation of both substrates and reuptake inhibitors. Substrate dose-response curves are generated and fit to a dose-response equation for an EC50 and EMAX value, where the EMAX is the maximal percent release (typically 100%). Reuptake inhibitors, which do not induce release, shift the substrate dose-response curve to the right, thereby increasing the EC50 without changing the EMAX value. Based on the shift in the dose-response curve, it is possible to calculate a functional KI value for the reuptake inhibitor (Ke value). In studies conducted to date, substrates and reuptake inhibitors have behaved in a manner consistent with simple competitive models. For example, in the case of [3H]5-HT release (Rothman et al., 2000), 3 nM and 15 nM indatraline shifted the methamphetamine and MDMA (3,4-methylenedioxyamphetamine) dose-response curves progressively to the right without changing the EMAX values. Moreover, the calculated Ke values of indatraline were similar for both substrates and for both concentrations of indatraline (~ 3 nM), and agreed well with the IC50 value for indatraline-induced inhibition of [3H]5-HT uptake (3.1 nM). Similar results were observed for the substrate (+)-fenfluramine and the uptake inhibitor fluoxetine (Rothman et al., 2001).
Much as G protein coupled receptors (GPCR) can adopt various conformations that can result in differing secondary effects (Kenakin, 2003), it is now recognized that transporters can also adopt different functionally significant conformational states (Ferrer and Javitch, 1998; Gether et al., 2006; Reith et al., 2001). Recently, we reported evidence consistent with this. Certain allosteric modulators of the DAT reduced the EMAX value for D-amphetamine-induced DAT-mediated release of [3H]MPP+, while producing minimal increases in the EC50 value (Rothman et al., 2009). Stated somewhat differently, the allosteric modulators modulated the efficacy of substrate-induced DAT-mediated release of [3H]MPP+. Based on these findings and some initial experiments, we hypothesized that substrates and reuptake inhibitors might not always interact with transporters in a manner consistent with simple competitive models. Therefore we tested the hypothesis, in the [3H]5-HT release assay, that simple competitive interactions would not be observed with a number of different SERT inhibitors and substrates, and that the functional dissociation constant (Ke) of a given SERT inhibitor would not be the same for across all tested substrates. The data we obtained support this hypothesis.
Methods
Animals
Male Sprague-Dawley rats, purchased from Charles River Laboratories (Wilmington, MA), weighing 300–400 g were group-housed (lights on: 0700–1900 h) with food and water freely available. Rats were maintained in facilities accredited by the American Association of the Accreditation of Laboratory Animal Care, and the procedures described herein were carried out in accordance with the Animal Care and Use Committee of the National Institute on Drug Abuse (NIDA) Intramural Research Program (IRP).
In vitro release assays
Transporter-mediated release assays for SERT were carried out as previously described with minor modifications (Rothman et al., 2003). Rats were sacrificed by CO2 asphyxiation. Tissue from whole brain minus caudate was homogenized in ice-cold 10% sucrose containing 1 μM reserpine. For SERT-mediated release assays, [3H]5-HT was used as the radiolabeled substrate and 100 nM nomifensine and 50 nM GBR12935 were added to the sucrose solution to prevent any possible uptake of [3H]5-HT into NE and DA nerve terminals. Synaptosomal preparations were incubated to steady state with 5 nM [3H]5-HT (60 min) in Krebs-phosphate buffer (pH 7.4), plus 1 μM reserpine. Subsequently, 850 μl of synaptosomes preloaded with [3H]5-HT were added to polystyrene test tubes that contained 150 μl of test drug in assay buffer plus 1 mg/ml BSA. After 5 min the release reaction was terminated by dilution with 4 ml wash buffer followed by rapid vacuum filtration. Nonspecific values were measured by incubations in the presence of 100 μM tyramine. The retained tritium was counted by a Trilux liquid scintillation counter (PerkinElmer, Shelton, CT). In these assays, 100% percent release was defined as the [3H]5-HT released by 100 μM tyramine.
Neurotransmitter uptake assays
[3H]5-HT uptake inhibition assays were conducted as described elsewhere (Rothman et al., 2001). Freshly removed whole brain minus caudate were homogenized in 10% ice-cold sucrose with 12 strokes of a hand-held Potter-Elvehjem homogenizer followed by centrifugation at 1000 × g for 10 min. The supernatants were used immediately. The assay buffer used was Krebs-phosphate buffer containing 154.4 mM NaCl, 2.9 mM KCl, 1.1 mM CaCl2, 0.83 mM MgCl2, 5 mM glucose, 1 mg/ml ascorbic acid, and 50 μM pargyline. Nonspecific uptake was measured by incubating in the presence 1 μM indatraline. The reactions were stopped after 30 min by filtering with a Brandel cell harvester over Whatman GF/B filters presoaked in wash buffer (10 mM Tris/HCl, pH 7.0). Retained tritium was measured with a Topcount liquid scintillation counter (PerkinElmer, Shelton, CT).
Data analysis and statistics
For the release assay and uptake inhibition assays, dose-response curves were generated using 8–10 concentrations of test drug. The data from three experiments, expressed as percent inhibition, were then fit to a dose-response curve model: Y (% inhibition) = EMAX × ([D]/([D] + EC50) for the best fit estimates of the EMAX and EC50 using either KaleidaGraph version 3.6 or MLAB-PC (Nightingale et al., 2005). Graphs were generated with KaleidaGraph 3.6 software. To determine if the EMAX value of each substrate was significantly changed compared to control, we used an EMAX set to 100±5 (SD). To arrive at the SD of 5, we determined mean of the coefficient of variation of the EMAX values (SD/EMAX) of the control curves in Table 1, and multiplied this by 100. The mean value (±SD) was 3.4±2.0. Thus, the value we used (5) was chosen to be a conservative estimate of the SD. The data were analyzed by ANOVA with the post-hoc Bonferroni’s multiple comparison test. In release experiments, the functional Ke of SERT inhibitors was calculated according to the following formula: Ke = [DRUG]/(EC502/EC501 −1) where EC501 is the EC50 in the absence of drug and EC502 is the EC50 in the presence of drug.
Table 1.
Effect of SERT Inhibitors on Substrate-Induced [3H]5-HT Release
| DRUG | CONTROL EC50 (nM±SD) EMAX (%±SD) |
5 μM BW723C86 EC50 (nM±SD) EMAX (%±SD |
25 μM BW723C86 EC50 (nM±SD) EMAX (%±SD) |
25 nM Indatraline EC50 (nM±SD) EMAX (%±SD) |
15 μM EG-1-149 EC50 (nM±SD) EMAX (%±SD) |
|---|---|---|---|---|---|
| PAL-287 | 6.4±0.8 88±3 %* (N=3) |
65±33 59±6 %†† (N=3) |
39±19 74±7 %† (N=3) |
141±39 52±3 %†† (N=3) |
|
| (+)-fenfluramine | 56±12 100±6 % (N=3) |
361±142 67±5 %†† (N=3) |
648±94 104±4 % (N=3) |
770±281 69±7 %†† (N=3) |
|
| mCPP | 39±2 91±1 %* (N=17) |
102±42 54±4 %†† (N=5) |
>100000 indeterminate (N=9) |
131±45 68±4 %†† (N=3) |
126±44 47±3 %†† (N=3) |
| (±)-MDMA | 88±10 105±4 % (N=3) |
2820±800 85±6 %† (N=3) |
2024±497 114±10 % (N=3) |
362±174 53±6 %†† (N=3) |
|
| (+)-Norfenfluramine1 | 101±16 113±6 %* (N=9) |
1091±474 63±6 %†† (N=3) |
840±157 100±5 %† (N=3) |
623±9 378±2%†† (N=9) |
|
| 5-HT (N=6) | 23±1 85±1 %* (N=6) |
1458±773 80±12 % (N=6) |
87±21 87±4 % (N=6) |
218±54 80±4 % (N=6) |
Each value is ±SD.
p< 0.05 when compared to a theoretical EMAX = 100±5 (ANOVA with the post-hoc Bonferroni’s multiple comparison test).
(p<0.05) or
(p<0.01) (when compared to the substrate alone (control) (ANOVA with the post-hoc Bonferroni’s multiple comparison test). At the concentrations used, the SERT inhibitors did not significantly alter [3H]5-HT release.
Chemicals
BW723C86 (α-methyl-5-(2-thienylmethoxy)-1H-indole-3-ethanamine) and SB204741 (N-(1-Methyl-1H-indol-5-yl)-N′-(3-methylisothiazol-5-yl)urea) were purchased from Tocris (Ellisville, MO). Indatraline was purchased from RBI (Natick, MA). EG-1-149 (4-(2-(Benzhydryloxy)ethyl)-1-(4-bromobenzyl)piperidine oxalate) was synthesized as described for compound 17 in (Greiner et al., 2003). PAL-287 (naphthylisopropylamine) was synthesized as described (Rothman et al., 2005).
Results
BW723C86 is a potent and relatively selective 5-HT2B receptor agonist, though it is not selective for the human 5-HT2B receptor (Knight et al., 2004). Our use of this compound as a SERT uptake inhibitor therefore requires explanation. Based on reports that MDMA-induced release of 5-HT is dependent on activation of 5-HT2B receptors in mice (Doly et al., 2008), we conducted initial experiments to determine if MDMA-induced release of [3H]5-HT could be altered by either a 5-HT2B agonist (BW723C86) or a 5-HT2B antagonist (SB204741). As reported in Fig. 1, high concentrations (1 μM) of BW723C86 or SB204741 shifted the MDMA dose-response to the right (3–4 fold) without altering the EMAX values. These findings prompted us to determine the IC50 values of these compounds, and other selected compounds, for inhibiting [3H]5-HT uptake (Fig. 2). The results indicated that BW723C86 was a low potency SERT uptake inhibitor (IC50 = 1855±280 nM). SB204741 had even lower potency as a SERT inhibitor than BW723C86 (IC50 = 38,000±7200 nM). These data suggested that the effect of BW723C86 and SB204741 on MDMA-induced release of [3H]5-HT result from SERT blockade rather than actions at the 5-HT2B receptor.
Figure 1.
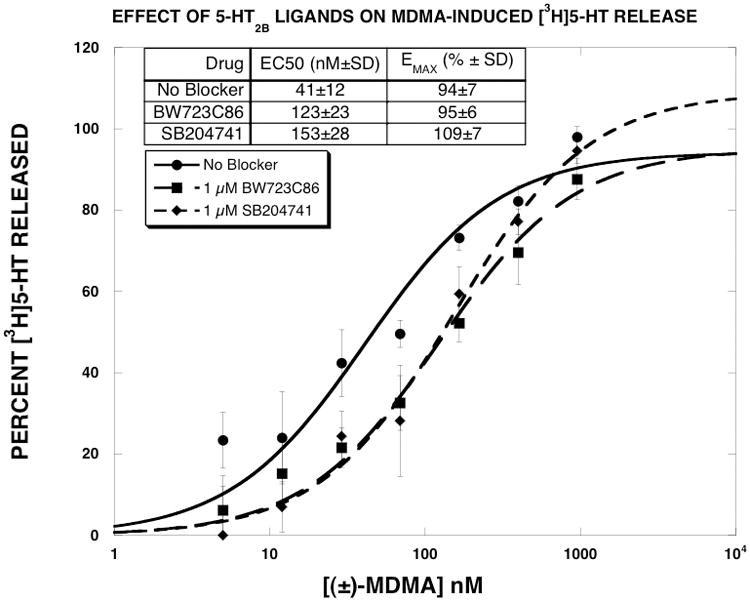
Effect of 5-HT2B receptor ligands on MDMA-induced [3H]5-HT release. MDMA dose-response curves were generated as described in methods. The data of three experiments, expressed as percent [3H]5-HT released, were fit to the dose-response equation for the best fit estimates of the EMAX and EC50 using KaleidaGraph. Each value is the mean±SEM (n=3).
Figure 2.
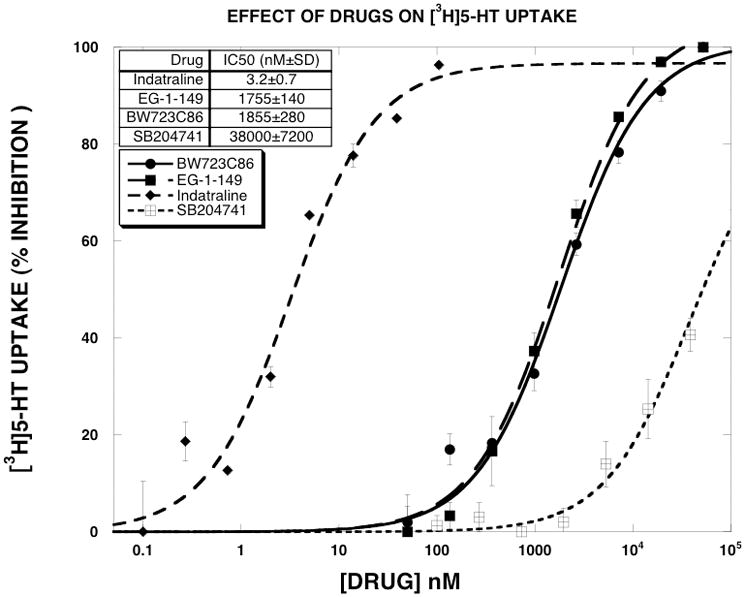
Effect of SERT inhibitors on [3H]5-HT uptake. Dose-response curves were generated as described in methods. The data of three experiments, expressed as percent inhibition, were fit to the dose-response equation for the best fit estimates of the EMAX and EC50 using KaleidaGraph. The EC50 values are reported in the Results section. Each value is the mean±SEM (n=3).
Since exploratory experiments indicated that indatraline, a classic high affinity SERT inhibitor, and BW723C86, a low affinity SERT inhibitor, differentially shifted substrate-induced [3H]5-HT release, we decided to include in this study another low affinity SERT inhibitor. We chose EG-1-149 (4-(2-(benzhydryloxy)ethyl)-1-(4-bromobenzyl)piperidine oxalate), which was reported to have the following IC50 values in reuptake inhibition assays: DAT (5.1±0.4 nM), SERT (2570±179), NET (479±68) (Greiner et al., 2003). The high and low potency of indatraline and EG-1-149 for SERT uptake inhibition was confirmed here (Fig. 2), where the observed IC50 values were 3.2±0.7 and 1755±140 nM, respectively. BW723C86 and EG-1-149 had similar potency as inhibitors of [3H]5-HT uptake.
In the next series of experiments, dose-response curves were generated for six substrates (PAL-287, (+)-fenfluramine, (+)-norfenfluramine, mCPP, (±)-MDMA, 5-HT) in the absence and presence of a fixed concentration of three SERT inhibitors (indatraline [25 nM], BW723C86 [25 μM], EG-1-149 [15 μM]). Fig. 3 shows the results obtained for mCPP. Consistent with previous reports (Rothman and Baumann, 2002), mCPP potently and fully released [3H]5-HT (EC50 = 37±4 nM, EMAX = 94±3 %). Indatraline shifted the mCPP dose-response curve to the right (EC50 = 131±45 nM), but also decreased the EMAX value to 68±4 %. The Ke value of indatraline (9.8 nM) was 3-fold greater than its IC50 value for inhibition of [3H]5-HT uptake. EG-1-149 produced similar results, but with a larger decrease in the EMAX value to 47±3 %. The Ke value of EG-1-149 (6236 nM) was 3.5-fold greater than its IC50 value for inhibition of [3H]5-HT uptake. BW723C86 shifted the mCPP dose-response curve rightward in a dose-dependent manner. The 5 μM dose increased the EC50 to 102 nM, and decreased the EMAX value to 54%. The Ke value of BW723C86 (3095 nM) was 1.6-fold greater than its IC50 value for inhibition of [3H]5-HT uptake. The 25 μM dose of BW723C86 shifted the mCPP dose-response curve rightward to a much greater extent than observed with the other SERT uptake blockers. Given the magnitude of the rightward shift produced by 25 μM BW723C86, it was not possible to extrapolate EC50 or EMAX values. One way of describing these data is that BW723C86, indatraline and EG-1-149 converted mCPP into a “partial releaser”.
Figure 3.
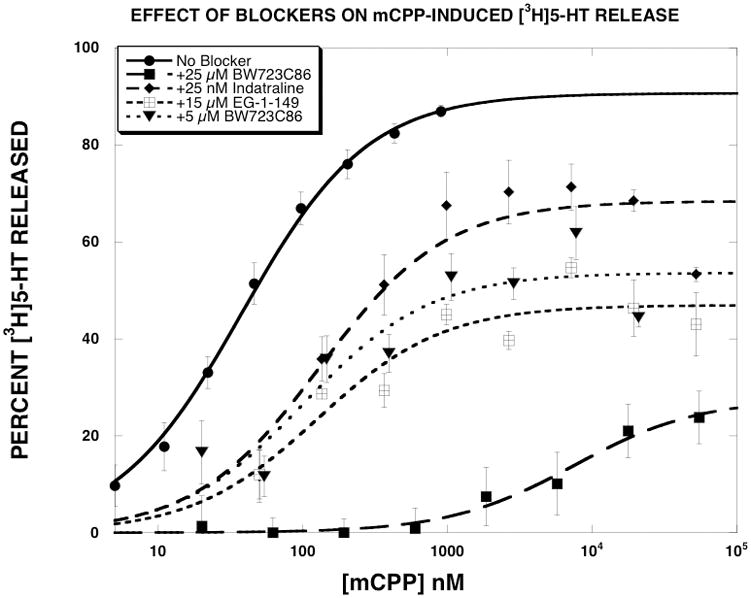
Effect of SERT inhibitors on mCPP-induced [3H]5-HT release. mCPP dose-response curves were generated as described in methods. The data, expressed as percent [3H]5-HT released, were fit to the dose-response equation for the best fit estimates of the EMAX and EC50 using KaleidaGraph. Each value is the mean±SEM (n=3 for indatraline and EG-1-149, n=5 for 5 μM BW723C86, n=9 for 25 μM BW723C86 and n=17 for mCPP).
Like mCPP, the other SERT substrates potently released [3H]5-HT with EMAX values of essentially 100% (Table 1). Among the three SERT inhibitors, indatraline produced classic rightward shifts in the substrate dose-response curves for (+)-fenfluramine, (±)-MDMA, 5-HT and (+)-norfenfluramine. When tested against mCPP and PAL-287, indatraline produced rightward shifts and decreases in the EMAX values. The Ke values of indatraline (Table 2) differed for each substrate, ranging from 1.1 nM for (±)-MDMA to 9.8 nM for mCPP. The order of potency of the Ke value was (±)-MDMA > (+)-fenfluramine > PAL-287 = (+)-norfenfluramine > 5-HT = mCPP. Unlike indatraline, 25 μM BW723C86 reduced the EMAX value of all tested substrates except 5-HT, with EMAX values ranging from 59% for PAL-287 to 85% FOR (±)-MDMA. The Ke values for BW723C86 (25 μM) also varied according to the substrate tested. Notably, the Ke value determined with 5-HT (400 nM) was ~9–10 fold lower than when determined with most of the other SERT substrates. The order of potency of the Ke value was 5-HT> (±)-MDMA > (+)-norfenfluramine > PAL-287 > (+)-fenfluramine ≫ mCPP. EG-1-149 produced results qualitatively similar to BW723C86 by converting all tested substrates into apparent partial releasers. The order of potency of the Ke value of EG-1-149 was PAL-287 > (+)-fenfluramine = 5-HT > (+)-norfenfluramine > (±)-MDMA > mCPP. Figure 4 shows the effect of the three SERT inhibitors on 5-HT-induced [3H]5-HT release. In contrast to the effect of these compounds on [3H]5-HT released by the other SERT substrates, the SERT inhibitors produced classic rightward shifts in the 5-HT dose-response curve.
Table 2.
Ke Values of SERT Inhibitors
| DRUG | 25 μM BW723C86 (1855 nM)a Ke (nM) |
25 nM Indatraline (3.2 nM)a Ke (nM) |
15 μM EG-1-149 (1755 nM)a Ke (nM) |
|---|---|---|---|
| PAL-287 | 2730±800 | 4.9±1.4 | 713±114 |
| (+)-fenfluramine | 4590±1042 | 2.4±0.2 | 1176±248 |
| mCPP | Indeterminate (3095±1171 with 5 μM) |
9.8±1.9 | 6724±1356 |
| (±)-MDMA | 805±132 | 1.1±0.2 | 4817±1340 |
| (+)-norfenfluramine | 2550±640 | 3.4±0.3 | 2900±585 |
| 5-HT | 400±86 | 9.0±0.9 | 1769±178 |
The Ke values were calculated as described in Methods using the data reported in Table 1. Each value is ± SEM.
IC50 value for inhibition of [3H]5-HT uptake.
Figure 4.
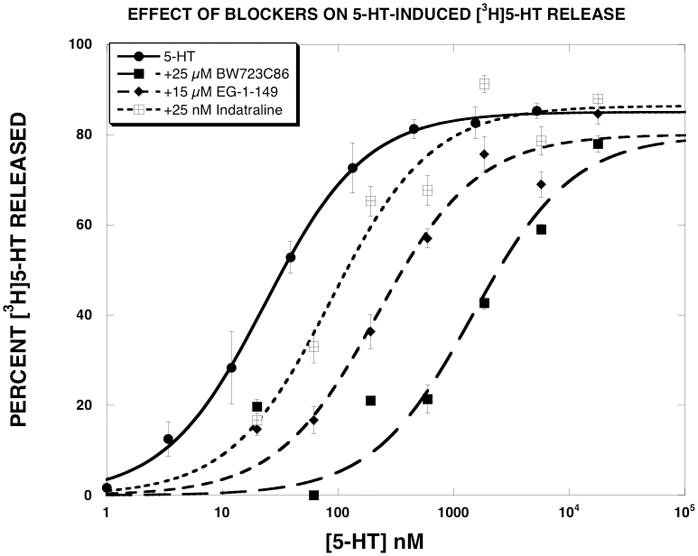
Effect of SERT inhibitors on 5-HT-induced [3H]5-HT release. 5-HT dose-response curves were generated as described in methods. The data, expressed as percent [3H]5-HT released, were fit to the dose-response equation for the best fit estimates of the EMAX and EC50 using KaleidaGraph. Each value is the mean±SEM (n=6).
As described in greater detail in the Discussion, our leading hypothesis to explain the results is that the efficacy of substrate translocation can be pharmacologically manipulated. Using (+)-norfenfluramine as an example, we hypothesize that in the presence of EG-1-149, (+)-norfenfluramine releases [3H]5-HT more slowly than in its absence, leading to a lower EMAX value. A direct prediction of this hypothesis is that given more time, the EMAX value should increase. To test this prediction, we generated (+)-norfenfluramine release curves in the absence and presence of 15 μM EG-1-149 and terminated the assay at 5 min (the usual time) and 15 min. As reported in Fig. 5 and Table 3, the EMAX value of (+)-norfenfluramine in the presence of EG-1-149 was 81±3% at the 5 min time point. When the release assay was terminated at 15 min, the EMAX increased to 97±4. In contrast, time had little effect on the EMAX value of 5-HT-induced [3H]5-HT release (Fig. 6).
Figure 5.
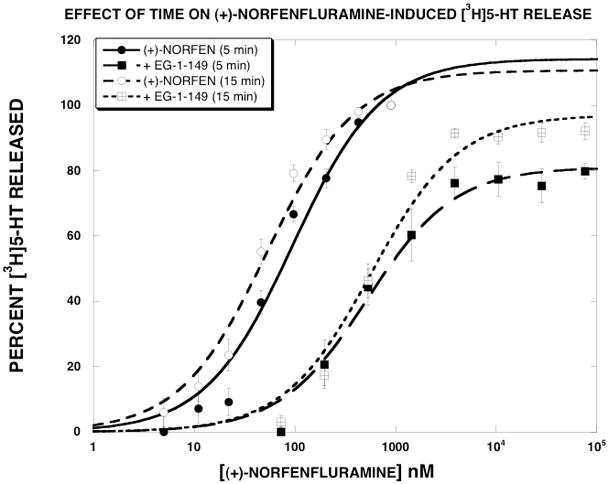
Effect of time on (+)-norfenfluramine-induced [3H]5-HT release. (+)-Norfenfluramine dose-response curves were generated as described in Methods in the absence and presence of 15 μM EG-1-149. The release assays were terminated at 5 min or 15 min. The data, expressed as percent [3H]5-HT released, were fit to the dose-response equation for the best fit estimates of the EMAX and EC50 using KaleidaGraph. Each value is the mean±SEM (n=9). The parameter values are reported in Table 3.
Table 3.
(+)-Norfenfluramine-Induced [3H]5-HT Release - Effect of Time
| NO EG-1-149 | 15 μM EG-1-149 | |||
|---|---|---|---|---|
| Release time (min) | EC50 (nM) ± SD | Emax (%I) ± SD | EC50 (nM) ± SD | Emax (%I) ± SD |
| 5 | 95 ± 21 | 114 ± 8 | 519 ± 98 | 81 ± 3 |
| 15 | 53 ± 9* | 111 ± 5 | 570 ± 121 | 97 ± 4* |
Each value is ± SD (n=6).
p<0.05 when compared to the 5 min value
Figure 6.
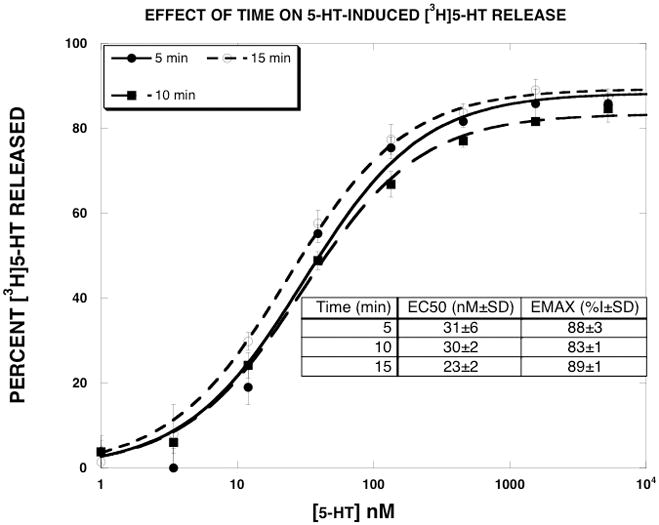
Effect of time on 5-HT-induced [3H]5-HT release. 5-HT dose-response curves were generated as described in Methods. The release assays were terminated at 5, 10 or 15 min. The data, expressed as percent [3H]5-HT released, were fit to the dose-response equation for the best fit estimates of the EMAX and EC50 using KaleidaGraph. Each value is the mean±SEM (n=5).
Discussion
Recent studies indicate that the biogenic amine transporters can adopt different functionally significant conformational states (Ferrer and Javitch, 1998; Gether et al., 2006; Reith et al., 2001). Recent data from our lab support this idea. We showed that allosteric modulators of the DAT reduced the EMAX value for D-amphetamine-induced DAT-mediated release of [3H]MPP+, while producing minimal increases in the EC50 value. In other words, the DAT allosteric modulators affected the efficacy of substrate-induced DAT-mediated release of [3H]MPP+. In light of these findings, and exploratory experiments indicating that substrates and reuptake inhibitors do not always interact with transporters in a manner consistent with simple competitive models, we hypothesized that simple competitive interactions would not be observed with a number of different SERT inhibitors and substrates, and the functional dissociation constant (Ke) of a given SERT inhibitor would not be the same for all tested substrates. We tested this hypothesis using a well-characterized [3H]5-HT release assay. The data presented here are consistent with this hypothesis.
The EC50 values for the SERT substrates observed in this study (Table 1) were similar to previously reported values (Rothman and Baumann, 2003). mCPP potently released [3H]5-HT (EC50 = 39 nM), consistent with other data that mCPP is a SERT substrate (Baumann et al., 2001; Pettibone and Williams, 1984). The EMAX values of the SERT substrates were close to 100%. In some cases (PAL-287, mCPP, MDMA, 5-HT) the EMAX values tested as being statistically different from 100%, but were close enough to 100% so as to consider them to be “full”, not “partial,” substrates. Indatraline is a non-selective high affinity inhibitor of DAT, SERT and NET (Hyttel and Larsen, 1985). Our previous work with this compound indicated that it blocked the releasing action of DAT, SERT and NET substrates according to simple competitive models (Rothman et al., 2000). This was observed in the present study for (+)-fenfluramine, (±)-MDMA and (+)-norfenfluramine, but not for PAL-287 or mCPP. The effect of indatraline on the mCPP release curve was particularly striking, since mCPP became a “partial releaser” in the presence of indatraline. 25 μM BW723C86 reduced the EMAX value of all tested substrates except 5-HT. EG-1-149, a low potency SERT uptake inhibitor, produced effects similar to those observed with BW723C86, indicating that the effects of BW723C86 observed here were not related to its actions at the 5-HT2B receptor.
Consistent with our hypothesis, the Ke values of the SERT inhibitors were substrate-dependent and varied up to ten-fold. In some cases, the Ke value was strikingly lower than the IC50 value for inhibiting [3H]5-HT uptake (4.6-fold lower for BW723C86). We would have liked, in principle, to have expanded this data set by generating, for each substrate, dose-response curves in the absence and presence of several concentrations of SERT inhibitors. Unfortunately, the signal-to-noise ratio of this SERT release assay is not adequate for this type of experiment.
The mechanism by which the SERT translocates substrates across the plasma membrane is complex (Rudnick, 2006) and SERT function is also highly regulated (Steiner et al., 2008). Substrate-induced neurotransmitter release involves not only translocation of the substrate, but also the counter transport of the neurotransmitter, adding a further degree of complexity to the process described as carrier mediated exchange. Our findings suggest an additional layer of complexity. The simplest explanation of our data is that the efficacy of substrate translocation can be pharmacologically manipulated. We suggest that different SERT inhibitors can produce subtly different conformations of the SERT protein that alter the efficiency of substrate translocation. Lower translocation efficiency would then result in the profile of a partial releaser. A direct prediction of this hypothesis is that the EMAX value of a partial releaser would increase as a function of time and this was observed (Fig. 5). The fact that the EMAX value increased with time would appear to rule out an alternative hypothesis that the SERT inhibitor promoted internalization of SERT, since one might expect the EMAX value to decrease further with additional time. Recent data that certain SERT substrates are “partial” substrates supports this idea (Gobbi et al., 2008). Moreover, since different substrates could bind to somewhat different domains of SERT, a given SERT inhibitor could alter the release profile of some substrates, but not others. Thus, these results suggest that it may be possible to design SERT inhibitors that differentially regulate SERT function.
Importantly, the SERT inhibitors tested here, in contrast to their effects on non-endogenous SERT substrates, did not convert the endogenous substrate of SERT (5-HT) into a partial releaser (Fig. 4). This suggests that it may be possible to develop SERT inhibitors that selectively block the 5-HT releasing effects of SERT substrates such as MDMA or methamphetamine, without affecting the interaction of 5-HT with SERT. Such compounds could potentially reduce adverse effects related to excessive drug-induced 5-HT release, such as the serotonin syndrome (Parrott, 2002), without affecting endogenous 5-HT release.
Acknowledgments
This work was supported by the Intramural Research Program, National Institute on Drug Abuse, NIH, DHHS and NIDA Grant DA12970 to Dr. Blough.
Abbreviations
- PAL-287
naphthylisopropylamine
- BW723C86
α-methyl-5-(2-thienylmethoxy)-1H-indole-3-ethanamine
- SB204741
N-(1-Methyl-1H-indol-5-yl)-N′-(3-methylisothiazol-5-yl)urea
- EG-1-149
4-(2-(benzhydryloxy)ethyl)-1-(4-bromobenzyl)piperidine oxalate
- (±)-MDMA
3,4-methylenedioxyamphetamine
- mCPP
meta-chlorophenylpiperazine
References
- Baumann MH, Ayestas MA, Dersch CM, Rothman RB. 1-(m-Chlorophenyl)piperazine (mCPP) Dissociates In Vivo Serotonin Release from Long-Term Serotonin Depletion in Rat Brain. Neuropsychopharmacology. 2001;24:492–501. doi: 10.1016/S0893-133X(00)00221-9. [DOI] [PubMed] [Google Scholar]
- Doly S, Valjent E, Setola V, Callebert J, Herve D, Launay JM, Maroteaux L. Serotonin 5-HT2B receptors are required for 3,4-methylenedioxymethamphetamine-induced hyperlocomotion and 5-HT release in vivo and in vitro. J Neurosci. 2008;28(11):2933–2940. doi: 10.1523/JNEUROSCI.5723-07.2008. [DOI] [PMC free article] [PubMed] [Google Scholar]
- Ferrer JV, Javitch JA. Cocaine alters the accessibility of endogenous cysteines in putative extracellular and intracellular loops of the human dopamine transporter. Proc Natl Acad Sci U S A. 1998;95(16):9238–9243. doi: 10.1073/pnas.95.16.9238. [DOI] [PMC free article] [PubMed] [Google Scholar]
- Gether U, Andersen PH, Larsson OM, Schousboe A. Neurotransmitter transporters: molecular function of important drug targets. Trends Pharmacol Sci. 2006;27(7):375–383. doi: 10.1016/j.tips.2006.05.003. [DOI] [PubMed] [Google Scholar]
- Gobbi M, Funicello M, Gerstbrein K, Holy M, Moya PR, Sotomayor R, Forray MI, Gysling K, Paluzzi S, Bonanno G, Reyes-Parada M, Sitte HH, Mennini T. N,N-dimethyl-thioamphetamine and methyl-thioamphetamine, two non-neurotoxic substrates of 5-HT transporters, have scant in vitro efficacy for the induction of transporter-mediated 5-HT release and currents. J Neurochem. 2008;105(5):1770–1780. doi: 10.1111/j.1471-4159.2008.05272.x. [DOI] [PMC free article] [PubMed] [Google Scholar]
- Goodwin JS, Larson GA, Swant J, Sen N, Javitch JA, Zahniser NR, De Felice LJ, Khoshbouei H. Amphetamine and methamphetamine differentially affect dopamine transporters in vitro and in vivo. J Biol Chem. 2008 doi: 10.1074/jbc.M805298200. [DOI] [PMC free article] [PubMed] [Google Scholar]
- Gorman JM, Kent JM. SSRIs and SMRIs: broad spectrum of efficacy beyond major depression. J ClinPsychiatry. 1999;60(Suppl 4):33–38. [PubMed] [Google Scholar]
- Grabowski J, Shearer J, Merrill J, Negus SS. Agonist-like, replacement pharmacotherapy for stimulant abuse and dependence. Addict Behav. 2004;29(7):1439–1464. doi: 10.1016/j.addbeh.2004.06.018. [DOI] [PubMed] [Google Scholar]
- Greiner E, Prisinzano T, Johnson IE, Dersch CM, Marcus J, Partilla JS, Rothman RB, Jacobson AE, Rice KC. Structure-activity relationship studies of highly selective inhibitors of the dopamine transporter: N-benzylpiperidine analogues of 1-[2-[bis(4-fluorophenyl)methoxy]ethyl]-4-(3-phenylpropyl)piperazine. J Med Chem. 2003;46(8):1465–1469. doi: 10.1021/jm020419v. [DOI] [PubMed] [Google Scholar]
- Hyttel J, Larsen JJ. Neurochemical profile of Lu 19-005, a potent inhibitor of uptake of dopamine, noradrenaline, and serotonin. Journal of Neurochemistry. 1985;44:1615–1622. doi: 10.1111/j.1471-4159.1985.tb08803.x. [DOI] [PubMed] [Google Scholar]
- Kenakin T. Ligand-selective receptor conformations revisited: the promise and the problem. Trends Pharmacol Sci. 2003;24(7):346–354. doi: 10.1016/S0165-6147(03)00167-6. [DOI] [PubMed] [Google Scholar]
- Knight AR, Misra A, Quirk K, Benwell K, Revell D, Kennett G, Bickerdike M. Pharmacological characterisation of the agonist radioligand binding site of 5-HT(2A), 5-HT(2B) and 5-HT(2C) receptors. Naunyn Schmiedebergs Arch Pharmacol. 2004;370(2):114–123. doi: 10.1007/s00210-004-0951-4. [DOI] [PubMed] [Google Scholar]
- Parrott AC. Recreational Ecstasy/MDMA, the serotonin syndrome, and serotonergic neurotoxicity. Pharmacol Biochem Behav. 2002;71(4):837–844. doi: 10.1016/s0091-3057(01)00711-0. [DOI] [PubMed] [Google Scholar]
- Pettibone DJ, Williams M. Serotonin-releasing effects of substituted piperazines in vitro. BiochemPharmacol. 1984;33:1531–1535. doi: 10.1016/0006-2952(84)90424-6. [DOI] [PubMed] [Google Scholar]
- Pifl C, Wolf A, Rebernik P, Reither H, Berger ML. Zinc regulates the dopamine transporter in a membrane potential and chloride dependent manner. Neuropharmacology. 2009;56(2):531–540. doi: 10.1016/j.neuropharm.2008.10.009. [DOI] [PubMed] [Google Scholar]
- Reith ME, Berfield JL, Wang LC, Ferrer JV, Javitch JA. The uptake inhibitors cocaine and benztropine differentially alter the conformation of the human dopamine transporter. J Biol Chem. 2001;276(31):29012–29018. doi: 10.1074/jbc.M011785200. [DOI] [PubMed] [Google Scholar]
- Rothman RB, Baumann MH. Serotonin releasing agents. Neurochemical, therapeutic and adverse effects. Pharmacol Biochem Behav. 2002;71(4):825–836. doi: 10.1016/s0091-3057(01)00669-4. [DOI] [PubMed] [Google Scholar]
- Rothman RB, Baumann MH. Monoamine transporters and psychostimulant drugs. Eur J Pharmacol. 2003;479(1–3):23–40. doi: 10.1016/j.ejphar.2003.08.054. [DOI] [PubMed] [Google Scholar]
- Rothman RB, Baumann MH. Therapeutic potential of monoamine transporter substrates. Curr Top Med Chem. 2006;6(17):1845–1859. doi: 10.2174/156802606778249766. [DOI] [PubMed] [Google Scholar]
- Rothman RB, Baumann MH, Dersch CM, Romero DV, Rice KC, Carroll FI, Partilla JS. Amphetamine–type central nervous system stimulants release norepinephrine more potently than they release dopamine and serotonin. Synapse. 2001;39:32–41. doi: 10.1002/1098-2396(20010101)39:1<32::AID-SYN5>3.0.CO;2-3. [DOI] [PubMed] [Google Scholar]
- Rothman RB, Baumann MH, Prisinzano TE, Newman AH. Dopamine transport inhibitors based on GBR12909 and benztropine as potential medications to treat cocaine addiction. Biochem Pharmacol. 2008;75(1):2–16. doi: 10.1016/j.bcp.2007.08.007. [DOI] [PMC free article] [PubMed] [Google Scholar]
- Rothman RB, Blough BE, Baumann MH. Dual dopamine-5-HT releasers: potential treatment agents for cocaine addiction. Trends Pharmacol Sci. 2006;27(12):612–618. doi: 10.1016/j.tips.2006.10.006. [DOI] [PubMed] [Google Scholar]
- Rothman RB, Dersch CM, Ananthan S, Partilla JS. Studies of the Biogenic Amine Transporters. 13. Identification of “Agonist” and “Antagonist” Allosteric Modulators of Amphetamine-Induced Dopamine Release. J Pharmacol Exp Ther. 2009;392(2):718–728. doi: 10.1124/jpet.108.149088. [DOI] [PMC free article] [PubMed] [Google Scholar]
- Rothman RB, Partilla JS, Baumann MH, Dersch CM, Carroll FI, Rice KC. Neurochemical neutralization of methamphetamine with high affinity non-selective inhibitors of biogenic amine transporters: a pharmacological strategy for treating stimulant abuse. Synapse. 2000;35:222–227. doi: 10.1002/(SICI)1098-2396(20000301)35:3<222::AID-SYN7>3.0.CO;2-K. [DOI] [PubMed] [Google Scholar]
- Rothman RB, Vu N, Partilla JS, Roth BL, Hufeisen SJ, Compton-Toth BA, Birkes J, Young R, Glennon RA. In vitro characterization of ephedrine-related stereoisomers at biogenic amine transporters and the receptorome reveals selective actions as norepinephrine transporter substrates. J Pharmacol Exp Ther. 2003;307(1):138–145. doi: 10.1124/jpet.103.053975. [DOI] [PubMed] [Google Scholar]
- Rudnick G. Serotonin transporters--structure and function. J Membr Biol. 2006;213(2):101–110. doi: 10.1007/s00232-006-0878-4. [DOI] [PubMed] [Google Scholar]
- Rudnick G, Clark J. From synapse to vesicle: the reuptake and storage of biogenic amine neurotransmitters. [Review] Biochim Biophys Acta. 1993;1144:249–263. doi: 10.1016/0005-2728(93)90109-s. [DOI] [PubMed] [Google Scholar]
- Steiner JA, Carneiro AM, Blakely RD. Going with the flow: trafficking-dependent and -independent regulation of serotonin transport. Traffic (Copenhagen, Denmark) 2008;9(9):1393–1402. doi: 10.1111/j.1600-0854.2008.00757.x. [DOI] [PMC free article] [PubMed] [Google Scholar]
- Zohar J, Westenberg HG. Anxiety disorders: a review of tricyclic antidepressants and selective serotonin reuptake inhibitors. Acta PsychiatrScandSuppl. 2000;403:39–49. doi: 10.1111/j.1600-0447.2000.tb10947.x. [DOI] [PubMed] [Google Scholar]


