Abstract
We assessed the usefulness of stereopsis across the visual field by quantifying how retinal eccentricity and distance from the horopter affect humans’ relative dependence on monocular and binocular cues about 3D orientation. The reliabilities of monocular and binocular cues both decline with eccentricity, but the reliability of binocular information decreases more rapidly. Binocular cue reliability also declines with increasing distance from the horopter, whereas the reliability of monocular cues is virtually unaffected. We measured how subjects integrated these cues to orient their hands when grasping oriented discs at different eccentricities and distances from the horopter. Subjects relied increasingly less on binocular disparity as targets’ retinal eccentricity and distance from the horopter increased. The measured cue influences were consistent with what would be predicted from the relative cue reliabilities at the various target locations. Our results showed that relative reliability affects how cues influence motor control and that stereopsis is of limited use in the periphery and away from the horopter because monocular cues are more reliable in these regions.
Keywords: binocular vision, spatial vision, 3D surface and shape perception, grasping, cue integration
Introduction
Most conclusions about visual perception have been based on foveal vision since this is where visual acuity and thus performance on most tasks is best, and it is well established that stereopsis contributes to perception and motor control when stimuli are in the central portion of the visual field. However, peripheral regions of the visual field also significantly impact how we navigate through and interact with the world. Information from the periphery is particularly important for planning and executing reaching movements. It helps us plan both the saccades that will move the eyes so that the desired objects project onto the foveae and the reaching movements themselves (Desmurget & Grafton, 2000) and can also help guide the early portions of goal-directed movements when the movements begin prior to target fixation, which sometimes occurs during natural tasks (Land & Hayhoe, 2001). The experiments presented in this paper examined the extent to which humans use stereopsis in extrafoveal regions of the visual field to estimate three-dimensional (3D) orientation for the purpose of grasping and lifting an object. When lifting a drinking glass, information from the contour of the glass, the texture gradient of the tablecloth, and the binocular disparities of the glass and other objects in the scene all help to describe the positions and 3D orientations of the glass and the table upon which it rests. The visuomotor system integrates the information from these and other visual cues to prepare and then control a movement that normally results in grasping and lifting the glass even when one is not looking directly at it.
Surprisingly few studies have focused on stereoacuity, the ability to use binocular disparity as a depth cue, away from the fovea, although it is agreed that thresholds for stereopsis increase with retinal eccentricity. This decrease in sensitivity appears to reflect decreases in the amount of cortical representation in the periphery rather than the visual angle per se (Prince & Rogers, 1998). Banks, Gepshtein, and Landy (2004) suggested that the decrease results from the optics of the eye and larger neuronal receptive fields in the periphery removing higher spatial frequencies from the visual input. Monocular visual acuity also decreases with increasing retinal eccentricity due to lowpass spatial filtering by the early visual system and decreasing cortical representation, but stereoacuity degrades faster (Fendick & Westheimer, 1983). This implies that subjects should rely progressively more on monocular information such as contour compression and texture cues as target eccentricity increases even though the reliability of this information also degrades. Similarly, Blakemore (1970) and Siderov and Harwerth (1995) reported that stereoacuity thresholds increase exponentially with distance from the horopter, the collection of points in space that project to corresponding points in the two eyes, so the relative influence of binocular information would also be expected to decrease as targets are moved away from this manifold.
Thresholds influence how we use information from different cues to perform basic motor tasks because subjects depend more on the most reliable cues when combining sensory information from multiple sources (Alais & Burr, 2004; Ernst & Banks, 2002; Hillis, Watt, Landy, & Banks, 2004; Knill & Saunders, 2003). This is the optimal strategy from a statistical perspective because it results in the lowest possible variance for an unbiased estimator, including those based on any of the individual cues alone. Based on the underlying geometry and published estimates of visual acuity and stereoacuity, we performed a geometric analysis that qualitatively predicted how 3D orientation discrimination thresholds should change as targets move into the periphery and away from the horopter (see Supplemental Material for details). We predicted 75% thresholds for a hypothetical observer performing a two-interval forced choice (2IFC) task comparing the slant (rotation about the horizontal axis away from frontoparallel) of a 7 cm diameter circular target to that of a similar target slanted 35° away from the viewer. The simulated observer had an interpupillary distance of 6.5 cm and fixated a point 55 cm directly in front of him. We used estimates of how stereoacuity changes with retinal eccentricity (Fendick & Westheimer, 1983) and distance from the horopter (Blakemore, 1970) to predict binocular 3D orientation thresholds for targets presented on the Vieth-Müller circle (an approximation of the horopter, see Figure 1) at retinal eccentricities of 0° (at fixation), 5°, and 10° (the eccentricities at which the authors of our referenced studies performed their measurements) and for targets presented at 0°, 0.5°, and 1° of convergent (near, crossed) disparity relative to the horopter. The latter were presented at a retinal eccentricity of 5° because it is difficult to maintain vergence at a different depth when the target is at the same eccentricity. We also used published estimates of normal visual acuity as a function of retinal eccentricity (Thibos, Cheney, & Walsh, 1987) to predict the 75% thresholds for 3D orientation estimates of the same stimuli based on aspect ratio, a monocular cue.
Figure 1.
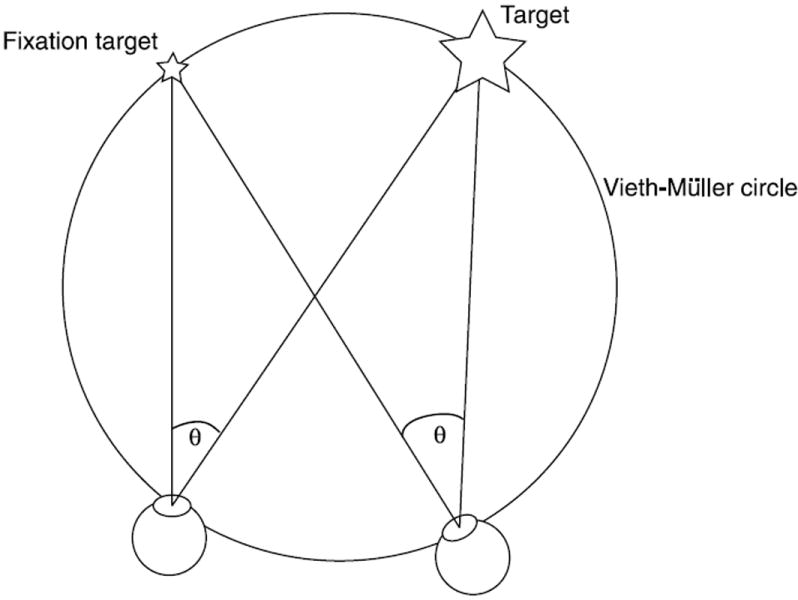
Top-down view of the eyes and targets. We defined each target’s retinal eccentricity (θ) using the angle between the target center and fixation point relative to each eye so that the eccentricity was the same for both eyes. Targets were always placed on (or, in Experiment 3, relative to) the Vieth-Müller circle, the circle that passes through the fixation point and the nodal points of the eyes and forms the theoretical horopter. Alternatively, the horopter can be determined empirically (see Howard and Rogers (2002) and Schreiber, Hillis, Filippini, Schor, and Banks (2008)); the empirical horopter is slightly different from the theoretical horopter and varies in shape across individuals (Blakemore, 1970; Schreiber et al., 2008). There are tradeoffs between the two definitions in their assumptions and ease of measurement; we chose to use the Vieth-Müller circle because it allowed us to more easily define the positions of the targets and satisfy the geometric constraints that the experiments required. Panum’s area (not shown) is the region about the horopter where binocular fusion is possible.
Figure 2 shows the 75% thresholds for distinguishing between a standard stimulus slanted at 35° and a comparison target using horizontal disparity, a binocular cue, and aspect ratio, a monocular cue, as a function of retinal eccentricity and distance from the horopter. Thresholds for both cues increased with retinal eccentricity, but the binocular thresholds increased faster. This implies that monocular information should become progressively more influential with increasing retinal eccentricity. As targets moved from the horopter to 1° of convergent (near, crossed) disparity, binocular thresholds increased rapidly. The monocular thresholds remained generally constant but decreased slightly because the targets’ retinal size increased as they moved nearer to the viewer. If we had used divergent (far, uncrossed) disparity instead, these thresholds would have increased slightly as targets moved away from the viewer and their retinal size decreased. The data shows that the monocular thresholds are largely independent of the position of the target relative to the horopter. Based on this analysis, one would expect the relative influence of binocular information to rapidly approach zero with increasing distance from the horopter.
Figure 2.
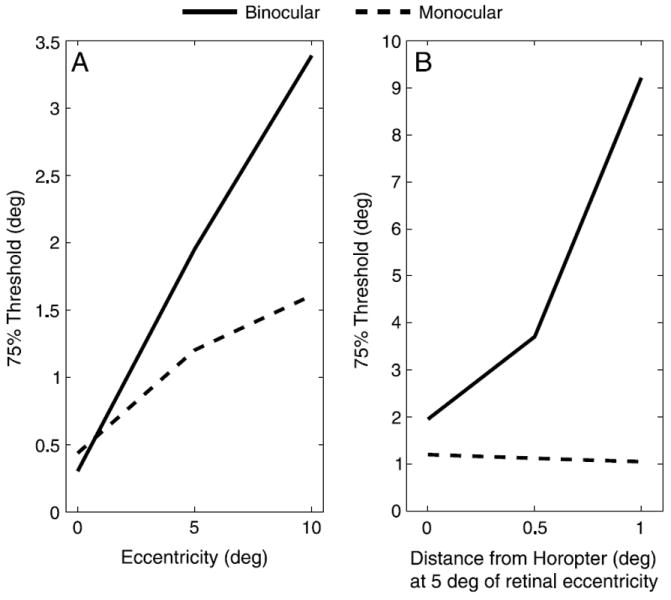
Estimated 75% thresholds for binocular (horizontal disparity) and monocular (aspect ratio) cues as a function of (A) retinal eccentricity and (B) distance from the horopter at 5° of retinal eccentricity based on a geometric analysis using published acuity thresholds.
We tested these predictions in three experiments that required human subjects to use monocular and binocular information to estimate the 3D orientations of stimuli at different retinal eccentricities and distances from the horopter. Our first experiment separately measured monocular and binocular thresholds for 3D orientation discrimination at different retinal eccentricities along the theoretical horopter. Then, we used a grasping task to quantify how subjects integrated monocular and binocular information about 3D orientation at these same positions and compared the cue integration strategies we observed with those predicted by sensitivity to the individual cues at each retinal location. In Experiment 3, we investigated how increasing the targets’ distance from the theoretical horopter affected the contribution of stereopsis to subjects’ 3D orientation estimates.
Experiment 1: Eccentric monocular and binocular slant thresholds
We separately measured 3D orientation thresholds from aspect ratio, a monocular cue, and disparity, a binocular cue, at the fixation point and at two points in the periphery. This enabled us to predict how the relative influences of the cues should change as a function of eccentricity.
Method
Subjects
The ten subjects in this experiment were laboratory staff, graduate students, or postdoctoral fellows in the Department of Brain & Cognitive Sciences and/or the Center for Visual Science at the University of Rochester. All subjects had normal or corrected-to-normal vision and binocular acuity of at least 40 arc seconds, provided written informed consent, and were paid $10 per hour. We used experienced psychophysical observers to obtain the best possible threshold estimates; although they were aware that the purpose of the experiment was to estimate psychophysical thresholds, they were not informed of the details of the staircases we used or of our hypotheses. All experiments reported here followed protocols specified by the University of Rochester Research Subjects Review Board.
Apparatus
Participants viewed a 20 in. display (1152 × 864 resolution, 118 Hz refresh rate) through a half-silvered mirror as shown in Figure 3. A chin and forehead rest supported the subject’s head and oriented their view approximately 32° downwards toward the mirror, which was rotated approximately 16° from horizontal toward the subject so that the virtual image of the display appeared as a frontoparallel surface behind the mirror. An opaque backing placed behind the mirror prevented subjects from seeing anything other than the computer display, and opaque covers placed long the outer portions of the mirror masked the edges of the computer monitor and eliminated external visual references. These occluders were well outside Panum’s area, the region within which binocular fusion can occur, and therefore did not provide useful references for judging 3D position or orientation. Subjects viewed the display through CrystalEyes stereo glasses (StereoGraphics Corporation, San Rafael, CA) at 59 Hz per eye during both monocular and binocular conditions, and we occluded their left eye with a patch during monocular trials. Each subject viewed the monocular stimuli with their right eye because stimuli appeared to the right of fixation and Khan and Crawford (2003) found that eye dominance changes in the periphery depending on which eye has the better field of view. An Eyelink II eyetracker (SR Research Ltd., Ontario, Canada) mounted on the stereo glasses recorded eye positions at 500 Hz to ensure that subjects remained visually fixated on the fixation target during stimulus presentation. An Optotrak 3020 (Northern Digital, Inc., Ontario, Canada) was used during calibration, and subjects used the buttons on a computer mouse to indicate their responses.
Figure 3.
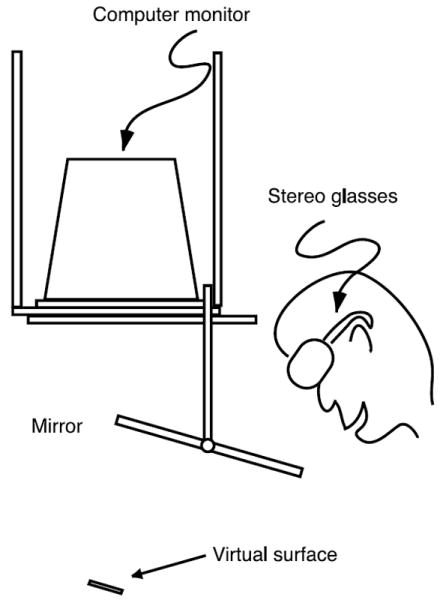
Apparatus for Experiment 1. Images from an inverted computer monitor were reflected in a mirror so that virtual surfaces displayed on the monitor appeared to float beneath the mirror. Subjects viewed the virtual environment through stereo glasses. This was a complex setup for a perceptual 2IFC task, but it matched the configuration used for the visuomotor tasks in Experiments 2 and 3.
Calibration procedures
We first identified the locations of each subject’s eyes relative to the monitor. At the beginning of each session, the backing of the half-silvered mirror was removed, which allowed subjects to see the monitor and their hand simultaneously. Subjects positioned an infrared marker at a series of visually cued locations so that the marker and a symbol presented monocularly on the monitor appeared to be aligned. Thirteen positions were matched for each eye at two different depth planes, and we calculated the 3D position of each eye relative to the center of the display by minimizing the squared error between the measured position of the marker and the position we predicted from the estimated eye locations. Subjects then moved the marker around the workspace and confirmed that a symbol presented binocularly in depth appeared at the same location as the infrared marker.
To calibrate the eyetracker, we recorded the positions of both eyes for binocular conditions or the right eye for monocular conditions as subjects fixated points in a 3 × 3 grid displayed on the screen. The eyetracker was calibrated at the start of each experimental block and after subjects removed their head from the chinrest, and drift corrections were performed after every five fixation losses or as needed. Fixation losses occurred when subjects looked away from the fixation target or when their measured eye positions drifted significantly from the calibrated positions.
Stimuli
The stimulus in monocular trials (see Figure 4A) was a red 7 cm diameter circle (RGB = (0.4,0,0)) on a darker red background (RGB = (0.25,0,0)) that was textured with brighter red dots (RGB = (0.8,0,0)). All stimuli were displayed in red to take advantage of the relatively faster phosphors and avoid interocular crosstalk. Stimuli presented at fixation were textured with 200–400 1.5 mm diameter dots distributed uniformly across the surface; randomizing the number of dots prevented subjects from learning a relationship between 3D orientation and spatial frequency. The size and number of dots were scaled with eccentricity so that the dots remained equally perceptible based on cortical magnification factors measured by Cowey and Rolls (1974) and covered the same total surface area at all retinal eccentricities. The larger dots used with eccentric stimuli were not permitted to overlap. To avoid the blind spot, which produces monocular regions near the horizontal meridian at about 12–20° of eccentricity on either side of the fixation point (Armaly, 1969), we varied stimulus eccentricity along a 45° axis from the center of the screen up and to the right relative to the cyclopean eye. The aspect ratios of the circular surface and dot texture elements provided monocular information that indicated the surface’s slant, and the distributions of the dots may have also contributed a minimal amount of additional information.
Figure 4.
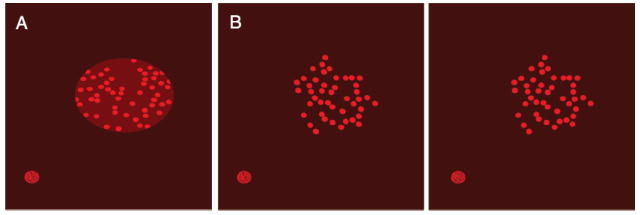
Stimuli used in (A) monocular and (B) binocular conditions (shown here as a stereogram) in Experiment 2. The round shape in the bottom left of each figure is the fixation target.
In binocular trials, the slanted stimuli appeared as clusters of bright red dots on a darker red background with disparity gradients that suggested a surface oriented in depth (see Figure 4B). The size, number, and distribution of dots were similar to those in the monocular conditions, and the surfaces had a maximum radius of 3.5 cm. We created the clusters by generating blob-like shapes that were clearly anisotropic and were intended to disrupt subject’s dependence on monocular shape cues for judging 3D orientation. Each blob resulted from perturbing the contour of an ellipse with a random aspect ratio by adding sinusoids with random phases and scaling the vertices so that the most distant vertex was 3.5 cm from the center. These randomly shaped blobs acted as stencils that determined which dots were included in the textures. Any dots that were at least halfway inside the stencil shape were displayed in their entirety to help further mask the figures’ contours. The disparities of the dots provided information about the 3D orientation of the target surfaces. Monocular cues, including the contours of the blobs and the aspect ratios and distributions of the dots, were always consistent with a frontoparallel orientation and were therefore not helpful for discriminating between stimuli. Therefore, relying on these monocular cues would add only noise to subjects’ estimates and increase the measured stereoscopic slant discrimination thresholds.
In both conditions, a red wireframe sphere (RGB = (0.8,0,0)) with a diameter of 1 cm (approximately 1° of visual angle) served as a fixation target. It appeared 4 cm to the left and 8 cm below the center of the display and 4 cm behind the accommodative plane of the display so that stimuli were near this plane at all retinal eccentricities and that correlations between accommodation conflicts and eccentricity were minimized. The fixation target disappeared whenever stimuli were presented at the fixation point, but there was always a dot at the center of the oriented targets in these trials to help maintain fixation.
Procedure
Each trial began with the fixation target appearing on the display. Once visual fixation was established for 500 ms, the standard stimulus, a target slanted 35° away from frontoparallel about the horizontal axis, appeared at 0°, 7.5°, or 15° of retinal eccentricity along the Vieth-Müller circle for 1 s. Next, a visual mask appeared for 500 ms. For monocular trials, the mask consisted of non-overlapping 1 cm diameter red circles (RGB = (0.8,0,0)) with different aspect ratios created by randomly scaling their vertical axes. These ellipses were uniformly distributed within a 10 cm diameter circular region centered on the target location. Binocular masks were clouds of non-overlapping 1 cm diameter red wireframe spheres (RGB = (0.8,0,0)) that were uniformly distributed within a 10 cm diameter spherical region centered on the same point as the oriented targets. Following the mask, the comparison stimulus appeared for 1 s at a slant determined by adaptive staircases. Then, the display was blanked until subjects responded by pressing one of two buttons to indicate which of the stimuli seemed more slanted away from them. Subjects were provided with feedback about their performance after every 20 trials. We required subjects to maintain visual fixation on the fixation target (see Supplemental Material) whenever the oriented stimuli or masks were displayed.
The computer selected the slant of the comparison stimulus on each trial using an adaptive staircase procedure. Five staircases (1 up–1 down, 1 up–3 down, 1 up–5 down, 3 down–1 up, 5 down–1 up) explored the range of comparison slants for each of the viewing conditions. The staircases adjusted their levels based on which button was pressed rather than whether the response was correct because this helped identify response biases, and they were used only for selecting the comparison slant parameter on each trial. To estimate thresholds, we used maximum likelihood estimation (see Results section). The staircases continued for a specified number of trials within each 120-trial block, and the staircase parameters persisted across blocks and across sessions.
Subjects completed ten blocks over three 1-hour sessions for a total of 600 monocular trials and 600 binocular trials. The viewing conditions were not interleaved, but their order was counterbalanced across subjects. Each block contained trials at each of the three retinal eccentricities, and there were a total of 200 trials at each eccentricity for each of the two viewing conditions.
Results
We estimated subjects’ monocular and binocular slant discrimination thresholds at each eccentricity using maximum likelihood estimation to fit cumulative Gaussian functions to the frequency of reporting that the comparison stimulus was more slanted than the standard as a function of the difference between them. As in Knill and Saunders (2003), we assumed that subjects’ data reflected a combination of the true discrimination process and a random guessing process and included terms to account for attentional lapses and accidental responses that would have otherwise increased our estimates of the thresholds. To find the best fitting parameters, we maximized the likelihood functions provided in Equation 1. These functions computed the likelihood that a subject would decide (decision Dij) on trial i at eccentricity j that the comparison stimulus was more slanted than the standard stimulus or vice versa. We characterized the discrimination process using a cumulative Gaussian function parameterized by the difference in slant (ΔSij) between the standard and comparison targets, the point of subjective equality between the standard and comparison (μj) at that eccentricity, and the 84% threshold (σj). The final term in the first likelihood function assumed that the comparison stimulus was chosen at random after an attentional lapse.
| (1) |
For each subject, we fit parameters for μj and σj at each eccentricity and the two parameters related to attentional lapse for each viewing condition (a total of eight parameters per viewing condition) that maximized the likelihood of the data. We excluded three subjects from the results because their high attentional lapse rates (>20–30%) resulted in poor threshold estimates. The estimated attentional lapse rates for the seven included subjects were 1.3 ± 1.0% (mean ± SEM) for the monocular conditions and 7.1 ± 3.3% for the binocular conditions.
The slant thresholds for each subject are provided in Figure 5. We used a maximum likelihood approach to compute weighted group means based on the SEMs of the individual data; this prevented individual thresholds with very high uncertainties from dominating the overall results. A repeated-measures ANOVA revealed a significant effect of eccentricity (F(2,12) = 6.04, p = .049). Standard t-tests would have underestimated significance levels due to high standard deviations in the differences between conditions, so, to compare the effects of eccentricity on our weighted mean data, we used the weighted group means to estimate the differences between conditions and Z scores to compare whether these differences significantly differed from zero. For the monocular viewing condition, there was no significant difference between thresholds for targets at 0° and 7.5° of retinal eccentricity (Z = 0.58, p = .56), which were both around 3°. These thresholds were significantly lower than the 6.5° mean monocular threshold measured at 15° of retinal eccentricity (0°/15°: Z = 5.04, p < .001; 7.5°/15°: Z = 4.79, p < .001). The binocular thresholds at 0° and 7.5° were close to 4° and were also not significantly different (Z = 1.12, p = .26), but the 10.7° mean binocular threshold at 15° of retinal eccentricity was significantly higher than at the other two positions (0°/15°: Z = 2.84, p < .01; 7.5°/15°: Z = 3.15, p < .01). Particularly at fixation, these thresholds were much higher than what we predicted from the previously published data. One reason is that Fendick and Westheimer’s (1983) subjects had extensive practice, and another is that stimulus properties such as spatial frequency affect the rate at which disparity thresholds increase with eccentricity (Siderov & Harwerth, 1995).
Figure 5.
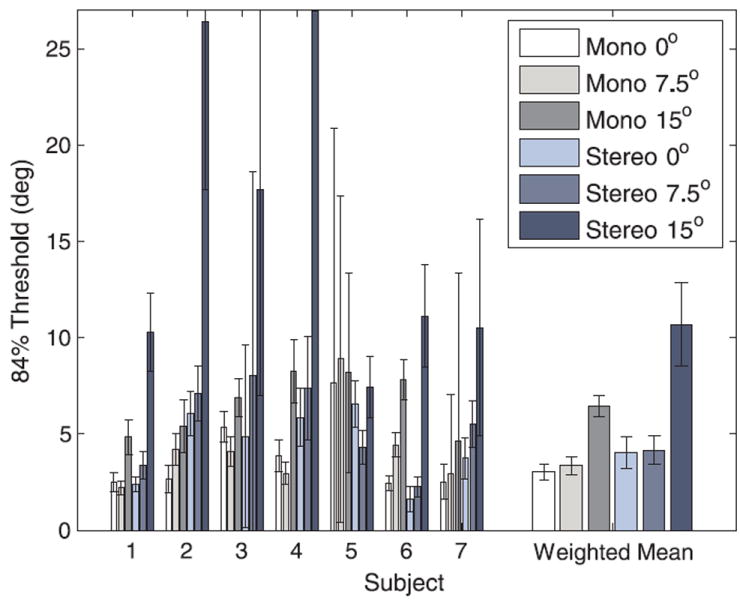
Slant thresholds obtained at eccentricities of 0°, 7.5°, and 15° under monocular and binocular (stereo) viewing conditions. Error bars in this and subsequent figures indicate standard error. The binocular threshold for Subject 4 at 15° of eccentricity was 63.74 ± 35.44°; the Y axis was truncated for readability purposes.
Using the measured thresholds, we calculated how the cues should be integrated at each eccentricity if they were weighted according to their relative reliabilities (i.e. inversely proportional to their variances; Ernst & Banks, 2002). The predicted weights are shown in Figure 6. The high standard deviations of the measured thresholds relative to their values made the error bars for the predicted data large. As in the previous figure, the group means were weighted relative to the variance of the individual data according to a Bayesian computation that maximized the likelihood of the means. Based on the thresholds, we predicted that contour compression should be weighted about as much as binocular disparity at fixation and at 7.5° of retinal eccentricity. However, at 15° of eccentricity, the measured thresholds predicted that contour compression should influence 3D orientation judgments about five times as much as binocular disparity.
Figure 6.
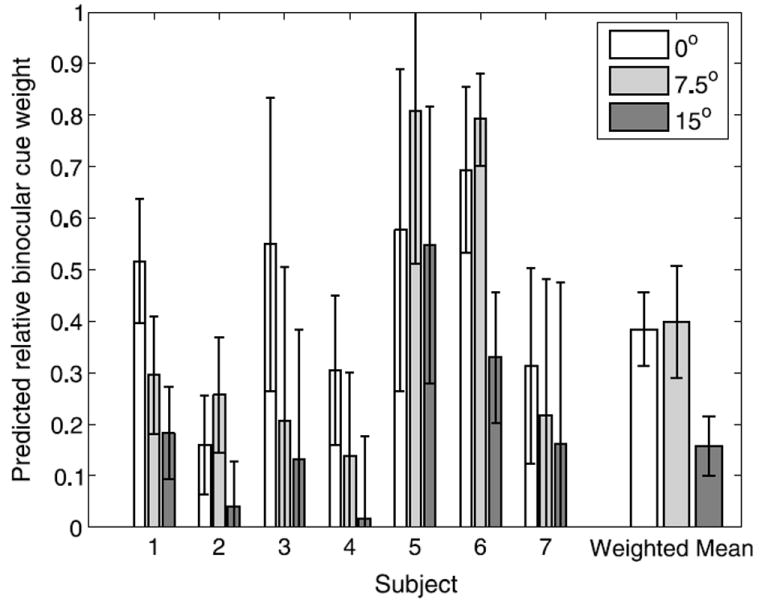
Relative binocular cue weights predicted from threshold data as a function of retinal eccentricity. Error bars indicate standard error.
Discussion
The thresholds we obtained for monocular (aspect ratio) and binocular (disparity) cues indicated a main effect of retinal eccentricity. The smaller number of texture elements and contours present in eccentric targets relative to targets at fixation may potentially have decreased the reliability of both monocular and binocular cues, but prior evidence has shown that the number of dots present in random dot displays do not affect thresholds (Cormack, Landers, & Ramakrishnan, 1997; Harris & Parker, 1992; Knill, 1998). We did not find significant increases in thresholds between fixation and 7.5° of eccentricity. This ran counter to our expectation that thresholds would monotonically increase with retinal eccentricity. One explanation is that the closest edge of the targets at 7.5° of eccentricity was only 4° in the periphery since we defined target eccentricity based on the position of the center of each target relative to the fixation point. Another possibility is that the decision noise outweighed the sensory uncertainty for targets 7.5° in the periphery, and it was not until targets were even further away that the uncertainty due to increased retinal eccentricity dictated performance. At 15° of retinal eccentricity, the thresholds indicated that the information about 3D surface orientation from contour compression was significantly more reliable than information from binocular disparity. This predicts that monocular information should be weighted much more when judging the 3D orientations of more peripheral targets and is consistent with our earlier geometric analysis.
The binocular thresholds may have been inflated if the monocular information that was present in these stimuli influenced subjects’ judgments. The stimuli contained conflicts between the 3D orientations suggested by binocular disparity and the monocular information (the envelope, foreshortening, and density of the dots), which suggested a frontoparallel orientation. Although monocular cues were irrelevant for the binocular discrimination task, subjects may have used them, thus adding noise. We used irregular shapes and circular texture elements to reduce the monocular information present in the stimuli, but even irregular contours provide weak monocular cues (Knill, 2007b). Although observers decrease their reliance on monocular information when there are large conflicts between binocular and monocular cues (Knill, 2007a), reliance on the monocular cues during binocular trials could explain why the binocular thresholds were typically higher than the corresponding monocular thresholds at fixation. It also offers another potential reason for why binocular thresholds at 0° and 7.5° of retinal eccentricity did not significantly differ; noise from the monocular cues probably increased binocular 3D orientation thresholds more at fixation than in the periphery, where noise in the disparity estimates dominated.
Experiment 2: Grasping objects in the periphery
This experiment investigated how the influence of stereopsis on judgments of 3D orientation for a motor control task changed as a function of retinal eccentricity and tested the predictions from Experiment 1. Subjects reached for, grasped, and lifted a disc that was presented on the theoretical horopter at fixation and at two peripheral locations. The disc’s aspect ratio and binocular disparity gradient specified its 3D orientation, and we examined how subjects used these cues to align their fingers with the edges of the disc. Since binocular acuity decreases faster than monocular acuity with increasing retinal eccentricity, subjects would be expected to have relied less on the binocular information as targets moved more peripherally. Alternatively, subjects could have adopted a single strategy for integrating the cues that they applied consistently across the different peripheral locations.
Method
Subjects
Ten naive volunteers from the University of Rochester community participated in this study. Each had normal or corrected-to-normal vision, was sensitive to binocular disparities of 40 seconds of arc or less, was right handed, and could reach the stimuli at all eccentricities with their right hand. Subjects were treated and paid as in Experiment 1.
Apparatus
As illustrated in Figure 7, the configuration of the monitor, mirror, and chinrest matched Experiment 1. Also, as in Experiment 1, an Eyelink II eyetracker was mounted on the stereo glasses. The main visual stimulus was a large virtual coin (7 cm diameter, 0.9525 cm thickness), and a Denso VS 6-axis robot (Denso Corp., Aichi, Japan) placed an aluminum disc (7 cm diameter, 0.9525 cm thickness, 116 g) in the workspace to provide both a clear endpoint for the grasp and haptic feedback at the end of each trial. Having a physical object for subjects to grasp was important because people can behave differently when they are interacting with an object versus pretending to interact with it (Goodale, Jakobson, & Keillor, 1994). The metal disc fit on top of an optical sensor attached to the end of the robot that identified whether the disc was in place, and an Optotrak Data Acquisition Unit II recorded the state of the disc at 120 Hz.
Figure 7.
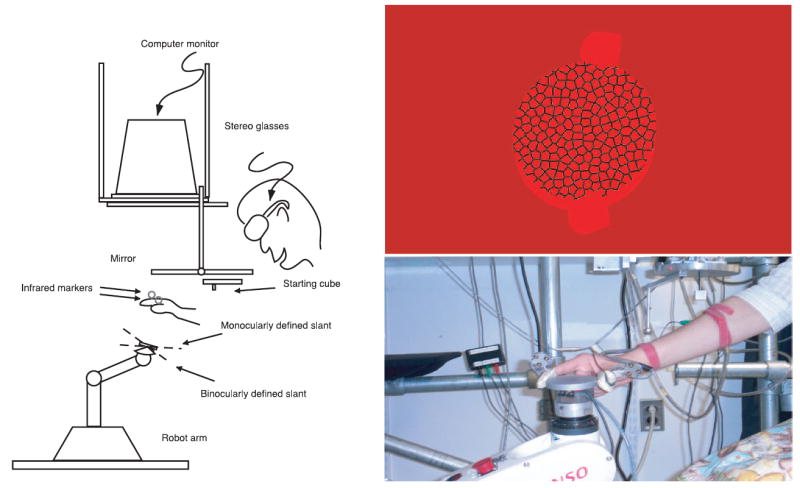
Apparatus used for the grasping tasks in Experiments 2 and 3, an oriented coin with fixation sphere, and a subject grasping the coin.
Subjects wore snugly fitting rubber thimbles on their right thumb and index finger that were used to hold rigid metal tabs in place directly above their fingernails. Small, flat metal surfaces on which we mounted three infrared markers per finger to track the positions of the two fingers throughout each movement were rigidly attached to the tabs. An Optotrak 3020 recorded the 3D positions of these markers at 120 Hz. A metal cube used as the starting position and the metal disc were connected to 5V sources. Subjects wore thimble covers made of electrically conductive fabric (nylon coated with a 2 μm layer of silver; Schlegel Electronic Materials, Inc., Rochester, NY) over the rubber thimbles, and wires sewn to the conductive fabric were connected to the Optotrak Data Acquisition Unit II, which recorded voltages across both the starting cube and metal disc at 120 Hz to identify when the thumb or index finger was in contact with either object.
Calibration procedures
In addition to the viewer and eyetracker calibrations described for Experiment 1, a further calibration procedure determined the coordinate transformation between the Optotrak reference frame and the reference frame of the robot arm. Three infrared markers were attached to the end of the robot arm and moved to different locations within three planes at different distances from the Optotrak. The transformations computed from this procedure and the viewer calibration procedure allowed us to position the robot arm so that the metal disc it held coincided with the virtual disc that appeared in the workspace during the experiment.
A final calibration procedure identified the locations of the points on subjects’ fingertips that they used as the contact points for grasping objects. This required a calibrated device composed of three metal pieces joined to form a corner and a base with three infrared markers attached to one side. Subjects placed each finger into the corner formed by the metal pieces, and the positions of the markers on the metal device and the subject’s fingers were recorded to determine the locations and orientations of the fingertips. Graphical fingertip markers appeared at the computed positions, and subjects confirmed that the markers lined up with their actual fingertips when they moved them within the workspace. Next, a line appeared between the 90° and 270° positions along the top surface of the disc held by the robot arm, and subjects grasped the disc from the side at the ends of the line using a precision grip as if they were going to pick it up. This was repeated five times, and the mean measured positions of their fingers relative to the line determined the contact point for each finger. Subjects verified that crosses centered on the computed contact points appeared at the appropriate locations on their fingertips.
Stimuli
The oriented visual stimuli were similar to the monocular targets in Experiment 1 except that they also contained binocular information and had a height of 0.9525 cm so that their dimensions matched the physical disc that subjects grasped. The thickness of the stimuli allowed subjects’ grasps to deviate by up to ±7.75° from the actual alignment of the physical disc and still contact it along its edge.
Some trials used cue-consistent stimuli displayed at slants of 25–45° in 5° increments, and others included conflicts between the slants suggested by aspect ratio and binocular disparity. Cue conflicts were introduced about a base slant of 35° by changing one or both cues by either +5° or −5°. We generated cue conflicts by rendering the disc and texture at the slant specified for the binocular cues and then distorting them so that when they were projected from the binocular slant to the cyclopean view, the contour and texture indicated the slant specified for the monocular cues on that trial. We computed the appropriate distortion by projecting the vertices of the surface and texture into the virtual image plane of a cyclopean view of the disc using the slant for the monocular cues and then back projected the transformed vertices onto a plane with the specified binocular slant.
The robot arm placed the aluminum disc at the same position and orientation as the virtual disc, although we added up to ±2° of uniformly distributed noise to the mean slant suggested by the visual cues to prevent subjects from using haptic feedback from the physical coin to learn a dependency on either cue (Ernst, Banks, & Bülthoff, 2000). Red thimble-shaped markers co-aligned with the fingertips appeared in the workspace after one of the fingers contacted the target. We used a fixation target with the same appearance and at the same position as in Experiment 1. The specific locations of the fixation point and target were designed to avoid having the subject’s hand cross their line of sight when it was not visible, keep targets close to the accommodative plane of the display, prevent stimuli from appearing in the monocular zones caused by the physiological blind spots, place the peripheral stimuli in positions where they could be reached by most adults, and avoid having the robot arm come too close to subjects.
Procedure
Subjects participated in four 1.5-hour sessions, each consisting of five 66-trial blocks, for a total of 1,320 trials per subject. Each block contained two trials from eleven conditions (five cue-consistent orientations from 25–45° plus six cue-conflict conditions with mismatched combinations of 30°, 35°, and 40° for the monocular and binocular slants) at retinal eccentricities of 0°, 7.5°, and 15°. We administered practice trials at the start of the first session until subjects understood the task and could perform it correctly. Subjects indicated they were ready to begin each trial by looking at the fixation target and grasping a metal cube suspended in the work area to their right and slightly in front of them from the right side so that their thumb was against the nearest face of the cube. After subjects kept their fingers in contact with the cube and maintained visual fixation on the fixation target for 500 ms, the trial began. The oriented disc appeared in the workspace for 750 ms, and then a beep instructed participants to begin reaching toward it. Subjects grasped the disc along its top and bottom edges (at 12 o’clock and 6 o’clock) from the right side with their right hand using a precision grip and lifted it a few centimeters. This pose allowed less variability in the positions of their fingers than approaching the coin from above. We required subjects to lift the disc to encourage them to grasp it in a more stable manner than they might if only required to touch its edges. Visual feedback about the finger positions was never available until subjects touched the disc to prevent them from directly comparing the positions and binocular disparities of the finger symbols to the oriented targets prior to grasping them. Subjects were allowed 2.5 s from the start signal to grasp and remove the coin from its base, but they had to touch the coin within 500–1500 ms after releasing the starting cube. The lower bound prevented subjects from racing through the trials, and the upper bound helped prevent subjects from feeling around for the disc if they missed it on the first attempt.
We required subjects to remain binocularly fixated on the fixation target until they touched the coin, although we trained them during practice trials to maintain fixation until they had lifted it off of the base so that they would not adopt a strategy of touching the coin and then fixating it. A discussion of how we controlled fixation can be found in the Supplementary Material. If subjects performed the trial correctly, the virtual disc exploded and disappeared. Otherwise, if they released the cube prior to the go signal, failed to touch the coin within the specified period of time, did not remove the coin from its base within 2.5 s after the go signal, or lost visual fixation, the computer aborted the trial, displayed an error message, and repeated the trial later in the same block.
At the end of each session, we provided subjects with feedback about their performance based on the variability of their finger orientations on trials with cue-consistent targets presented at fixation. This reflected how accurately they performed the grasping task but was not directly related to any of our hypotheses.
Results
We quantified the effects of the visual cues on task performance using “grasp orientation,” which related the orientation of the fingers to the slant of the coin at the moment on each trial when at least one of the fingers first contacted the target. We calculated grasp orientation using a projection of the vector between the calibrated contact points on the thumb and index finger into the sagittal plane of the observer (see Figure 8). The sagittal plane was perpendicular to the horizontal axis around which surfaces were slanted and was invariant to the position of the stimulus in the visual field. This projection isolated the slant component of the grasp since slant was the only dimension in which the orientation of the coin differed across trials, and it ensured that our measure of slant for any stable grasp was invariant to rotation of the fingers around the circumference of the coin. In Greenwald and Knill (in press), we showed that this measure was sensitive to subjects’ estimates of the 3D orientation of the disc. Two subjects whose standard deviations for cue-consistent targets at 0° of retinal eccentricity exceeded the entire 20° range of presented slants were dismissed early from the study and excluded from the data set; the eight included subjects had standard deviations of 5–8° under the same conditions.
Figure 8.
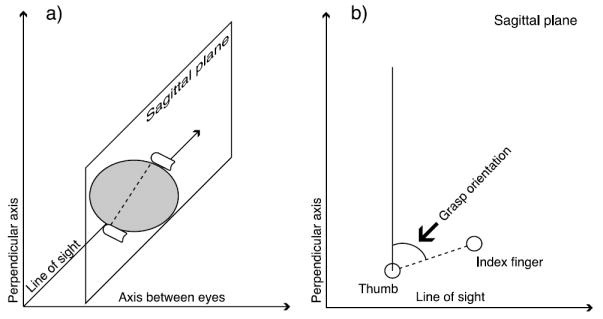
Calculation of grasp orientation. (a) The thumbs grasping the coin and the vector between the contact points, which is projected into the sagittal plane. (b) A view of the sagittal plane from the subject’s right and the grasp orientation angle specified by the projected vector.
Since acuity decreases and uncertainty increases with eccentricity, we expected performance to decrease as targets moved further into the periphery. Figure 9 shows the corrected standard deviations of the grasp orientations for each subject on the cue-consistent trials at each eccentricity. These were the standard deviations of the residuals after fitting the best line relating true stimulus slant to grasp orientation at each eccentricity. They were corrected for the range of orientations that subjects actually used by dividing them by the slopes of the fit lines; we did this because the same uncorrected standard deviation indicates higher variability for a subject who only adjusted their grasp orientations over a few degrees than for a subject who used the full 20° range. A repeated measures ANOVA showed a significant effect of eccentricity on subjects’ variability (F(2,14) = 14.06, p < .01). On average, the corrected standard deviations for targets at both 0° and 7.5° of retinal eccentricity were just over 6°, and the mean standard deviation at 15° of eccentricity was 9.6°, which was significantly higher (0°/15°: t(7) = 3.67, p < .01; 7.5°/15°: t(7) = 4.08, p < .01) than at the other two positions according to paired one-tailed t-tests with the significance level adjusted to .017 for multiple comparisons. The pattern of standard deviations across eccentricities was qualitatively similar to the pattern of uncertainties we measured in Experiment 1, but the standard deviations in the grasping task were slightly higher due to motor variability and measurement errors.
Figure 9.
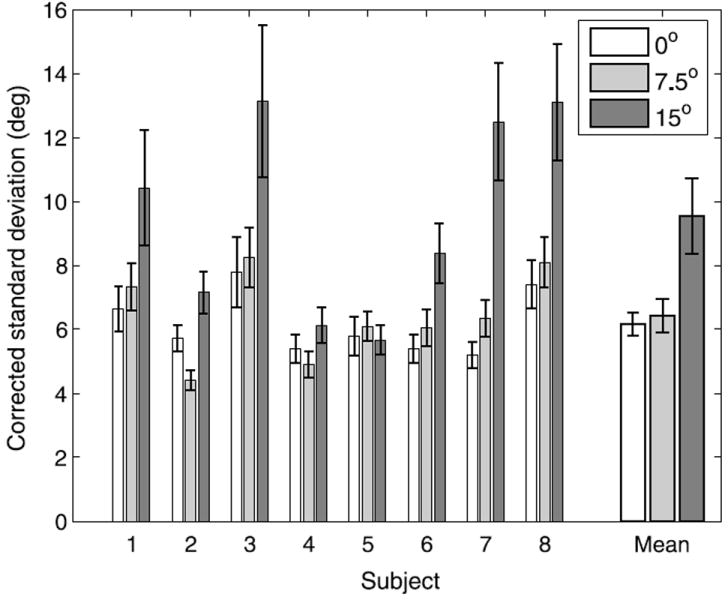
Variability on cue-consistent trials as a function of retinal eccentricity. Subjects’ standard deviations were corrected for the range of slants subjects used by dividing these values by the slope of the line relating the slants of the stimuli to finger orientations. Error bars indicate standard error.
We quantified the contributions of the monocular and binocular cues to grasp orientation at target contact using the cue-conflict trials and the 30°, 35°, and 40° cue-consistent trials (the cue-consistent trials at 25° at 45° were excluded because subjects often showed a bias toward the mean slant (35°) that was more pronounced at these angles) by fitting them as parameters in the following model:
| (2) |
Ŝgrasp was the grasp orientation when one of the fingers first contacted the target, and smono and sbin were the slants suggested by the monocular and binocular cues. wmono and wbin were the relative weights (constrained to sum to 1) that quantified the contributions of the monocular and binocular cues to grasp orientation, and k1 and b1 were multiplicative and additive bias terms. Since some subjects showed small biases that grew over time, we included additive and multiplicative bias parameters (k2 and b2) to account for effects that correlated with trial number (t). The relative binocular cue weights are shown in Figure 10. As expected, the contribution of the binocular cue decreased with retinal eccentricity (F(2,14) = 13.78, p < .01). A one-tailed paired t-test did not show a significant difference in relative binocular weights between targets at 0° and 7.5° of eccentricity (t(7) = 1.83, p = .055), but there was a strong trend in the expected direction. The binocular weight for stimuli presented at 15° in the periphery was significantly lower than the weights for targets at the other two positions (0°/15°: t(7) = 4.77, p < .01; 7.5°/15°: t(7) = 3.82, p < .01; Bonferroni-corrected significance level: .017).
Figure 10.
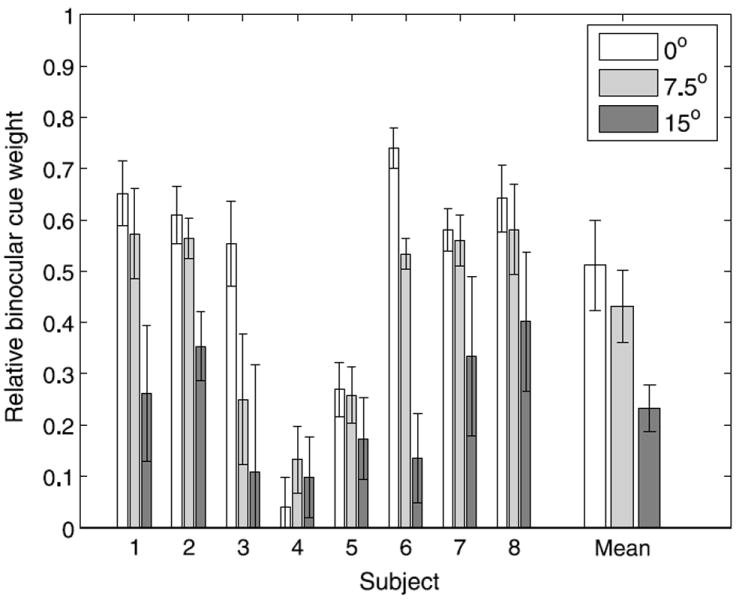
Relative binocular cue weights as a function of retinal eccentricity. Error bars indicate standard error.
We compared the cue weights measured in this experiment to those predicted from the thresholds measured in Experiment 1 (see Figure 11). The mean predicted and measured cue weights did not differ significantly at any of the retinal eccentricities as indicated by unpaired t-tests (0°: t(13) = 0.59, p = .56; 7.5°: t(13) = 0.36, p = .73; 15°: t(13) = 0.40, p = .70). An ANOVA with eccentricity as a repeated measures factor and experiment (predicted versus actual) as a between-subjects factor showed the expected main effect of eccentricity (F(2,26) = 21.29, p <.001) but neither a significant effect of experiment (F(1,13) = 0.25, p = .63) nor a significant interaction between eccentricity and experiment (F(2,26) = 0.09, p = .89), indicating that subjects weighted the cues according to their relative uncertainties. While the predicted binocular cue weights appeared to be somewhat lower than the measured weights, the differences was small and consistent with what one would predict from confounding factors in the threshold measurements. For example, the conflicting monocular cues in the stimuli used to measure stereoscopic slant thresholds may have elevated the measured stereoscopic thresholds and thus led to underestimates of the predicted binocular cue weights.
Figure 11.
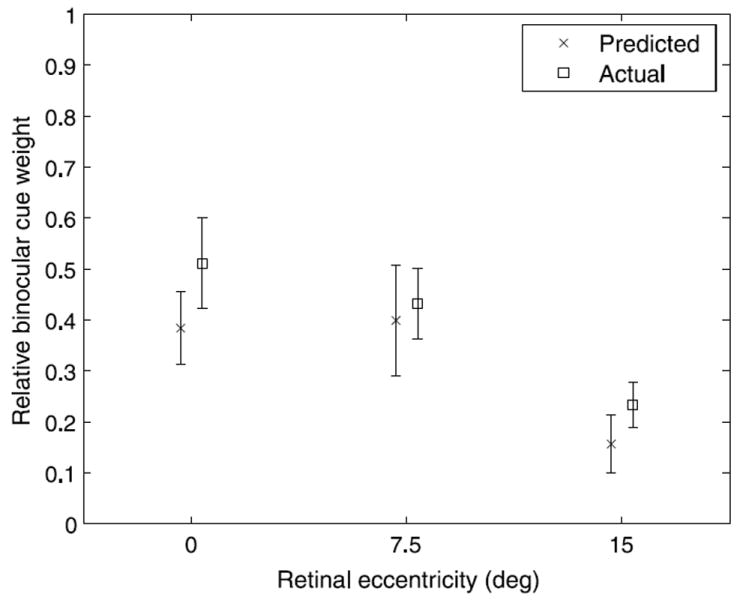
Predicted relative binocular cue weights based on threshold measurements obtained in Experiment 1 compared to the cue weights obtained from the grasping task in Experiment 2. There were no significant differences between predicted and actual cue weights at any of the retinal eccentricities. Error bars represent standard error.
Discussion
The results of this experiment showed that as eccentricity increased, uncertainty about 3D orientation increased, and there was a shift toward relying more on monocular information than on binocular information. Binocular information may have had a greater influence for targets at fixation than at 7.5° of retinal eccentricity, although the difference between these conditions fell short of statistical significance. Given that seven of the eight subjects showed a trend in the expected direction, the effect was probably present but may have been partially obscured by motor or measurement noise or by the closest edge of the targets at 7.5° being within 4° of the fixation point. It may also suggest that the decrease in the influence of binocular information with retinal eccentricity is initially gradual and then accelerates. For targets at 15° of retinal eccentricity, grasp orientation was much more variable, and monocular cues were almost 80% responsible for estimating 3D orientation. These trends were consistent with those from both the geometric analysis and Experiment 1.
As uncertainty about 3D orientation increases with increasing retinal eccentricity, so should the variability of grasp orientation. Overall, this is what we found, although, surprisingly, there was no significant difference in variability for targets at 0° and 7.5° of retinal eccentricity. A potential explanation is that the level of noise due to visual uncertainty was low relative to the motor and measurement noise at these positions.
Our objective was to measure how retinal eccentricity influences visual cue integration, but the temporal dynamics of cue processing can also affect the cue integration process (Greenwald, Knill, & Saunders, 2005). If the rate of visual cue processing depends on the positions of the cues within the visual field, this could have also produced differences in cue influences. We did not measure the temporal dynamics of cue processing in this experiment since the motion transients from the stimulus perturbations would have been more noticeable in the periphery and attempts to mask them would have been problematic for the eyetracker, but we analyzed the time between the beep that instructed subjects to begin moving and when their fingers left the starting cube. The differences between conditions were not large; movements to the 7.5° and 15° targets were respectively initiated 14.9 ± 4.3 ms and 10.3 ± 4.2 ms later than those to targets at fixation. Although the difference between 7.5° and 15° was not significant (t(7) = 1.36, p = .22), a within-subjects repeated measures ANOVA showed a significant increase in this time with eccentricity (F(2,14) = 8.14, p < .01). It is possible that this reflected slower cue processing in the periphery, but, given that information was less reliable in the periphery, subjects may have used the additional milliseconds to reduce their uncertainty. Given the small size of the effect, it seems most likely that the difference in the reliability of information across the visual field was the primary factor driving the effect of retinal eccentricity on cue integration at the different target locations in this experiment.
Experiment 3: Grasping objects off the horopter
Experiment 2 examined cue integration when subjects reached for peripheral targets located on the theoretical horopter, but everyday tasks sometimes require humans to interact with objects that are at different depths from where their eyes are converged. In addition to declining with increasing retinal eccentricity, Andrews, Glennerster, and Parker (2001) and Blakemore (1970) showed that stereoacuity also degrades as targets are moved away from the horopter, and the geometric analysis based on these studies showed that binocular 3D orientation thresholds increase rapidly as the distance from the horopter increases. Our earlier simulation showed that the reliability of monocular information is affected by the retinal size of the target and not by the position of the target relative to the horopter. Experiment 3 quantified how the depth of the target relative to the depth of fixation affects how monocular and binocular visual cues are used for motor control.
Method
Subjects
Ten subjects participated in this experiment. All of the subjects met the same criteria required for Experiment 2 and only participated in this study.
Apparatus, calibration procedures, and stimuli
The apparatus, calibration procedures, and stimuli were identical to those used in Experiment 2.
Procedure
The procedure was the same as in Experiment 2 except that the targets varied in depth rather than in retinal eccentricity. Targets always appeared at 7.5° of retinal eccentricity because it would have difficult for subjects to maintain vergence at the depth of the fixation target if targets were presented at 0° of retinal eccentricity, and Experiments 1 and 2 had shown that task performance and relative cue reliabilities at 7.5° of retinal eccentricity were similar to those at fixation. The coin was positioned on the horopter (0° of horizontal disparity) as approximated using the Vieth-Müller circle or at distances from the horopter producing 0.5° or 1° of horizontal disparity at the center of the coin. The specific target locations varied based on the viewer calibrations, but targets at 0.5° and 1° of disparity were 4.90 ± .13 cm and 10.78 ± .30 cm closer to the subjects than targets on the horopter, respectively. We only used near/crossed disparities, which occur at locations closer than the fixation point, because far/ uncrossed disparities would have required targets to be at distances that would have been impossible for subjects to reach. Since Panum’s area exceeds 1° of horizontal disparity at an eccentricity of 7.5° and an angular position of 45° (Hampton & Kertesz, 1983), all of our targets were within this region and should have been capable of being binocularly fused. During the practice trials that familiarized subjects with the task prior to the start of the experiment, we presented a few targets at the fixation point because this allowed subjects to estimate the physical dimensions of the coin more accurately and seemed to improve task performance.
Results
Figure 12 shows subjects’ performance on cue-consistent trials as a function of horizontal disparity from the horopter. We excluded one subject from the data set for performing at chance levels on trials with cue-consistent targets presented on the Vieth-Müller circle. Some subjects performed better than others, but a within-subjects repeated-measures ANOVA indicated that overall performance did not significantly differ across conditions (F(2,16) = .28, p = .67). This was generally reflected in the variability of each subject across different depths.
Figure 12.
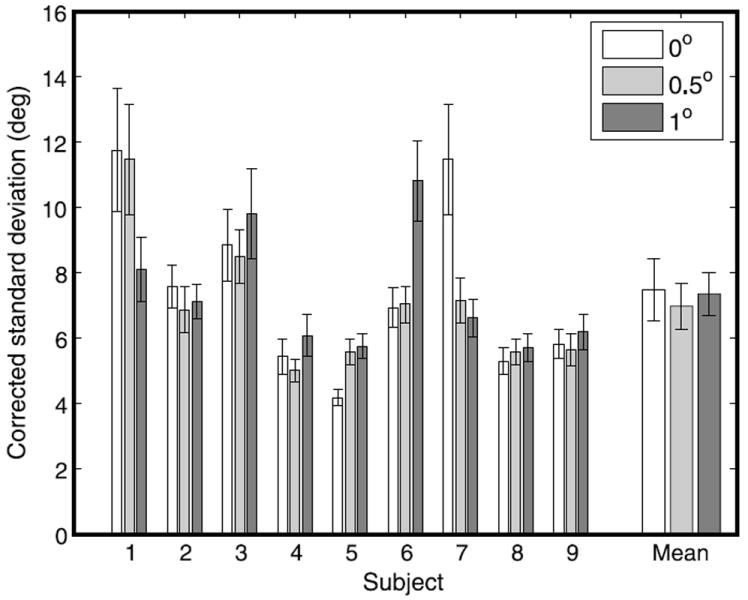
Variability of grasp orientation at contact on cue-consistent trials as a function of the disparity of the target relative to the horopter. Error bars indicate standard error.
We performed the same analysis as in Experiment 2 to quantify the influences of monocular and binocular cues when estimating the 3D orientation of the coin at each depth (see Figure 13). A repeated measures ANOVA indicated that the relative contribution of binocular disparity decreased significantly as the coin moved further from the horopter (F(2,16) = 31.46, p < .001). Post-hoc one-tailed paired t-tests showed that the difference between relative binocular cue influences for targets on the horopter and at 0.5° of convergent disparity was marginally significant (t(8) = 2.25, p = .027) after adjusting the significance level to .017 to account for multiple comparisons, and the difference between 0.5° and 1° from the horopter was significant (t(8) = 8.18, p < .001). With the exception of Subject 8, binocular cue weights for targets 1° from the horopter were not significantly different from zero, indicating that subjects relied entirely on monocular information to estimate 3D orientation.
Figure 13.
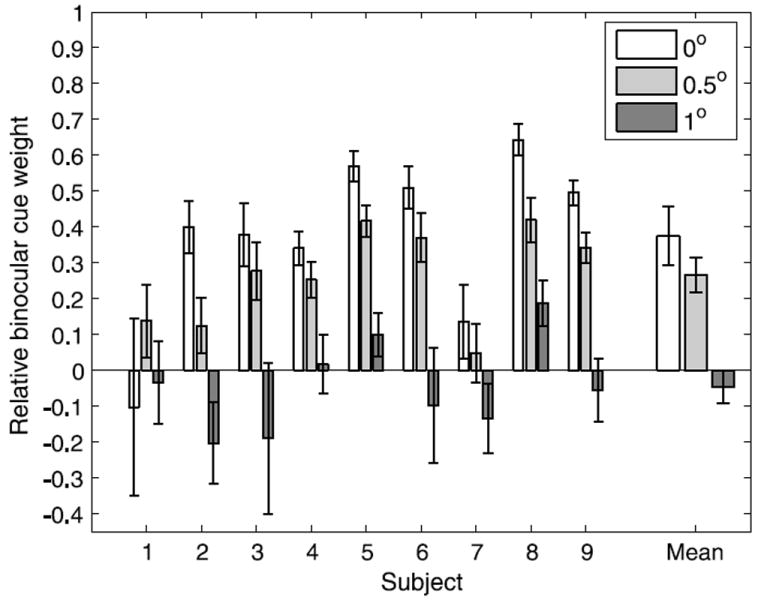
Relative binocular cue weight as a function of the distance of the target from the horopter in degrees of horizontal disparity. Error bars indicate standard error.
Discussion
The geometric analysis we presented earlier showed that as targets move away from the theoretical horopter, the reliability of binocular information decreases but the reliability of monocular information does not, and subjects’ cue integration strategies in the grasping task reflected this. They relied increasingly less on binocular disparity and increasingly more on monocular cues to estimate 3D orientation until they relied entirely on monocular information when targets were 1° of horizontal disparity from the horopter. Interestingly, there were no significant differences in subject variability across different distances from the Vieth-Müller circle, which suggests that the reliability of monocular information did not change across the range of depths we used. This was consistent with our geometric analysis, but an optimal integration strategy would predict that variability should be lower at the horopter because binocular information is more reliable there. High levels of motor and measurement noise relative to the level of sensory noise could explain why the variability did not change significantly with changes in depth.
General discussion
We investigated how humans use binocular cues relative to monocular cues for motor control within different regions of the visual field. A theoretical geometric analysis of monocular and binocular thresholds for 3D orientation using published estimates of visual acuity and stereoacuity predicted that sensitivity to both monocular and binocular information would decrease with increasing retinal eccentricity but that sensitivity to binocular information would decrease more rapidly. It also predicted that as targets moved away from the theoretical horopter, monocular thresholds would remain virtually unchanged but that binocular thresholds would increase by almost a factor of five when targets were 1° away from the horopter. In Experiment 1, we measured monocular and binocular thresholds for judging slant as a function of retinal eccentricity, and, as expected, we found that thresholds for estimating slant from aspect ratio and horizontal disparity increased as targets were moved from the fixation point to 15° in the periphery. We used the measured thresholds to predict the relative influence of binocular information across retinal eccentricities. In Experiment 2, subjects performed a grasping task that required them to judge the orientations of surfaces using monocular and binocular cues, which sometimes conflicted. Subjects’ relative dependence on the cues differed as a function of eccentricity; at fixation, they relied similarly on the monocular and binocular cues, but, as the targets’ retinal eccentricity increased, the relative contribution of stereopsis rapidly declined, and monocular cues were almost 80 percent responsible for slant estimates at 15° of eccentricity. The relative cue influences on the grasping task were not significantly different from the predictions based on the relative cue reliabilities measured in Experiment 1. In Experiment 3, subjects grasped targets that were presented at different depths from the Vieth-Müller circle, and, consistent with the geometric analysis, subjects’ dependence on the monocular information increased with distance from the fixation plane. These experiments showed that subjects modified their visuomotor cue integration strategies based on the relative reliabilities of the available information arriving from different regions of the visual field, and the results were consistent with the idea that information from disparate cues is combined in an optimal way. Since movement planning often depends on information from the peripheral visual field, our findings suggest that how we use information for planning movements can differ from movement execution when movement trajectories are planned prior to target fixation because cue reliabilities and cue integration strategies vary according to the positions of targets within the visual field relative to fixation.
The results of these experiments have important implications regarding the usefulness of binocular information across the visual field. The usefulness of stereopsis at the fixation point has been well established over a wide range of depths, but the useful range in a specific visual scene depends on the depth to which the eyes are converged. If binocular fusion is necessary for stereopsis, then how the size of Panum’s area varies across the visual field is an important consideration. Hampton and Kertesz (1983) found that Panum’s area encompasses a range of about 0.5° about the horopter at fixation and increases to more than 3° at 20° of retinal eccentricity, so binocular fusion is possible over greater ranges in the periphery. However, Ogle (1952) argued that binocular fusion is not necessary for stereoscopic depth percepts and that these percepts are possible even when images appear diplopic. Blakemore (1970) confirmed this and showed that the upper disparity limit extended to several degrees about the horopter at fixation and increased with retinal eccentricity. These studies suggest that we can extract stereoscopic information from a reasonably large volume of visual space in terms of retinal eccentricity and depth. However, these studies examined the absolute limits for using stereopsis, and this is a separate issue from how well we can use the available information. Stereoscopic thresholds decline exponentially as targets move into the periphery or away from the horopter, and, even if sensitivity is sufficient to obtain the gist of how depths vary across a scene, our experiments showed that stereoscopic information in these regions is used much less than available monocular information for performing basic motor tasks. Instead, it seems that the range of the visual field that provides useful stereoscopic information is limited primarily to the central portion of the visual field near the fovea and within 0.5° degrees or so about the horopter. Even if stereopsis is available outside of this space, it appears to be of limited use for performing basic tasks that rely on 3D judgments because other available cues provide more reliable information.
Supplementary Material
Acknowledgments
The authors wish to thank Leslie Richardson for assistance with data collection, Brian McCann for technical assistance, Teresa Williams for helping with the design and construction of the conductive finger thimbles, and Schlegel Electronic Materials for providing a large sample of conductive fabric. Research supported by the National Institutes of Health grant EY013389.
Footnotes
Commercial relationships: none.
Contributor Information
Hal S. Greenwald, Center for Visual Science, University of Rochester, USA
David C. Knill, Center for Visual Science, University of Rochester, USA
References
- Alais D, Burr D. The ventriloquist effect results from near-optimal bimodal integration. Current Biology. 2004;14:257–262. doi: 10.1016/j.cub.2004.01.029. [DOI] [PubMed] [Google Scholar]
- Andrews TJ, Glennerster A, Parker AJ. Stereoacuity thresholds in the presence of a reference surface. Vision Research. 2001;41:3051–3061. doi: 10.1016/s0042-6989(01)00192-4. [DOI] [PubMed] [Google Scholar]
- Armaly MF. The size and location of the normal blind spot. Archives of Ophthalmology. 1969;81:192–201. doi: 10.1001/archopht.1969.00990010194009. [DOI] [PubMed] [Google Scholar]
- Banks MS, Gepshtein S, Landy MS. Why is spatial stereoresolution so low? Journal of Neuroscience. 2004;24:2077–2089. doi: 10.1523/JNEUROSCI.3852-02.2004. [DOI] [PMC free article] [PubMed] [Google Scholar]
- Blakemore C. The range and scope of binocular depth discrimination in man. The Journal of Physiology. 1970;211:599–622. doi: 10.1113/jphysiol.1970.sp009296. [DOI] [PMC free article] [PubMed] [Google Scholar]
- Cormack LK, Landers DD, Ramakrishnan S. Element density and the efficiency of binocular matching. Journal of the Optical Society of America A, Optics, Image Science, and Vision. 1997;14:723–730. doi: 10.1364/josaa.14.000723. [DOI] [PubMed] [Google Scholar]
- Cowey A, Rolls ET. Human cortical magnification factor and its relation to visual acuity. Experimental Brain Research. 1974;21:447–454. doi: 10.1007/BF00237163. [DOI] [PubMed] [Google Scholar]
- Desmurget M, Grafton S. Forward modeling allows feedback control for fast reaching movements. Trends in Cognitive Sciences. 2000;4:423–431. doi: 10.1016/s1364-6613(00)01537-0. [DOI] [PubMed] [Google Scholar]
- Ernst MO, Banks MS. Humans integrate visual and haptic information in a statistically optimal fashion. Nature. 2002;415:429–433. doi: 10.1038/415429a. [DOI] [PubMed] [Google Scholar]
- Ernst MO, Banks MS, Bülthoff HH. Touch can change visual slant perception. Nature Neuroscience. 2000;3:69–73. doi: 10.1038/71140. [DOI] [PubMed] [Google Scholar]
- Fendick M, Westheimer G. Effects of practice and the separation of test targets on foveal and peripheral stereoacuity. Vision Research. 1983;23:145–150. doi: 10.1016/0042-6989(83)90137-2. [DOI] [PubMed] [Google Scholar]
- Goodale MA, Jakobson LS, Keillor JM. Differences in the visual control of pantomimed and natural grasping movements. Neuropsychologia. 1994;32:1159–1178. doi: 10.1016/0028-3932(94)90100-7. [DOI] [PubMed] [Google Scholar]
- Greenwald HS, Knill DC. A comparison of visuomotor cue integration strategies for object placement and prehension. Visual Neuroscience. doi: 10.1017/S0952523808080668. in press. [DOI] [PMC free article] [PubMed] [Google Scholar]
- Greenwald HS, Knill DC, Saunders JA. Integrating visual cues for motor control: A matter of time. Vision Research. 2005;45:1975–1989. doi: 10.1016/j.visres.2005.01.025. [DOI] [PubMed] [Google Scholar]
- Hampton DR, Kertesz AE. The extent of Panum’s area and the human cortical magnification factor. Perception. 1983;12:161–165. doi: 10.1068/p120161. [DOI] [PubMed] [Google Scholar]
- Harris JM, Parker AJ. Efficiency of stereopsis in random-dot stereograms. Journal of the Optical Society of America A, Optics and Image Science. 1992;9:14–24. doi: 10.1364/josaa.9.000014. [DOI] [PubMed] [Google Scholar]
- Hillis JM, Watt SJ, Landy MS, Banks MS. Slant from texture and disparity cues: Optimal cue combination. Journal of Vision. 2004;4(12):1, 967–992. doi: 10.1167/4.12.1. http://journalofvision.org/4/12/1/ [DOI] [PubMed]
- Howard IP, Rogers BJ. Seeing in depth: Depth perception. Vol. 2. Toronto: I Porteous; 2002. [Google Scholar]
- Khan AZ, Crawford JD. Coordinating one hand with two eyes: Optimizing for field of view in a pointing task. Vision Research. 2003;43:409–417. doi: 10.1016/s0042-6989(02)00569-2. [DOI] [PubMed] [Google Scholar]
- Knill DC. Discrimination of planar surface slant from texture: Human and ideal observers compared. Vision Research. 1998;38:1683–1711. doi: 10.1016/s0042-6989(97)00325-8. [DOI] [PubMed] [Google Scholar]
- Knill DC. Learning Bayesian priors for depth perception. Journal of Vision. 2007a;7(8):13, 1–20. doi: 10.1167/7.8.13. http://journalofvision.org/7/8/13/ [DOI] [PubMed]
- Knill DC. Robust cue integration: A Bayesian model and evidence from cue-conflict studies with stereoscopic and figure cues to slant. Journal of Vision. 2007b;7(7):5, 1–24. doi: 10.1167/7.7.5. http://journalofvision.org/7/7/5/ [DOI] [PubMed]
- Knill DC, Saunders JA. Do humans optimally integrate stereo and texture information for judgments of surface slant? Vision Research. 2003;43:2539–2558. doi: 10.1016/s0042-6989(03)00458-9. [DOI] [PubMed] [Google Scholar]
- Land MF, Hayhoe M. In what ways do eye movements contribute to everyday activities? Vision Research. 2001;41:3559–3565. doi: 10.1016/s0042-6989(01)00102-x. [DOI] [PubMed] [Google Scholar]
- Ogle KN. On the limits of stereoscopic vision. Journal of Experimental Psychology. 1952;44:253–259. doi: 10.1037/h0057643. [DOI] [PubMed] [Google Scholar]
- Prince SJ, Rogers BJ. Sensitivity to disparity corrugations in peripheral vision. Vision Research. 1998;38:2533–2537. doi: 10.1016/s0042-6989(98)00118-7. [DOI] [PubMed] [Google Scholar]
- Schreiber KM, Hillis JM, Filippini HR, Schor CM, Banks MS. The surface of the empirical horopter. Journal of Vision. 2008;8(3):7, 1–20. doi: 10.1167/8.3.7. http://journalofvision.org/8/3/7/ [DOI] [PubMed]
- Siderov J, Harwerth RS. Stereopsis, spatial frequency and retinal eccentricity. Vision Research. 1995;35:2329–2337. doi: 10.1016/0042-6989(94)00307-8. [DOI] [PubMed] [Google Scholar]
- Steinman RM, Cushman WB, Martins AJ. The precision of gaze: A review. Human Neurobiology. 1982;1:97–109. [PubMed] [Google Scholar]
- Thibos LN, Cheney FE, Walsh DJ. Retinal limits to the detection and resolution of gratings. Journal of the Optical Society of America A, Optics and Image Science. 1987;4:1524–1529. doi: 10.1364/josaa.4.001524. [DOI] [PubMed] [Google Scholar]
Associated Data
This section collects any data citations, data availability statements, or supplementary materials included in this article.


