

Abstract
A companion paper describes three extensions to a classification system for pediatric speech sound disorders termed the Speech Disorders Classification System (SDCS). The SDCS uses perceptual and acoustic data reduction methods to obtain information on a speaker’s speech, prosody, and voice. The present paper provides reliability estimates for the two perceptual methods (narrow phonetic transcription; prosody-voice coding) and the acoustic analysis methods the SDCS uses to describe and classify a speaker’s speech competence, precision, and stability. Speech samples from 10 speakers, 5 with significant motor speech disorder and 5 with typical speech, were remeasured to estimate intrajudge and interjudge agreement for the perceptual and acoustic methods. Each of the speakers completed five speech tasks (total = 50 datasets), ranging in articulatory difficulty for the speakers, with consequences for the difficulty level of data reduction. Point-to-point percentage of agreement findings for the two perceptual methods were as high or higher than reported in literature reviews and from previous studies conducted within our laboratory. Percentage of agreement findings for the acoustics tasks of segmenting phonemes, editing fundamental frequency tracks, and estimating formants ranged from values in the mid 70% to 100%, with most estimates in the mid 80% to mid 90% range. Findings are interpreted as support for the perceptual and acoustic methods used in the SDCS to describe and classify speakers with speech sound disorders.
Background
Purpose
A companion paper (Shriberg, Fourakis, et al., 2010) describes extensions to the Speech Disorders Classification System, (SDCS), a set of terms and methods used to describe and classify speakers with speech sound disorders. The goal of the present report is to estimate the reliability of the three data reduction methods used in the SDCS: narrow phonetic transcription, prosody-voice coding, and acoustic analyses. We are not aware of any comparable studies reporting reliability data for these three data reduction methods using the same data sets. Discussions of issues and findings in the individual reliabilities of each of the three methods are available in the textbooks in communicative disorders that teach these skills, and in individual research papers in which an estimate of the reliability of data reduction methods is a requirement. Reviews of reliability estimate findings for each of the three methods in speech sound disorders are beyond the scope of the present report. Essentially, point-to-point, intradjuge and interjudge agreement in the 80% to 90% range are considered acceptable for most research needs, agreement in 70% range marginally acceptable, and agreement below 70% unacceptable. For literature reviews and extended discussion, see Shriberg and Kent, 2003, Appendix D; Shriberg and Lof, 1991; McSweeny and Shriberg, 1995; and Hillenbrand, Getty, Clark, and Wheeler (1995).
Data reduction methods in the SDCS
It is useful to summarise the data reduction methods for the SDCS reported in Shriberg, Fourakis, et al. (2010). As described in the companion paper, the concept of acoustic-aided transcription was based on the availability of waveform displays on the laptops used to play back the audio and video signals from the assessment sessions. Figure 1 (Figure 3 in the companion paper) includes the screen display that illustrates the availability of acoustic information to the transcriber/prosody-voice coder. The X-line indicates the target stimuli to be imitated or the transcriber’s gloss of a spontaneous word or utterance. The Y-line is the transcriber’s putative phonetic representation of the speaker’s intended output. The Z-line is the transcriber’s narrow phonetic transcription of the speaker’s realized output. The waveform at the bottom of the display provides information that helps to distinguish presence-absence of speech. Prosody-voice coding of continuous speech data is accomplished by the transcriber following a set of procedures originally described in the Prosody-Voice Screening Profile (PVSP: Shriberg, Kwiatkowski, & Rasmussen, 1990) and updated for processing in the PEPPER (Programs to Examine Phonetic and Phonologic Evaluation Records; [Shriberg, Allen, McSweeny, & Wilson, 2001]) environment.
Figure 1.
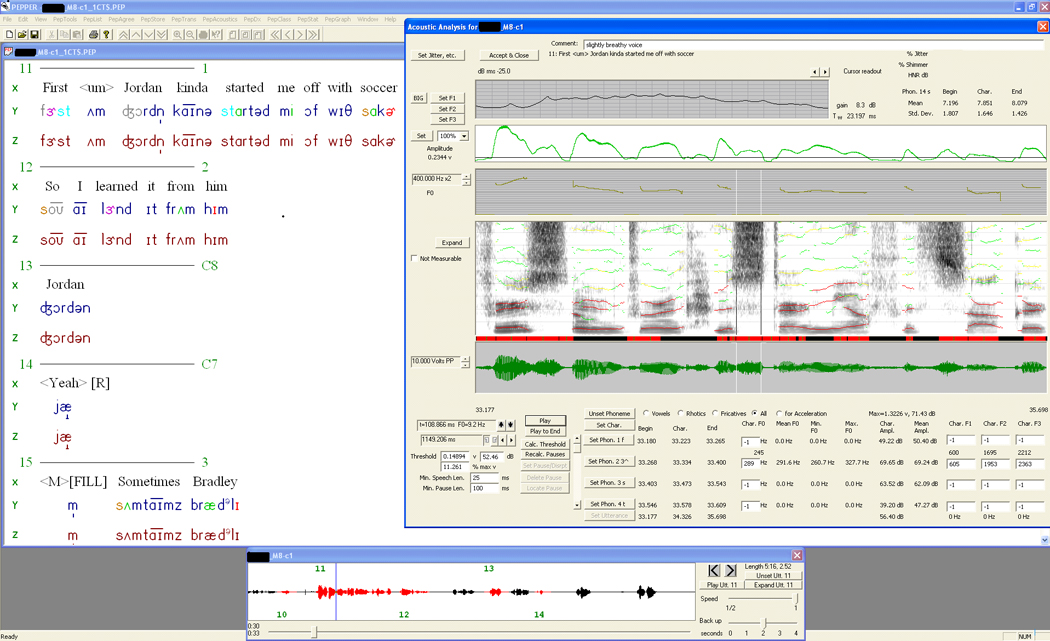
Sample screen from the software in the PEPPER environment (Shriberg, Allen, McSweeny, & Wilson, 2001) used for narrow phonetic transcription and prosody-voice coding. See text for description of the elements in the screen display.
Figure 3.
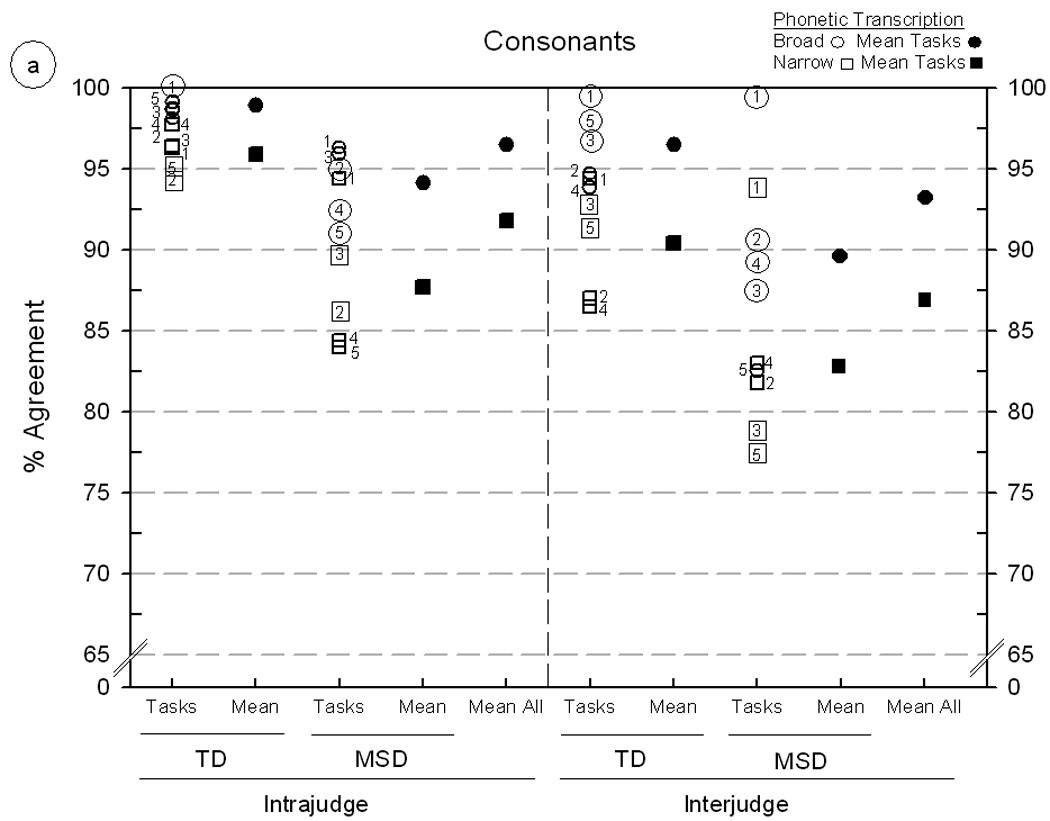
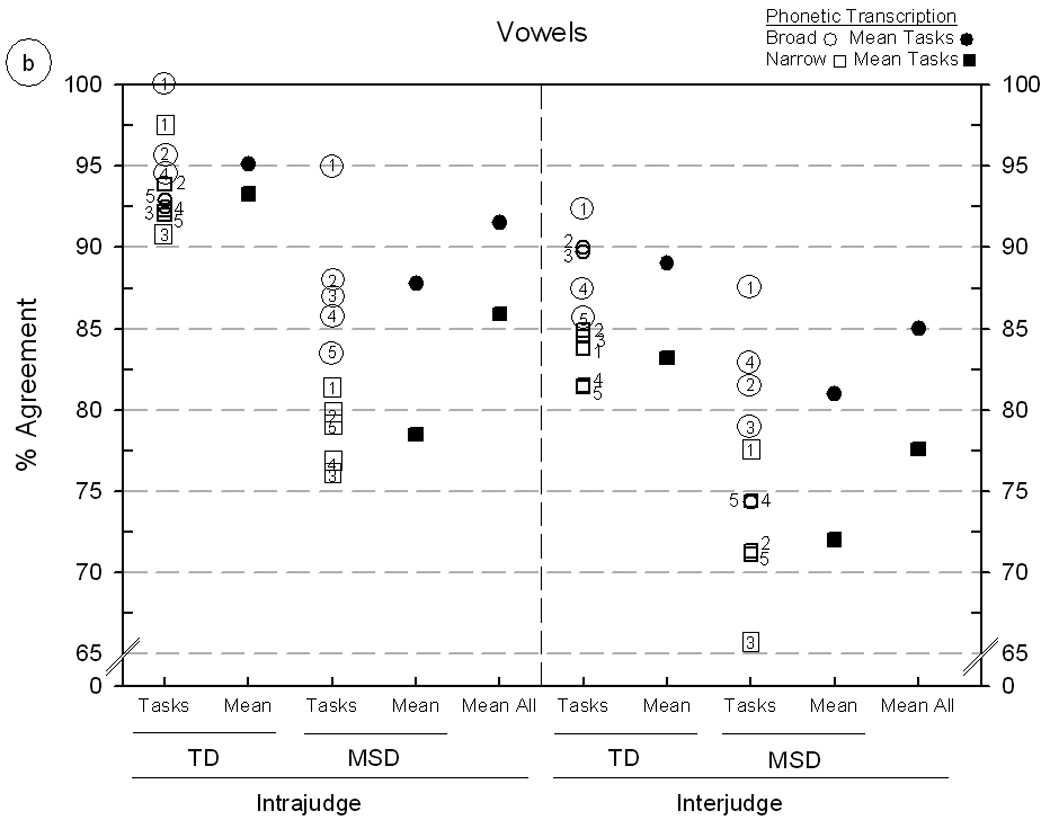
Intrajudge and interjudge reliability estimates for broad and narrow phonetic transcription of five Madison Speech Assessment Protocol (MSAP) tasks from five speakers with typically developing (TD) speech and five speakers with motor speech disorder (MSD). Figures 3a and 3b include findings for consonant and vowel agreement, respectively. The MSAP tasks are keyed as follows: Vowel Task 1 = 1, GFTA-2 = 2, Lexical Stress Task = 3, Continuous Speech Sample = 4, and Challenging Words Task = 5. See text for description of the two transcription metrics.
The third data reduction method, acoustic analyses, is guided by the transcriber’s glossed and color-coded transcript. As illustrated in figure 1, the transcriber uses codes to indicate which items (i.e. sounds, words, utterances) are to be included in the acoustic analyses. For example, the transcriber’s differentiation between speech sound substitutions and speech sound distortions determines which responses are eligible for acoustic analyses of vowels and consonants in specified speech tasks (i.e. acoustic analyses quantify distortions of the same target phoneme). Moreover, using a set of exclusionary codes, the transcriber determines the 24 utterances in a conversational speech sample that are eligible for a subset of acoustic analyses. Acoustic analyses procedures described in the companion paper are reviewed later in context. With appropriate training, one person can complete, in sequence, the three data reduction tasks of narrow phonetic transcription, prosody-voice coding, and acoustic analyses.
Method
Speech tasks
The companion article describes an extension to the SDCS termed the Madison Speech Assessment Protocol (MSAP). The MSAP includes 25 tests and tasks, some of which were developed specifically for the SDCS and some available from other researchers in SSD or available commercially. Most of the 15 tests/tasks that sample speech production were developed to assess a speaker’s competence, precision, and stability in specific segmental and suprasegmental domains (e.g. sounds, sound classes, challenging words, linguistic stress, and so forth). For ease of reference, figure 2 is a copy of a figure in the companion article that illustrates the hierarchical organization of tasks by mode (imitative, spontaneous), linguistic unit (sound, syllable, word, utterance), and articulatory complexity (simple, complex). As shown at the bottom of figure 2, this organization yields a potential scaling (left to right) of the difficulty levels of each task for speakers, with implications for the reliability of data reduction.
Figure 2.
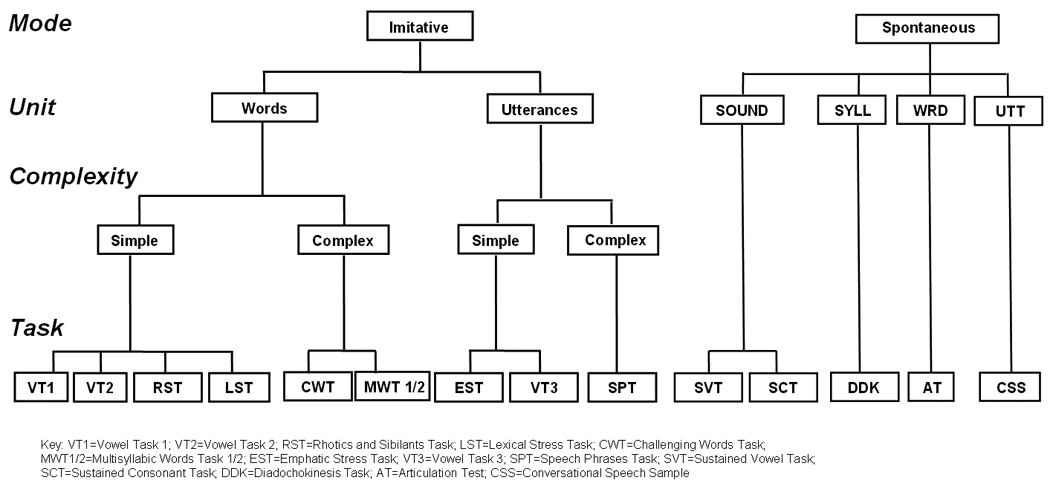
The Madison Speech Assessment Protocol (MSAP) speech sampling context hierarchy.
The tasks selected for the present reliability estimates study, in the order shown in figure 2, were Vowel Task 1 (VT1: imitative, word, simple-one syllable); Lexical Stress Task (LST: imitative, word, simple-two syllables); Challenging Words Task (CWT: imitative, words, complex-two and three syllables); Goldman-Fristoe Articulation Test-2 (GFTA-2 [titled AT=Articulation Task in figure 2]: spontaneous, words, simple-complex); and, Conversational Speech Sample (CSS: spontaneous, utterances, simple and complex words).
Participants
Table 1 includes information for the 10 participants selected to estimate the reliability of phonetic transcription, prosody-voice coding, and acoustic analyses used in typologic and etiologic classification using the SDCS. Responses to the five MSAP tasks from five participants were selected from a database of Typically-Developing (TD) speakers used to standardise MSAP scores. Responses to the five MSAP tasks listed above from another five participants with Motor Speech Disorders (MSD) were selected to estimate the reliability of SDCS data in speakers with significant speech sound disorders. Shriberg, Potter, and Strand (2010) includes descriptions of both the TD speakers and the speakers with MSD associated with a metabolic disorder (galactosemia). The five TD speakers were randomly selected from younger-aged participant groups to maximize the occurrence of speech sound errors. The five MSD speakers were randomly selected from a subgroup of 24 participants with galactosemia and significant speech delay who had the least amount of missing data on the MSAP tasks. Three of the 24 participants were classified as having Childhood Apraxia of Speech using the classification procedures described in Shriberg, Potter, and Strand (2010). As shown in table 1, these sampling criteria yielded a set of speakers that included a larger proportion of males in the MSD compared to the TD group, and a somewhat older group of MSD compared to TD speakers.
Table 1.
Descriptive statistics for the 10 participants whose speech samples were selected to estimate the reliability of data reduction methods used in the Speech Disorders Classification System (SDCS).
| Typically Developing (TD) |
Motor Speech Disorders (MSD) |
|||||||
|---|---|---|---|---|---|---|---|---|
| n | M | SD | Range | n | M | SD | Range | |
| Description | ||||||||
| Male | 2 | 5 | ||||||
| Female | 3 | 0 | ||||||
| Age (yrs) | 7.3 | 2.8 | 4.3–10.4 | 10.4 | 4.8 | 4.6–16.2 | ||
| MSAP Tasks | ||||||||
| Conversational Speech Sample (CSS) | 5 | 5 | ||||||
| Goldman-Fristoe Test of Articulation (2nd ed.;GFTA-2) | 5 | 5 | ||||||
| Challenging Words Test (CWT) | 5 | 3 | ||||||
| Lexical Stress Task (LST) | 5 | 5 | ||||||
| Vowel Task 1 (VT1) | 5 | 5 | ||||||
| Competence Indicesa | ||||||||
| Segmental | ||||||||
| Vowels-PVC | 99.4 | 0.4 | 98.9–100 | 89.4 | 8.4 | 76.0–98.6 | ||
| Consonants-PCC | 95.2 | 5.4 | 86.5–99.2 | 82.2 | 12.2 | 64.0–97.8 | ||
| Vowels & Consonants-II | 98.9 | 1.7 | 95.9–100 | 87.3 | 18.5 | 54.8–99.3 | ||
| Suprasegmentalb | ||||||||
| Prosody | ||||||||
| % App. Phrasing | 90.8 | 5.4 | 83.3–95.8 | 77.1 | 10.4 | 66.7–87.5 | ||
| % App. Rate | 100 | 0 | N/A | 68.2 | 31.1 | 29.2–100 | ||
| % App. Stress | 90 | 9.1 | 75–100 | 83.6 | 12.4 | 63.6–91.7 | ||
| Voice | ||||||||
| % App. Loudness | 94.2 | 6.3 | 87.5–100 | 97.5 | 3.7 | 91.7–100 | ||
| % App. Pitch | 93.2 | 5.7 | 87–100 | 99.2 | 1.9 | 95.8–100 | ||
| % App. Laryngeal Quality | 93.3 | 7.6 | 83.3–100 | 72.5 | 12.4 | 54.6–87.0 | ||
| % App. Resonance | 99.2 | 1.9 | 95.8–100 | 69.6 | 37.4 | 4.2–95.8 | ||
PVC=Percentage of Vowels Correct; PCC=Percentage of Consonants Correct; II=Intelligibility Index (Percentage of Intelligible Words)
The percentage of 24 utterances in the conversational speech sample coded as appropriate for each of the seven prosody-voice domains.
Table 1 includes competence statistics (mean, standard deviation, range) for the reliability study participants. The competence indices, based on narrow phonetic transcription and prosody-voice coding of participants’ conversational speech, are organised to profile speakers’ competence in each of 10 linguistic domains. Shriberg, Fourakis et al. (2010) provides additional information on each of the 10 linguistic domains. As desired for the research design, the MSD speakers have lower average competence than the TD participants. Values for each of the three descriptive statistics for each competence index are interpreted as support for viewing the reliability estimates as based on a suitably challenging corpus of typical and atypical speech.
Transcribers/prosody-voice coders and acoustic analysts
Two transcribers/prosody-voice coders and four acoustic analysts (one of whom was one of the transcribers) participated in the reliability studies. The more and less experienced transcribers/prosody-voice coders had 15 and seven years of experience, respectively. The two primary acoustic analysts had 14 and five years of experience (the latter analyst is the transcriber/prosody-voice coder with seven years of perceptual data reduction experience). Two additional research assistants were trained by the primary acoustic analysts over several months to complete segmentation and pitch editing (see next section) for a subset of the data. PEPPER programs provided computer-based, point-to-point analyses of the phonetic transcription and prosody-voice coding agreements, and the acoustic analyses point-to-point estimates were calculated manually.
Datasets
Table 2 provides complete information on the number of remeasurements used to estimate reliabilities for narrow phonetic transcription, prosody-voice coding, and acoustic analyses. Remeasurement tallies are broken out by variables that are discussed in Results. As indicated by the entries in table 2, most reliability estimates to be reported in the following section are based on hundreds of point-to-point intrajudge and interjudge comparisons. Conventional percentage of agreement procedures were used to estimate the reliability of the two perceptual methods. The section of Results that includes reliability estimates for the acoustic analyses includes information on the procedures used to compute reliability of these continuous measures, including procedures used to remove outliers.
Table 2.
Summary of remeasurements obtained to estimate the reliability of data reduction methods in the Speech Disorders Classification System (SDCS).
| Agreement | Speakers | ||||||
|---|---|---|---|---|---|---|---|
| Intrajudge | MSAP Tasks |
Narrow Phonetic Transcription | PVSP | ||||
| Format | Evocation | No. of Words Compared |
No. of Utterances Compared |
No. of Utterances Compared |
|||
| TD | |||||||
| VT | single words | imitated | 80 | ** | ** | ||
| LST | single words | imitated | 126 | ** | ** | ||
| CWT | single words | imitated | 180 | ** | ** | ||
| GFTA | single words | spontaneous | 259 | ** | ** | ||
| CSS | utterances | spontaneous | 953 | 185 | 120 | ||
| MSD | |||||||
| VT | single words | imitated | 80 | ** | ** | ||
| LST | single words | imitated | 129 | ** | ** | ||
| CWT | single words | imitated | 107 | ** | ** | ||
| GFTA | single words | spontaneous | 260 | ** | ** | ||
| CSS | utterances | spontaneous | 1224 | 331 | 118 | ||
| Interjudge | |||||||
| TD | |||||||
| VT | single words | imitated | 80 | ** | ** | ||
| LST | single words | imitated | 128 | ** | ** | ||
| CWT | single words | imitated | 180 | ** | ** | ||
| GFTA | single words | spontaneous | 258 | ** | ** | ||
| CSS | utterances | spontaneous | 969 | 185 | 120 | ||
| MSD | |||||||
| VT | single words | imitated | 80 | ** | ** | ||
| LST | single words | imitated | 126 | ** | ** | ||
| CWT | single words | imitated | 107 | ** | ** | ||
| GFTA | single words | spontaneous | 259 | ** | ** | ||
| CSS | utterances | spontaneous | 1188 | 331 | 118 | ||
| Agreement | Speakers | |||||||||
|---|---|---|---|---|---|---|---|---|---|---|
| Intrajudge | MSAP Tasks |
Vowel Segment Duration Original and Reliability Estimates |
Consonant Segment Duration Original and Reliability Estimates |
|||||||
| Original | Remeasured | With outliers removed | Percentage Outliers | Original | Remeasured | With outliers removed | Percentage Outliers | |||
| TD | ||||||||||
| VT | ||||||||||
| LST | ||||||||||
| CWT | ||||||||||
| GFTA | 135 | 129 | 121 | 6.2 | ||||||
| CSS | 531 | 530 | 498 | 6.0 | 165 | 162 | 156 | 3.7 | ||
| MSD | ||||||||||
| VT | 73 | 70 | 66 | 5.7 | ||||||
| LST | 76 | 73 | 70 | 4.1 | 21 | 16 | 15 | 6.3 | ||
| CWT | 70 | 70 | 66 | 5.7 | 79 | 73 | 72 | 1.4 | ||
| GFTA | ||||||||||
| CSS | 554 | 539 | 518 | 3.9 | 149 | 147 | 142 | 3.4 | ||
| Interjudge | ||||||||||
| TD | ||||||||||
| VT | 142 | 142 | 130 | 8.5 | ||||||
| LST | 148 | 154 | 147 | 4.5 | 38 | 32 | 29 | 9.4 | ||
| CWT | 135 | 124 | 116 | 6.5 | ||||||
| GFTA | 38 | 32 | 29 | 9.4 | ||||||
| CSS | 531 | 517 | 491 | 5.0 | 165 | 161 | 157 | 2.5 | ||
| MSD | ||||||||||
| VT | 73 | 73 | 68 | 6.8 | ||||||
| LST | 76 | 72 | 69 | 4.2 | 21 | 15 | 14 | 6.7 | ||
| CWT | 70 | 70 | 68 | 2.9 | ||||||
| GFTA | 79 | 72 | 68 | 5.6 | ||||||
| CSS | 554 | 551 | 526 | 4.5 | 149 | 149 | 137 | 8.1 | ||
| Agreement | Speakers | |||||||||
|---|---|---|---|---|---|---|---|---|---|---|
| Intrajudge | MSAP Tasks |
Fundamental Frequency (F0) Original and Reliability Estimates |
First Formant (F1) Original and Reliability Estimates |
|||||||
| Original | Remeasured | With outliers removed |
Percentage Outliers |
Original | Remeasured |
With outliers removed |
Percentage Outliers |
|||
| TD | ||||||||||
| VT | ||||||||||
| LST | ||||||||||
| CWT | ||||||||||
| GFTA | ||||||||||
| CSS | 88 | 70 | 65 | 7.1 | ||||||
| MSD | ||||||||||
| VT | 73 | 70 | 68 | 2.9 | 73 | 69 | 63 | 8.7 | ||
| LST | 76 | 73 | 68 | 6.8 | ||||||
| CWT | 67 | 68 | 65 | 4.4 | ||||||
| GFTA | ||||||||||
| CSS | 548 | 533 | 524 | 1.7 | 117 | 44 | 42 | 4.5 | ||
| Interjudge | ||||||||||
| TD | ||||||||||
| VT | 140 | 137 | 135 | 1.5 | ||||||
| LST | 142 | 142 | 138 | 2.8 | ||||||
| CWT | 148 | 154 | 148 | 3.9 | ||||||
| GFTA | 270 | 251 | 244 | 2.8 | ||||||
| CSS | 1060 | 1030 | 994 | 3.5 | 88 | 73 | 69 | 5.5 | ||
| MSD | ||||||||||
| VT | 73 | 73 | 70 | 4.1 | 73 | 72 | 70 | 2.8 | ||
| LST | 76 | 71 | 71 | 0.0 | ||||||
| CWT | 67 | 70 | 68 | 2.9 | ||||||
| GFTA | ||||||||||
| CSS | 548 | 544 | 538 | 1.1 | 117 | 79 | 74 | 6.3 | ||
| Agreement | Speakers | |||||||||
|---|---|---|---|---|---|---|---|---|---|---|
| Intrajudge | MSAP Tasks |
Second Formant (F2) Original and Reliability Estimates |
Third Formant (F3) Original and Reliability Estimates |
|||||||
| Original | Remeasured outliers |
With removed |
Percentage Outliers |
Original | Remeasured | With outliers removed |
Percentage Outliers |
|||
| TD | ||||||||||
| VT | ||||||||||
| LST | ||||||||||
| CWT | ||||||||||
| GFTA | ||||||||||
| CSS | 88 | 70 | 67 | 4.3 | 88 | 70 | 64 | 8.6 | ||
| MSD | ||||||||||
| VT | 73 | 69 | 67 | 2.9 | 71 | 66 | 64 | 3.0 | ||
| LST | ||||||||||
| CWT | ||||||||||
| GFTA | ||||||||||
| CSS | 117 | 44 | 41 | 6.8 | 116 | 44 | 42 | 4.5 | ||
| Interjudge | ||||||||||
| TD | ||||||||||
| VT | 142 | 139 | 135 | 2.9 | 142 | 139 | 132 | 5.0 | ||
| LST | ||||||||||
| CWT | ||||||||||
| GFTA | ||||||||||
| CSS | 88 | 73 | 70 | 4.1 | 88 | 73 | 68 | 6.8 | ||
| MSD | ||||||||||
| VT | 73 | 72 | 67 | 6.9 | 71 | 70 | 68 | 2.9 | ||
| LST | ||||||||||
| CWT | ||||||||||
| GFTA | ||||||||||
| CSS | 117 | 80 | 76 | 5.0 | 116 | 78 | 76 | 2.6 | ||
Results
Reliability estimates for phonetic transcription
Figure 3 is a display of the point-to-point percentage of agreement findings for phonetic transcription. For each of two agreement metrics, broad and narrow phonetic transcription, individual and mean agreement percentages for consonants (Panel A) and vowels (Panel B) are organised by type of reliability (intrajudge, interjudge), speaker group (TD, MSD), and the five MSAP tasks. To provide reliability information on each of the five MSAP tasks in both panels, all percentages of agreement for each task were first averaged to determine the overall rank order of agreement percentages. Over all pairwise comparisons, the order of tasks from highest to lowest mean percentage of agreement was: (1) Vowel Task 1 (VT1), (2) Goldman-Fristoe Articulation Test-2 (GFTA-2), (3) Lexical Stress Task (LST), (4) Conversational Speech Sample (CSS), and (5) Challenging Words Task (CWT). This sequence is generally, but not perfectly, similar to their left-to-right positions at the bottom of figure 2. These rank-ordered numbers (1–5) are also used to denote the five tasks in figure 4 and figure 5 (see figure legends for additional conventions). The two agreement metrics in the key for figure 3 reflect increasing agreement stringency. Broad phonetic transcription agreement requires only matching phoneme symbols in the transcript comparisons, whereas narrow phonetic transcription agreement requires agreement for both the phoneme and all diacritic symbols.
Figure 4.
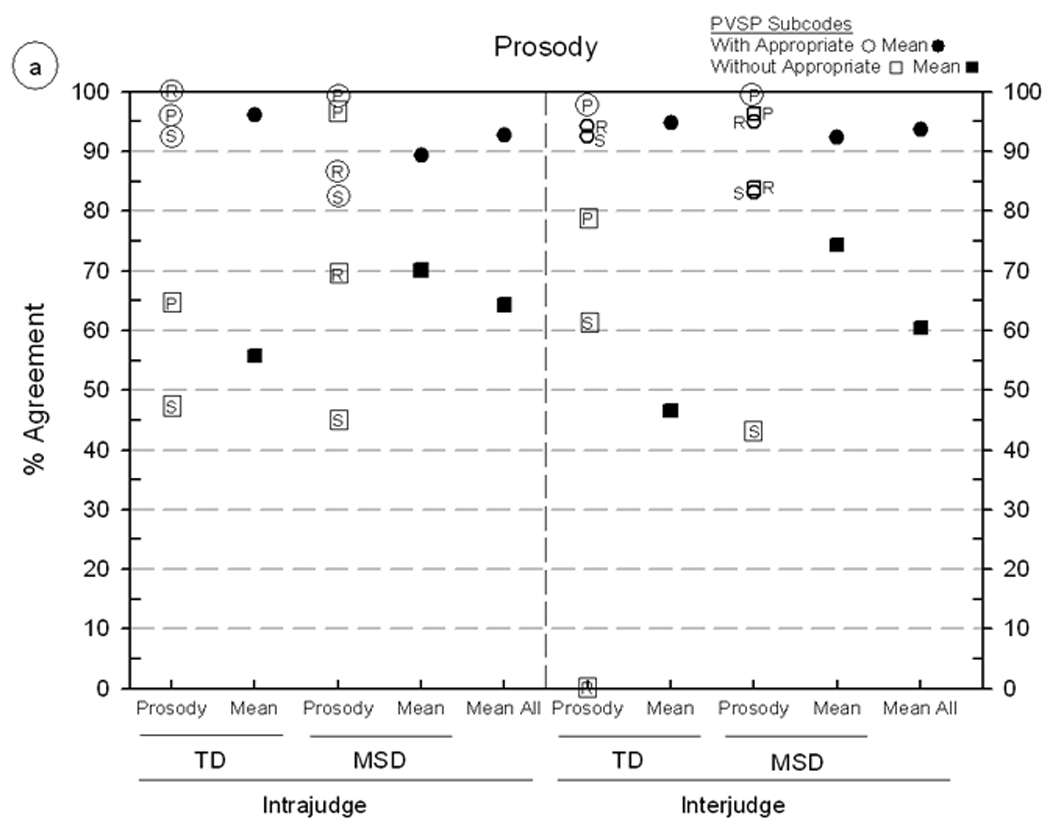
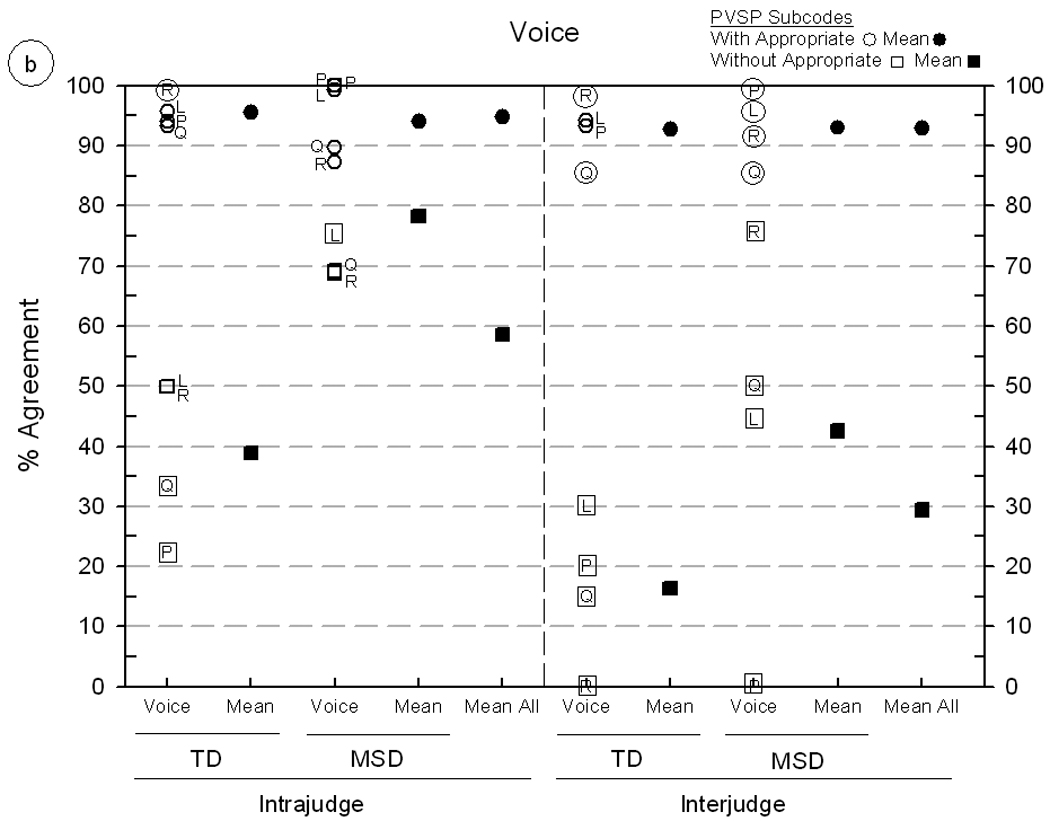
Intrajudge and interjudge reliability estimates for Prosody-Voice Screening Profile (PVSP coding at two levels of sensitivity) using continuous speech samples from five speakers with typically-developing speech (TD) and five speakers with motor speech disorder (MSD). Panel A includes findings for Prosody agreement, including Phrasing (P), Rate (R) and Stress (S). Panel B includes findings for Voice agreement, including Loudness (L), Pitch (P), Laryngeal Quality (Q) and Resonance (R). Shriberg, Fourakis, et al. (2010) includes additional information on these seven PVSP domains and the two prosody-voice coding metrics.
Figure 5.
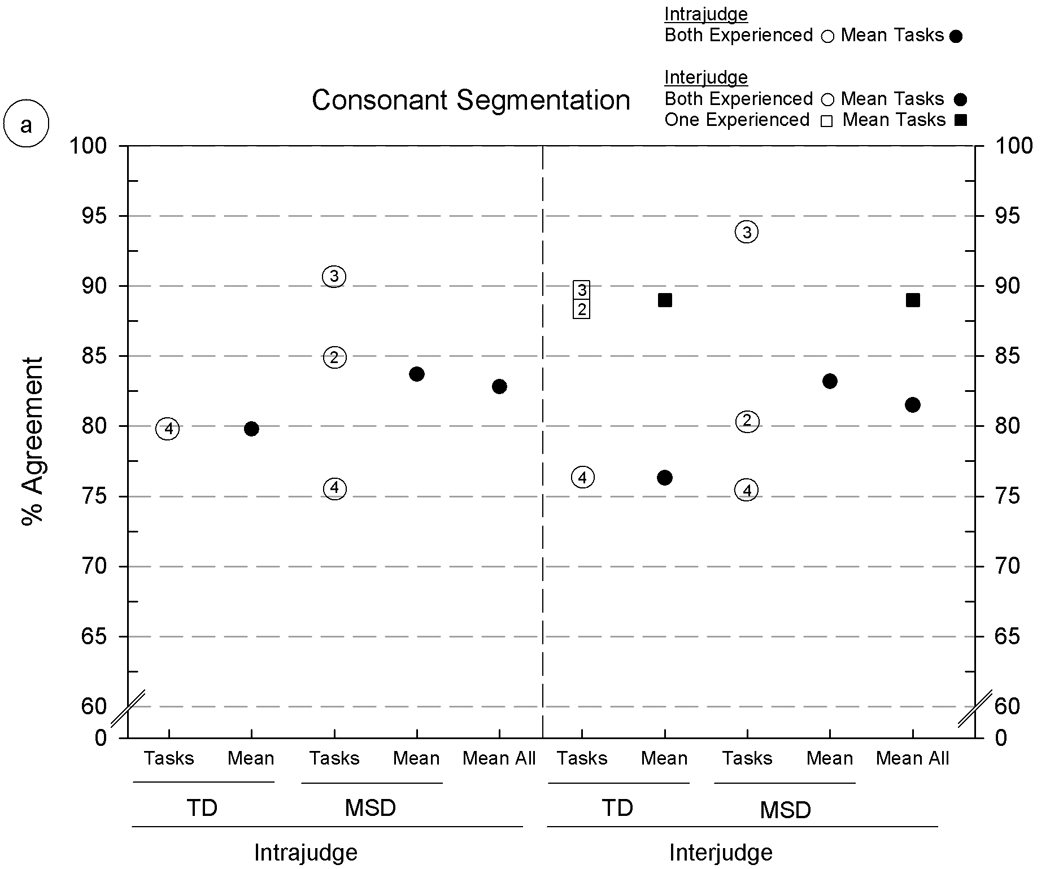
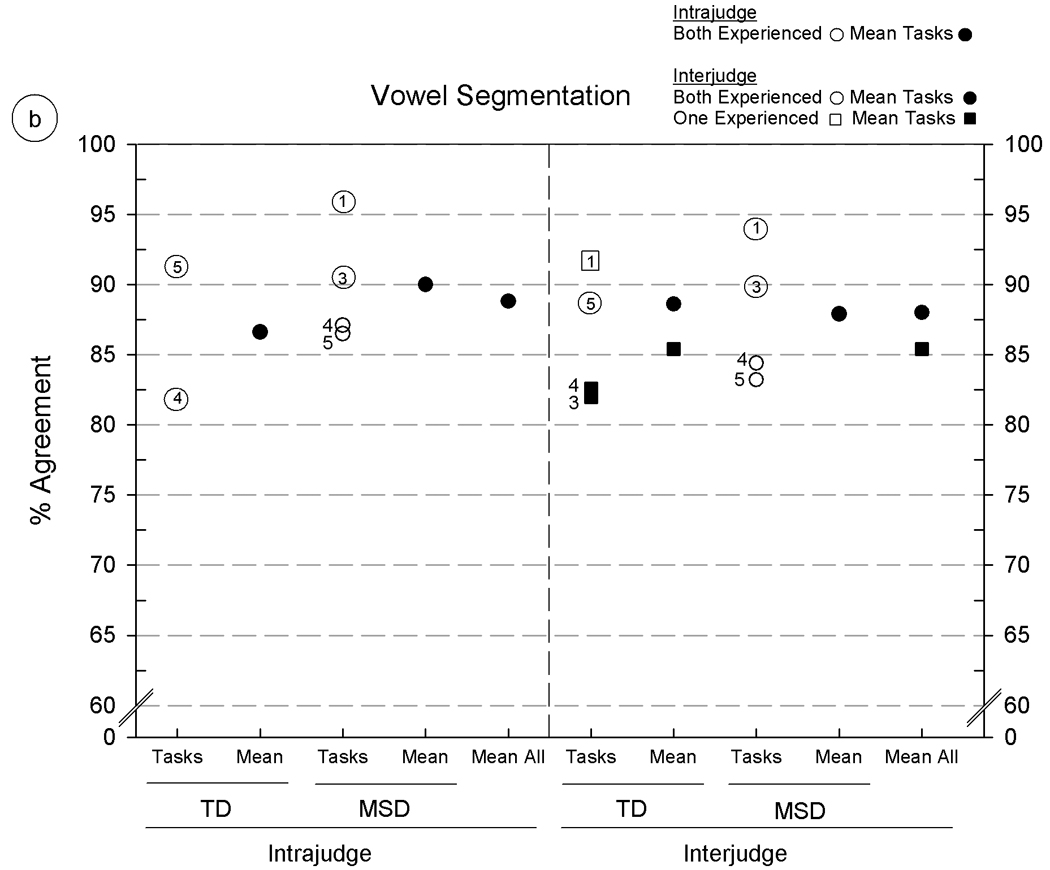
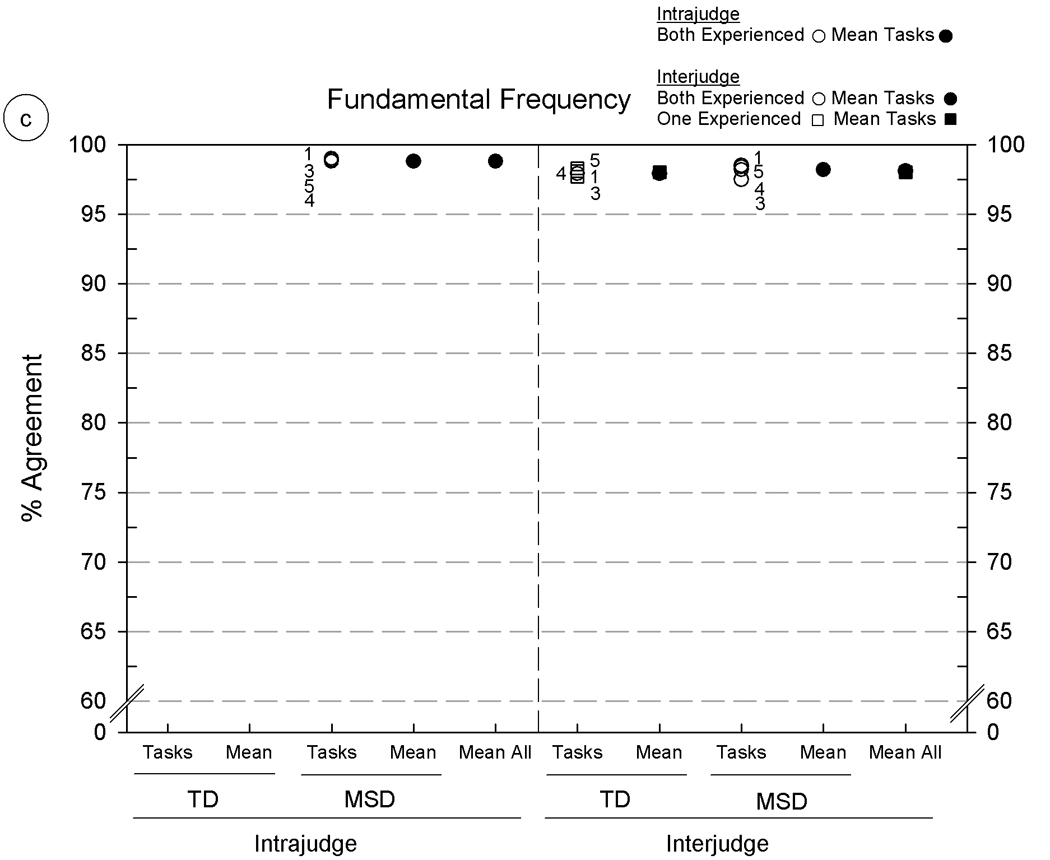
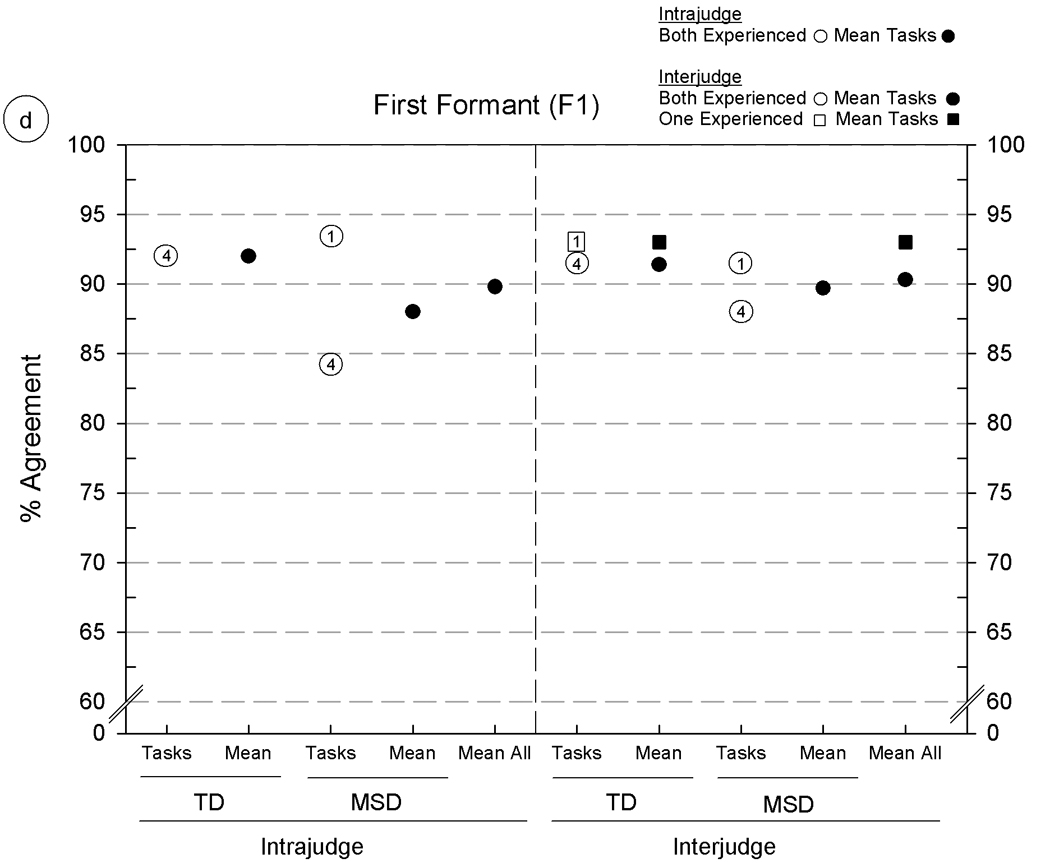
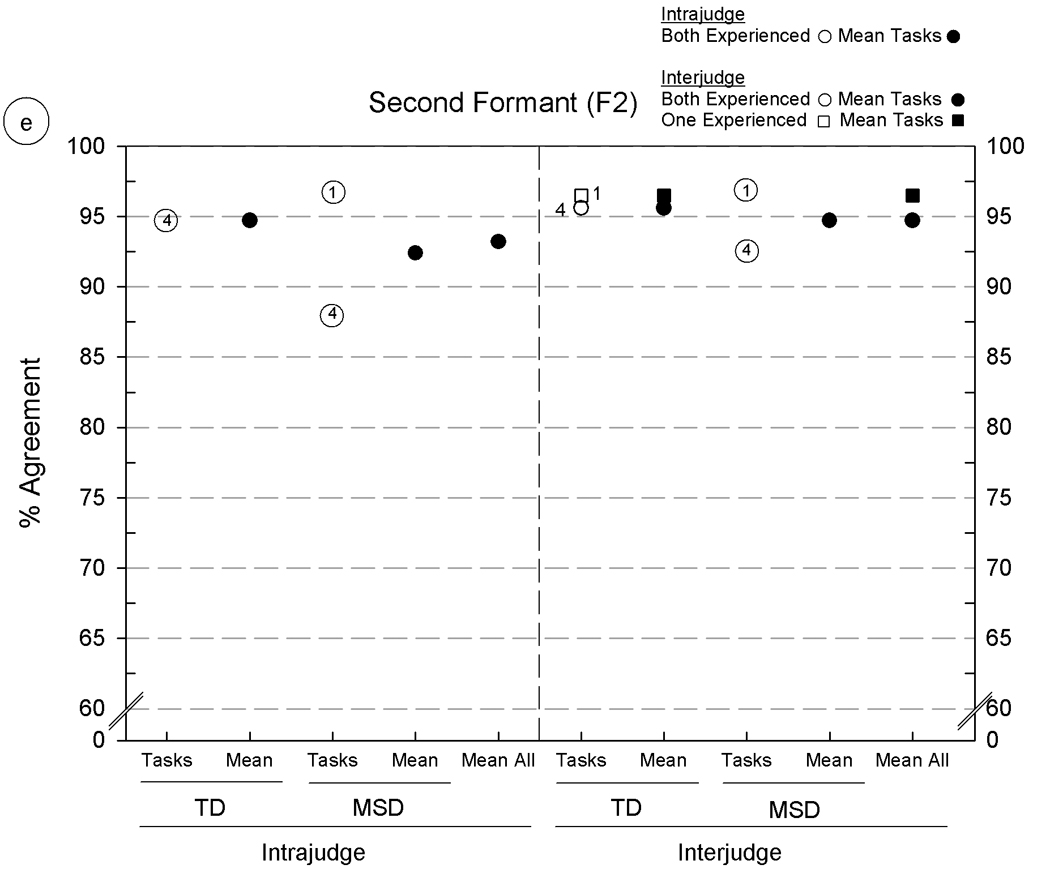
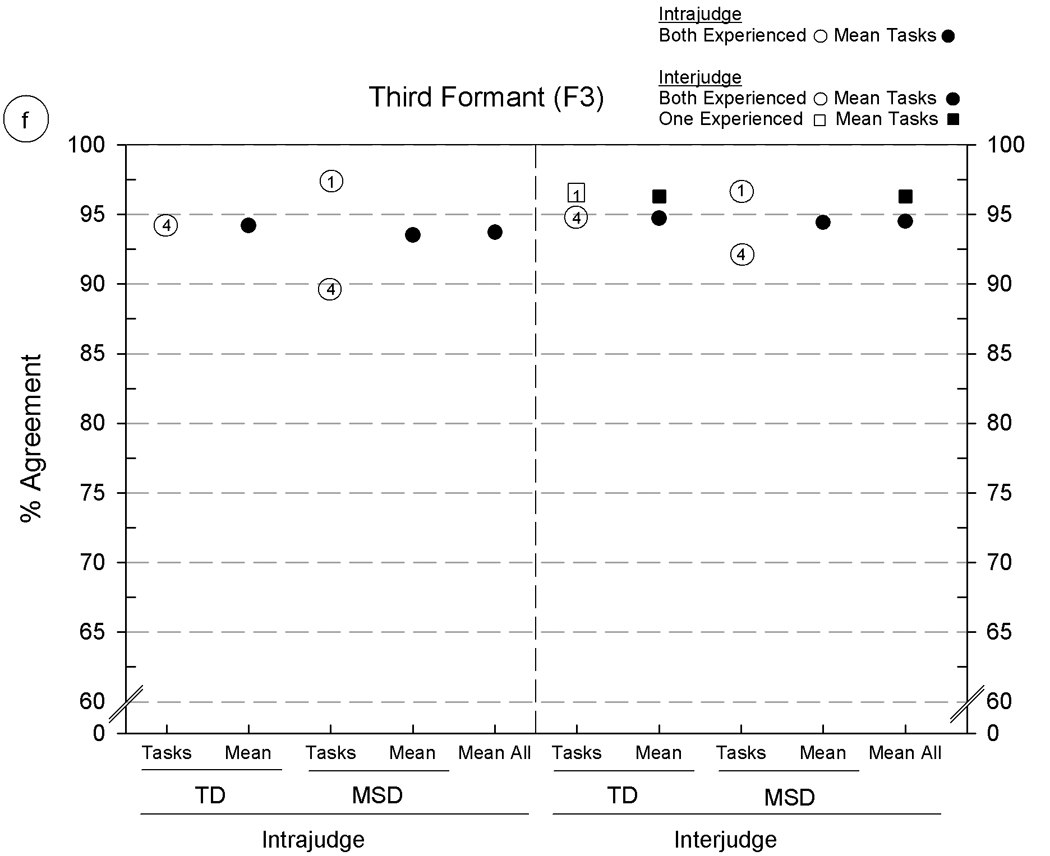
Intrajudge and interjudge reliability estimates for six acoustic parameters using five Madison Speech Assessment Protocol (MSAP) tasks from five speakers with typically developing speech (TD) and five speakers with motor speech disorder (MSD). The six panels include agreement findings for the following acoustic parameters: 5a: consonant segmentation, 5b: vowel segmentation, 5c: fundamental frequency at the temporal mid-point, 5d–5f: formant frequencies for F1, F2, and F3, respectively. See text for description of the six acoustic parameters and the percentage of agreement metric.
Overall findings
As shown across Panel A and Panel B in figure 3, consonant and vowel transcription agreement percentages ranged from a high of 100% (intrajudge agreement on broad transcription of both vowels and consonants in VT1 produced by TD speakers) to a low of 65.6% (interjudge agreement on narrow phonetic transcription of vowels in LST produced by MSD speakers). With the exception of the latter finding, the remaining agreement percentages, ranging from low 70% values to high 90% values, are as high or higher than transcription reliability findings reported in prior reviews of the literature and in our laboratory (McSweeny & Shriberg; 1995, Shriberg & Lof; 1991, Shriberg et al., 2005). Following is a summary of trends in the individual and mean agreement estimates shown in figure 3.
Findings: transcription metric
As shown in the ‘Mean All’ values in figure 3, the lowest reliability estimates in each of the four agreement percentages were those calculated for narrow phonetic transcription, including intrajudge (91.8%) and interjudge (86.7%) percentage agreements for consonants and intrajudge (85.9%) and interjudge (77.6%) percentage agreements for vowels. Averaging over the four comparisons, reliability estimates for narrow transcription were 6.1% lower than estimates based on broad transcription.
For projects using the SDCS that do not report reliability estimates, the present estimates in figure 3 for broad and narrow transcription by experienced transcribers could be used to indicate the constraints on SDCS findings associated with transcription. For example, in a prior report on the Percentage of Consonants Correct (PCC) measure, we estimated that the standard error of measurement for a PCC score from a conversational speech sample from a preschool child with speech delay (i.e. narrow phonetic transcription, interjudge agreement, consonants) was approximately four percentage points (Shriberg, Austin, Lewis, McSweeny, & Wilson, 1997). For the present estimates of transcription reliability we have not included standard errors of measurement. As in other contemporary, evidenced-based forms of high stakes testing, diagnostic classification of speech disorders using the finalised SDCS will require attention to these and other psychometric needs.
Findings: agreement type
Figure 3 includes eight means for each of the two types of transcription metrics that allow comparisons between intrajudge and interjudge agreement. For the purposes of these estimates, directional differences between original and retranscription within and between transcribers were ignored. Such information is, of course, central in determining if there is any directional bias in retranscription, especially over a lengthy period of time as might be reported for longitudinal data including treatment studies. For interjudge reliability, a directional difference could indicate differences associated with the training of transcribers or their application of conventions such as the many described in a current laboratory manual for SDCS methods. As indicated previously, both transcribers in the present intrajudge and interjudge reliability estimates had considerable years of training, and therefore the present emphasis was on the magnitudes of agreement, rather than on differences between individual transcribers.
Averaging over the eight narrow transcription findings shown above for each estimate, the mean intrajudge agreement was 88.9% and the mean interjudge agreement was 82.1%, or approximately 7% lower. As above, such estimates from well-trained transcribers may represent the limits of intrajudge and interjudge agreement using auditory-perceptual information and SDCS procedural conventions. Interjudge transcriber agreement markedly lower than the 7% difference from intrajudge agreement obtained in the present reliability estimate (i.e. > 7%) could suggest the need for consensus reliability support from an additional transcriber before using SDCS findings for typological and etiological classification as described in Shriberg, Fourakis, et al. (2010). Also, as discussed above relative to the standard error of measurement, the approximately 11% difference in retranscription by the same transcriber (i.e. 100%-88.9%) suggests that caution should be exercised in contexts in which marginal differences in speech competence are used for clinical decision making.
Findings: speaker competence
As indicated in figure 3, reliability estimates differed considerably by the speech competence of the participants (TD compared to MSD) and by the perceptual challenges associated with each of the five speech tasks on which estimates were based. The narrow phonetic transcription reliability estimate for the five TD speakers averaged over the four intrajudge and interjudge agreement comparisons was 90.7%, compared to 80.3% for the five MSD speakers calculated in the same way. This substantial difference reflects the central role of a speaker’s frequency and type of articulation errors on estimates of the reliability of phonetic transcription. For the present purpose, speakers with MSD were selected to evoke such differences, because unlike the TD speakers, MSD speakers had an especially large number of vowel and consonant distortions. Such findings underscore likely pronounced differences in transcription reliability associated with the typological and etiological classifications of SSD described in Shriberg, Fourakis, et al (2010).
Findings: speech task
A final observation on the narrow phonetic transcription reliability estimates in figure 3 is to highlight the many considerable differences associated with speech tasks. Recall that agreement percentages for comparisons in figure 3 were averaged to determine the rank order (1–5) of the five MSAP tasks from least to most challenging for transcription. Notice that this pattern of decreasing agreement percentages across the five types of speech tasks is generally observable for all comparisons in figure 3, but with marked differences in several comparisons. As noted previously, across-task differences were greatest for the MSD participants, most often for comparisons of Vowel Task 1 (VT1) with GFTA-2. Tasks that included the highest number of sounds on which speakers had an array of distortions were associated with lower narrow phonetic transcription agreement. Notice that the Challenging Words Task (CWT), which contains a high proportion of sibilant fricatives and liquids, generally was associated with lower narrow phonetic transcription agreement than the consonant agreement percentages from conversational speech samples.
Conclusions
It is useful to view these transcription reliability findings from the perspective of what the information from each speech task provides for typologic and etiologic classification. A general observation is that wherever possible, SDCS classifications should be derived from findings from speech tasks associated with the highest transcriber reliability, provided their validity is at least comparable to validity estimates from other samples. For example, Vowel Task 1 (VT1) appears to be associated with high reliability for vowels, likely because the duration of the vowels in one-syllable citation forms provides a highly salient signal for transcription, compared for example, to the salience of the same vowels that are considerably shorter in duration and have a smaller vowel space in conversational speech. With all their complexities, however, conversational speech samples have been highly valued both for reflecting the confluence of cognitive, language, and phonological competence and for their social validity in indexing handicap. Standardised speech assessment protocols must evaluate such validity-reliability tradeoffs when faced with limited time and resources (Morrison & Shriberg, 1992).
Reliability estimates for Prosody-Voice Screening Profile codes
As described previously, the goal of the perceptually-based Prosody-Voice Screening Profile (PVSP), developed before the contemporary availability of acoustics software, was to provide a screening tool for research in childhood speech sound disorders. Although PVSP validity studies have indicated that the three Prosody domains (Phrasing, Rate, Stress) and four Voice domains (Loudness, Pitch, Laryngeal Quality, Resonance) meet validity and reliability criteria for screening, agreement data at the lower level of the prosody-voice codes has consistently been too low for research and clinical decision making based solely on PVSP findings (McSweeny & Shriberg, 1995; Shriberg, Kwiatkowski & Rasmussen, 1990; Shriberg, Kwiatkowski, Rasmussen, Lof, & Miller, 1992). Essentially, experienced prosody-voice coders in prior studies have been shown to have excellent (90–100%) to adequate (80–89%) reliability in classifying behaviours in the seven domains as ‘Appropriate’ (PV Code 1) versus ‘Inappropriate’, but agreement on many of the remaining 31 PV codes for inappropriate prosody-voice (particularly the codes for voice quality and resonance) has typically been well below 80%. This finding for the lower-level PVSP codes is comparable to point-to-point agreement findings at the level of individual diacritics in narrow phonetic transcription. A long-term goal since initial development of the PVSP has been to identify acoustic correlates for each possible PVSP code using acoustic software. As described in Shriberg, Fourakis, et al. (2010) an analysis framework termed the Competence, Precision, and Stability Analytics (CPSA) currently includes acoustic measures to index performance for many speech, prosody, and voice domains. Perceptual data reduction is used primarily for the Competence indices, and acoustic data reduction is used for most Precision and Stability indices/markers. Table 2 includes information on the number and types of comparisons used to estimate PVSP reliability cross-tabulated by relevant independent variables.
Findings: PVSP metric
The primary variable associated with the magnitude of PVSP agreement percentages is the degree of resolution captured by the measurement metric. The reliability estimates in figure 4a (three prosody domains) and figure 4b (four voice domains), indicate the large difference in estimates based on whether agreement on utterances considered appropriate are included in the calculation. The eight means of the agreement percentages for the utterances coded ‘with appropriate’ by at least one coder range from 89.3% to 96.1%, averaging 93.5% across the seven prosody-voice domains. In comparison, means of the agreement percentages for the utterances coded ‘without appropriate’ (i.e. not including ‘appropriate’) by both coders range from 16.3% to 78.3%, averaging 52.8% across the 31 PVSP screening subcodes (including agreement on subcodes as low as 0%). Many of these latter percentages reflect the low occurrence of inappropriate codes in the corpus. For example, if only one of two coders perceives a speaker to have a tremor (PV Code 26: Break/Shift/Tremulous) in one utterance, agreement will be 0%. Such findings parallel those reported for narrow transcription of low frequency of occurrence diacritics (Shriberg & Lof, 1991). We address this constraint in the following section on reliability of acoustics methods.
Findings: agreement type
To address whether intrajudge agreement is higher than interjudge agreement, as is generally found in reliability data, it is useful for reasons just reviewed to restrict calculations to only those using the PVSP Subcodes with Appropriate metric. Averaging the agreement comparisons over the eight data sets using this less stringent criterion yields an average of 93.8% for intrajudge agreement and 93.2% for interjudge agreement. These essentially similar findings are clearly associated with the limited range of the data points, with all eight values above 89%. For these very experienced coders, there was excellent intrajudge and interjudge agreement for the pass-fail prosody-voice screening data used primarily in the SDCS Competence indices.
Findings: speaker competence
Frequency of occurrence of inappropriate prosody and voice underlies, in part, the differences associated with speaker types shown in figure 4. Although agreement percentages were lower for the PVSP Subcodes without Appropriate metric than for the PVSP Subcodes with Appropriate metric, differences between the two percentages of agreement metrics were smaller for MSD compared to TD speakers. Averaged over the seven PVSP domains, the difference between the two coding metrics averaged 55.4% for the TD speakers and 25.9% for the MSD speakers. This interaction between the type of agreement metric and the frequency of inappropriate behaviours in a corpus, which may appear counter-intuitive, is often missed in reliability estimates that do not examine findings at the level of speaker type.
Findings: prosody-voice domain
A final set of findings addresses potential differences across the seven prosody-voice domains percentages using the screening level metric of PVSP Subcodes with Appropriate. As reported previously, all values ranged from 82.2% to 100%, indicating no substantial differences in the absolute magnitudes of reliability estimates across domains. In addition to their extensive years of experience, each prosody-voice coder continued to interact with each other in the laboratory setting to maintain calibration. We have discussed the concept of ‘calibration drift’ in studies cited previously, a problem with all perceptual evaluation systems as judges develop unique ways to handle challenging perceptual judgments. To guard against calibration drift in data reduction, frequent reliability estimates, followed by discussion is mandatory. Such information is useful when considering the costs and benefits of phonetic transcription by consensus (e.g. Shriberg, Hinke, & Trost-Steffen, 1987), which may maximize the validity and reliability of classification decisions, but not be feasible in time or costs for on-going clinical services or research.
There were large differences in the levels of coder agreement when estimated using the more stringent metric that included only PVSP inappropriate subcodes. As all were unacceptably low for descriptive-explanatory purposes, it is not useful to compare and contrast their relative magnitudes. As above, the low occurrence of most of the 31 codes in the present sample of 10 speakers, in contrast to the hundreds of data point comparisons used to estimate the reliability of transcription and acoustics procedures (table 2) renders the data in figure 4 only advisory. For the original screening purpose for which the PVSP was developed, the magnitudes of the reliability estimates indexing appropriate versus inappropriate prosody are interpreted as adequate for indices at this diagnostic level of sensitivity and specificity.
Acoustic analysis reliability estimates
Estimates of the intrajudge and interjudge reliability of acoustic analyses were obtained from the group of analysts described previously, including the two experienced analysts with 14 and five years of research experience and two analysts with a few months to approximately one year of experience. In addition to the goal of estimating the overall reliability of the acoustic data and comparison to data from the two perceptual methods, these estimates also provided information on associations within and between experienced and less experienced analysts.
As shown in figure 5, the acoustic analyses procedures of interest were: figure 5a and figure 5b: analyst agreement in segmenting consonants and vowels, respectively (segment duration in: milliseconds); figure 5c: editing pitch tracks (fundamental frequency in Hertz characterised at the temporal midpoint), and, figure 5d, 5e, and 5f: F1, F2, and F3 formant frequencies in kiloHertz. Estimates of the reliability of each of these six acoustic parameters were obtained from the same samples of speech as used in the reliability studies just reviewed for phonetic transcription and prosody-voice coding.
To make the agreement percentages for each pairwise comparison comparable in direction to those obtained for transcription and prosody-voice coding, the following six-step procedure was completed for each reliability estimate: (1) obtain the mean of the original measured values, (2) obtain the mean absolute value of the difference between the original and remeasured values (i.e. disregarding the algebraic sign of any differences), (3) multiply the standard deviation of the absolute value difference by 3, (4) remove all outliers greater than 3 standard deviations from the mean, (5) obtain a revised mean based on the remaining values, (6) divide the revised mean by the mean of the original data and multiply by 100 (to convert to percentage), and (7) subtract the resulting percentage from 100 (to index percentage of agreement). Step 4 follows a standard convention with continuous data, and is especially appropriate for small data sets. As shown in Table 2, for the hundreds of pairwise comparisons estimating the reliability of the acoustic data on the six acoustic parameters, outliers ranged from 0% to 9.4% of the original measurements.
All intrajudge and many of the interjudge reliability estimates in figure 5 were obtained from the two experienced acoustic analysts (circles); additional interjudge reliability estimates were obtained from pairs of one experienced analyst and one of two minimally-experienced acoustic analysts (squares). The numbered entries in the circles and squares (placed beside some symbols for clarity) indicate the MSAP tasks on which the estimates were obtained, using the same 1–5 numbering system as in figure 4. Means for subsets and overall levels are shown by filled circles and squares.
Overall findings
Percentages of agreement for figure 5 range from 75.6% (figure 5a, interjudge agreement on Continuous Speech Sample [CSS] from the speakers with MSD) to intrajudge and interjudge agreement percentages above 95% for fundamental frequency data obtained from all five MSAP tasks (figure 5c). Although the low end of this range is higher than the low end of the range for vowel transcription and prosody-voice coding, it is lower for some comparisons than the reliability values reported by Hillenbrand and colleagues (1995). These investigators reported 90% or higher measurement–remeasurement findings for vowel durations, fundamental frequencies, and formant frequencies. Although it is customary to remove outliers greater than 3 standard deviations from reports addressing substantive questions, their removal from the present data clearly increased the magnitudes of the remaining estimates, which range from just over 90% to 100% of the obtained agreement percentages. The following sections describe findings aggregated over other potential sources of variance.
Findings: agreement type
Similar to the prosody-voice agreement comparisons for intrajudge versus interjudge reliability, there were relatively small differences in the agreement percentages for intrajudge compared to interjudge agreement on the six acoustic parameters. All estimates ranged from upper-80% values to lower- to upper-90% values for both types of comparisons. Notice that missing from these comparisons are intrajudge comparisons for the two minimally experienced analysts, which could not be obtained because these student assistants had completed their tenure on this research project.
Findings: speaker competence
Unlike the differences in the reliability findings associated with speaker competence in transcription and prosody-voice coding, findings in figure 5 indicate essentially similar agreement in the estimates based on the speakers with TD compared to those with MSD.
Findings: acoustic parameter
As shown by the mean agreement percentages in figure 5 [panels a-f], the primary source of variance in the magnitudes of the intrajudge and interjudge reliability estimates was the acoustic parameter. Segmentation of consonant durations (figure 5a) was the most challenging of the six parameters, with average intrajudge and interjudge values between 80% and 85%. In comparison, agreement estimates on vowel segment duration and each of the other parameters in figure 5 (5b–5f) range from high 80% values to mid-to high 90% values with highest agreement (high 90% values) on correctly adjusting the software’s setting of temporal midpoints of vowels to characterise F0. Segmentation requires knowledge of acoustic phonetics and attention to cues in the waveform displays that signal onsets and offsets of speech sounds. Consonant segments are typically shorter than monophthongs and diphthongs, with the corresponding effect shown in figure 5a of lowering the magnitudes of duration agreement percentages. It should be noted that approximately midway through the original measurements, improvements in the accuracy of the formant measures (F1-F3) were observed when a sheet giving the average F1 – F3 formants for each vowel (Lee, Potamianos, & Narayanan, 1999) by age and gender was affixed to each display screen.
Findings: speech task
There are too few comparable comparisons of speech tasks in figure 5 to estimate quantitative trends. Of the available comparisons, acoustic data from Vowel Task 1 (VT1: Corner Vowels; coded as #1 in figure 5) was associated with the highest agreement percentages, and data from the Conversational Speech Sample (CSS; coded as #4 in figure 5) was associated with the lowest agreement percentages. Vowel durations in conversational speech are shorter than in citation forms (i.e. Vowel Task 1, VT1). As noted previously, this magnifies the effects on analyst agreement of small differences in segmentation onsets and offsets and makes it more difficult to obtain formant values. Moreover, acoustic measures from conversational speech are typically more difficult due to the more rapid rate of speech, stress effects associated with weaker signals, and other transient influences on the acoustic signal. The majority of the outliers removed from each agreement calculation had been based on tokens from the conversational speech samples. Again, agreement findings associated with each of the other three MSAP tasks were too sparse (due to arbitrary limitations on the number of reliability estimates) to examine for trends.
Findings: analyst experience
Interjudge reliability findings in figure 5 indicate that the agreement of one minimally experienced analyst with one experienced analyst was at least as high or higher than agreement of the two experienced analysts with each other. However, more of the outliers removed from the analyses were from the interjudge estimates of agreement in which a minimally experienced analyst remeasured samples from an experienced analyst. Trends in the data indicated this occurred most on the interjudge estimates based on Vowel Task 1 (VT1: #1) and the Challenging Word Task (CWT: #5).
Conclusions
The reliability estimates from this study are interpreted as support for the speech, prosody, and voice data reduction methods that provide classification data used for the extensions to the SDCS described in the companion report (Shriberg, Fourakis, et al. 2010). The magnitudes of the agreement percentages appear to be consistent with those reported in the transcription and acoustics literatures, although there are no comparable studies to which they specifically can be compared due to the inclusion of interdependent perceptual and acoustic information. For example, the present acoustic reliability estimates for vowel formants are based on speech tokens that are correct at a phonemic level as judged perceptually (i.e. although they may be perceived as distorted); tokens described as substitutions for targets are excluded from acoustic analyses.
An important consideration is the primary role of a transcriber’s perceptual decisions on the validity of speech findings completed by an acoustic analyst. In the data reduction procedures described, acoustic analyses are completed only on speech tokens that the transcriber vets as eligible (e.g. was not deleted and meets perceptual criteria for a correct phoneme, a substitution, or a distortion). Our perspective is that transcription and prosody-voice coding (especially from audio alone) is an auditory-perceptual task whereas acoustic analysis is primarily a visual task. We would submit that the SDCS’s data reduction methods—acoustics-aided transcription, followed by transcription-aided acoustic analyses—optimizes both the validity and reliability of explanatory-descriptive information and classification decisions in speech sound disorders. Validation studies in process are assessing the diagnostic accuracy of the SDCS typologic and etiologic procedures, and cross-validation studies with other investigators will assess its value in research and in applied settings.
Acknowledgments
This research was supported by National Institute on Deafness and Other Communication Disorders Grant DC000496 and by a core grant to the Waisman Center from the National Institute of Child Health and Development (Grant HD03352). We thank the following colleagues for their contributions to this study: Chad Allen, Roger Brown, Peter Flipsen, Jr., Katherina Hauner, Jessica Hersh, Joan Kwiatkowski, Sara Misurelli, Rebecca Rutkowski, and Sonja Wilson.
Footnotes
Declaration of interest: The authors report no conflicts of interest. The authors alone are responsible for the content and writing of the paper.
References
- Goldman R, Fristoe M. Goldman–Fristoe Test of Articulation. 2nd ed. Circle Pines, MN: AGS; 2000. [Google Scholar]
- Hillenbrand JM, Getty LA, Clark MJ, Wheeler K. Acoustic characteristics of American vowels. Journal of the Acoustical Society of America. 1995;97:3099–3111. doi: 10.1121/1.411872. [DOI] [PubMed] [Google Scholar]
- Lee S, Potamianos A, Narayanan S. Acoustics of children’s speech: Developmental changes in temporal and spectral parameters. Journal of the Acoustical Society of America. 1999;105:1455–1468. doi: 10.1121/1.426686. [DOI] [PubMed] [Google Scholar]
- McSweeny JL, Shriberg LD. Segmental and suprasegmental transcription reliability. Phonology Project, Waisman Center, University of Wisconsin-Madison; 1995. (Tech. Rep. No. 2) [Google Scholar]
- Morrison JA, Shriberg LD. Articulation testing versus conversational speech sampling. Journal of Speech and Hearing Research. 1992;35:259–273. doi: 10.1044/jshr.3502.259. [DOI] [PubMed] [Google Scholar]
- Shriberg LD, Allen CT, McSweeny JL, Wilson DL. PEPPER: Programs to examine phonetic and phonologic evaluation records [Computer software] Madison, WI: Waisman Center Research Computing Facility, University of Wisconsin–Madison; 2001. [Google Scholar]
- Shriberg LD, Austin D, Lewis BA, McSweeny JL, Wilson DL. The Percentage of Consonants Correct (PCC) metric: Extensions and reliability data. Journal of Speech, Language, and Hearing Research. 1997;40:708–722. doi: 10.1044/jslhr.4004.708. [DOI] [PubMed] [Google Scholar]
- Shriberg LD, Fourakis M, Hall SD, Karlsson HB, Lohmeier HL, McSweeny JL, et al. Extensions to the Speech Disorders Classification System (SDCS) 2010 doi: 10.3109/02699206.2010.503006. Manuscript submitted for publication. [DOI] [PMC free article] [PubMed] [Google Scholar]
- Shriberg LD, Hinke R, Trost-Steffen C. A procedure to select and train persons for narrow phonetic transcription by consensus. Clinical Linguistics and Phonetics. 1987;1:171–189. [Google Scholar]
- Shriberg LD, Kent RD. Clinical phonetics. 3rd ed. Boston: Allyn & Bacon; 2003. [Google Scholar]
- Shriberg LD, Kwiatkowski J, Rasmussen C. The Prosody-Voice Screening Profile. Tucson, AZ: Communication Skill Builders; 1990. [Google Scholar]
- Shriberg LD, Kwiatkowski J, Rasmussen C, Lof GL, Miller JF. The Prosody-Voice Screening Profile (PVSP): Psychometric data and reference information for children. Phonology Project, Waisman Center, University of Wisconsin-Madison; 1992. (Tech. Rep. No. 1) [Google Scholar]
- Shriberg LD, Lof GL. Reliability studies in broad and narrow phonetic transcription. Clinical Linguistics and Phonetics. 1991;5:225–279. [Google Scholar]
- Shriberg LD, McSweeny JL, Anderson BE, Campbell TF, Chial MR, Green JR, et al. Transitioning from analog to digital audio recording in childhood speech sound disorders. Clinical Linguistics and Phonetics. 2005;19:335–359. doi: 10.1080/02699200500085426. [DOI] [PMC free article] [PubMed] [Google Scholar]
- Shriberg LD, Potter NL, Strand EA. Prevalence and phenotype of Childhood Apraxia of Speech in youth with galactosemia. 2010 doi: 10.1044/1092-4388(2010/10-0068). Manuscript submitted for publication. [DOI] [PMC free article] [PubMed] [Google Scholar]