

Abstract
Aberrant anaplastic lymphoma kinase (ALK) expression is a defining feature of many human cancers and was identified first in anaplastic large-cell lymphoma (ALCL), an aggressive non-Hodgkin T-cell lymphoma. Since that time, many studies have set out to identify the mechanisms used by aberrant ALK toward tumorigenesis. We have identified a distinct profile of micro-RNAs (miRNAs) that characterize ALCL; furthermore, this profile distinguishes ALK+ from ALK− subtypes, and thus points toward potential mechanisms of tumorigenesis induced by aberrant ALK. Using a nucleophosmin-ALK transgenic mouse model as well as human primary ALCL tumor tissues and human ALCL-derived cell lines, we reveal a set of overlapping deregulated miRNAs that might be implicated in the development and progression of ALCL. Importantly, ALK+ and ALK− ALCL could be distinguished by a distinct profile of “oncomirs”: Five members of the miR-17–92 cluster were expressed more highly in ALK+ ALCL, whereas miR-155 was expressed more than 10-fold higher in ALK− ALCL. Moreover, miR-101 was down-regulated in all ALCL model systems, but its forced expression attenuated cell proliferation only in ALK+ and not in ALK− cell lines, perhaps suggesting different modes of ALK-dependent regulation of its target proteins. Furthermore, inhibition of mTOR, which is targeted by miR-101, led to reduced tumor growth in engrafted ALCL mouse models. In addition to future therapeutical and diagnostic applications, it will be of interest to study the physiological implications and prognostic value of the identified miRNA profiles.
Keywords: micro-RNA, mTOR, miR-155, miR-101
Anaplastic large-cell lymphoma (ALCL) is a mature T-cell malignancy that is subdivided further into two distinct disease entities based on whether the anaplastic lymphoma kinase (ALK) gene is rearranged as the consequence of a translocation event. ALK+ ALCL bears the t(2;5) (p23;q35) translocation in greater than 80% of cases, which results in the expression of the chimeric nucleophosmin (NPM)-ALK (1–4). The consequence of the fusion is constitutive ALK expression, which leads to the activation of many different growth-promoting and antiapoptotic pathways, including PI3K/Akt1/mTOR (5–8), Jak/Stat (9–11), cJun, JunB (12–14), and c-myc (12, 15). The transforming capacity of the NPM-ALK fusion was shown for the first time in murine chimeras in which lethally irradiated recipients were rescued with NPM-ALK–transduced bone marrow (4, 16, 17) as well as in several transgenic mouse models that expressed the NPM-ALK fusion protein in hematopoietic cells (14, 18, 19). Specifically, NPM-ALK transgenic mice in which gene expression is directed by the T-cell–specific CD4 promoter develop aggressive T-cell lymphomas with a median survival of 18 wk (18).
Since NPM-ALK was cloned by Morris and his colleagues in 1994, deregulated ALK has become a defining feature of a number of other malignancies, including variants of lung and breast cancer as well as neuroblastoma (20–22). Conversely, there are no recurrent cytogenetic abnormalities by which to define ALK− ALCL at present; furthermore, there is no definitive evidence to dictate whether ALK− ALCL is more closely related to ALK+ ALCL or peripheral T-cell lymphoma not specified otherwise.
Recently, micro-RNAs (miRNAs) have emerged as tiny but potent molecules to regulate cell differentiation and proliferation. They are noncoding RNAs (18–22 nt) that regulate the expression of their target proteins through binding at the 3′-UTR regions by translational inhibition (23, 24). Deregulated miRNAs have been observed in many cancers, and both tumor suppressor (e.g., miR-26a, miR-34a) (25, 26) and oncogenic functions (e.g., miR-21, miR-17–92 cluster, miR-155) (27–29) have been attributed to them.
To elucidate the potential role of miRNAs in the pathogenesis of ALK+ ALCL, we have used a number of model systems to highlight a unique miRNA signature associated with this disease. Furthermore, we have identified miRNAs that may act as molecular classifiers to distinguish ALK+ and ALK− ALCL. Finally, we demonstrate the role of miR-101 in the regulation of the mTOR pathway in ALCL and provide evidence that this pathway may be a therapeutical target.
Results
Determination of a Distinct Profile of Deregulated miRNAs in ALK+ ALCL.
To determine a distinct profile of deregulated miRNAs in ALK-driven ALCL, we purified RNA from three cell lines, SUDHL-1, Karpas-299, and SR-786, as well as from a pool of CD3+ T cells isolated from five healthy people, henceforth referred to as the T-cell pool. A differential miRNA array based on locked nucleic acid (LNA) technology containing 636 human and 425 murine miRNA probes was used to test each of these cell lines against the T-cell pool. A large set of 41 miRNAs was found to be deregulated >2-fold in all three cell lines (Fig. 1A). From these, 29 were down-regulated and 12 were up-regulated (Table S1). Interestingly, 6 of 12 up-regulated miRNAs belong to the oncogenic myc-regulated miR-17–92 cluster located on chromosome 13q31.3 (miR-17-1, miR-18a, and miR-20a) or its paralogue on chromosome Xq26.2 (miR-363, miR-106a, and miR-20b) (29) (Table S1). Among the down-regulated miRNAs are negative regulators of proteins implicated in ALK-driven oncogenesis, including the Bcl2-like protein Mcl1 (miR-29b and miR-101) and mTOR (miR-101). To corroborate the miRNA array data, we performed quantitative PCR (qPCR) for miR-18a, miR-20b, miR-26a, and miR-29c in all three cell lines in comparison to the T-cell pool. Up-regulation of miR-18a and miR-20b and down-regulation of miR-26a and miR-29c were confirmed (Fig. S1).
Fig. 1.
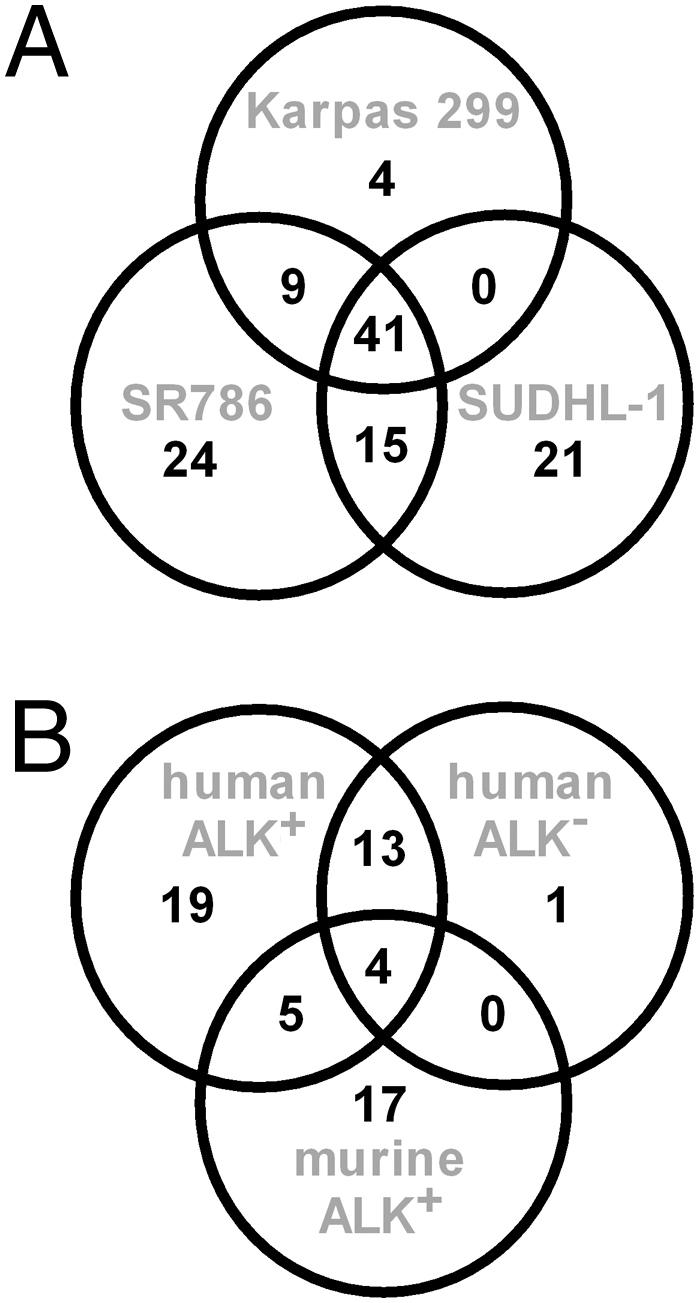
Common deregulated miRNA in ALK+ ALCL cell lines (A) and ALK+ and ALK− cell lines and a murine ALCL model (B). (A) Analysis of differentially expressed miRNAs identified in three human ALK+ ALCL cell lines (SR-786, Karpas-299, and SUDHL-1) reveals a common profile of 41 deregulated miRNAs. (B) ALK− human ALCL cell lines Mac2a and FE-PD share a common set of 18 deregulated miRNAs shown here in comparison to the common ALK+ miRNA profile as well as the murine ALCL model.
Deregulation of miRNAs in Tumors Isolated from NPM-ALK Transgenic Mice.
To distinguish deregulated miRNAs that might be considered the consequence of driver rather than passenger mutations, we set out to compare the miRNA expression profile of human ALCL-derived cell lines with that from murine lymphomas isolated from NPM-ALK transgenic mice (18). These mice express NPM-ALK under the control of the CD4 enhancer and promoter and develop T-cell lymphomas with a median survival of 18 wk after birth (18). We compared the miRNA profile of murine NPM-ALK–expressing lymphomas with that of spleen isolated from healthy littermate controls. A set of 26 miRNAs was deregulated more than 2-fold, with 8 miRNAs up-regulated and 18 down-regulated. Nine of these deregulated murine miRNAs (>34%) overlapped with those observed in the human ALCL-derived cell lines (Fig. 1B and Table S1). In order of magnitude of differential expression, these were miR-146a, miR-29c, miR-29b, miR-29a, miR-22, miR-101, miR-150, miR-125b (all down-regulated), and miR-20b (up-regulated) (Table S1, overlapping miRNAs indicated in bold type). Thus, we have identified a common set of miRNAs deregulated both in human cell lines and in the murine model, suggesting that these miRNAs may play important roles in the pathogenesis of ALK+ ALCL.
Determination of a Distinct Profile of Deregulated miRNAs in ALK− ALCL.
In the most recent World Health Organization classification system, ALK+ and ALK− ALCL are classified as two distinct disease entities with disparate properties, the most obvious of which is the differential prognosis that is worse for ALK− ALCL (30). We understand very little about the genetic factors that contribute to ALK− in comparison to ALK+ ALCL. Hence, we compared the miRNA expression profile of ALK+ (SR-786, SUDHL-1, and Karpas-299) and ALK− (FE-PD and Mac2a) ALCL cell lines. We found 42 deregulated miRNAs in the Mac2a cell line and 47 in the FE-PD cell line. Of these, 18 miRNAs were differentially expressed in both (Fig. 2A and Table S2). Interestingly, 17 of 18 of the common ALK− cell line miRNAs were also members of the ALK+ cell line set, and 4 miRNAs were common to the mouse tumors and ALK+ and ALK− cell lines (miR-29a, miR-29c, miR-101, and miR-150; Fig. 1B). The concordance (>94%) between the miRNAs in ALK− and ALK+ ALCL suggests some similarities between the two disease entities. However, despite the striking overlap, we aimed at identifying miRNAs that are differentially expressed depending on the ALK status in the ALK+ (Karpas 299, SUDHL-1, and SR786) and ALK− (Mac2a and FE-PD) cell lines. Indeed, we identified 6 miRNAs (miR-17, miR-20a, miR-20b, miR-93, miR-106a, and miR-886-3p) whose expression levels were consistently higher in the ALK+ cell lines as compared with the ALK− cell lines (Fig. 2B). The miRNA deregulated most in this select set of miRNAs (and of all those in the ALK+ cell lines) is miR-886-3p. It is up-regulated >15-fold in all ALK+ cell lines, whereas it is not deregulated in the ALK− cells. Interestingly, the remaining 5 differential miRNAs (miR-17, miR-20b, miR-20a, miR-93, and miR-106a) are members of the myc-regulated miR-17–92 cluster on chromosome 13 or its paralogues on chromosomes X (miR-106a-363) and 7 (miR-106b-25) (29), and all except miR-93 demonstrate >80% sequence identity with an identical 8-mer seed region (Fig. 2C). This suggests synergistic regulation of common target proteins and is in agreement with previously published findings demonstrating by immunohistochemistry that myc is only expressed in ALK+ ALCL and is absent from ALK− samples (15).
Fig. 2.

Role of ALK status in miRNA expression of ALCL. (A) Venn diagram of differentially regulated miRNAs in two human ALK− ALCL cell lines (Mac2a and FE-PD). (B) In a k-means–based clustering using the miRNA array data, we identified six miRNAs that were differentially expressed in ALCL cell lines depending on their ALK status. (C) Sequence alignment of the five miRNAs that are members of the miR17–92 cluster. (D) Using qPCR, we tested the expression (exp.) of miR-886-3p, miR-20b, miR-106a, miR-17, miR-20a, and miR-155 in RNA extracted from primary tissue sections of 14 patients with ALCL (9 ALK+ and 5 ALK−). As reference tissue, we used RNA extracted from paraffin tissue specimens of nonpathological lymph nodes. Three replicate qPCR assays were performed for each tested tumor specimen (mean value ± SD).
Deregulation of miRNAs in Primary Human Tumors.
To confirm that the data obtained from human ALCL cell lines is relevant to primary patient cases, we examined the profile of deregulated miRNAs in 13 formalin-fixed paraffin-embedded (FFPE) patient biopsy specimens. Down-regulated miRNAs (>2-fold in at least 80% of primary samples) included miR-26a, miR-29a, miR-29b, miR-29c, miR-30a, miR-101, miR-142-3p, miR-142-5p, miR-145, miR-146a, miR-150, miR-342-3p, and miR-451. Of these 13 miRNAs, 11 were likewise deregulated in the ALK+ cell lines. The remaining 2 miRNAs were found to be deregulated in the murine ALK+ ALCL model. An overview comparing the different model systems including the ALK− FFPE specimens is given in Table S3.
However, the array screen did not detect differential deregulation of the six ALK-specific miRNAs identified in the cell lines. We therefore performed qPCR for these six miRNAs on RNA isolated from FFPE tissue specimens isolated from nine patients diagnosed with ALK+ ALCL and five patients diagnosed with ALK− ALCL (Fig. 2D) and compared the result with that of pooled RNA from five nonpathological lymph nodes. The most highly up-regulated miRNA in the human ALK+ ALCL cell lines was miR-886-3p. Accordingly, this miRNA was overexpressed in primary ALCL tissues (3- to 13-fold) compared with the lymph node pool. Furthermore, miR-886-3p was expressed at a level of 6.4 ± 3.5 in comparison to 2.9 ± 2.6 in ALK+ and ALK− patient samples, respectively (P = 0.04). miR-20b was overexpressed >6-fold in the ALK+ specimens, whereas it was not overexpressed in the ALK− samples. An approximately 2-fold significant up-regulation of miR-106a, miR-17, and miR-20a was observed in the ALK+ cohort compared with the ALK− cohort (Fig. 2D). However, differential expression of miR-93 was not significant. In the murine ALCL system, miR-155 was down-regulated; however, the human homologue of this miRNA was not represented on our miRNA array. We therefore performed qPCR of the primary human tumor specimens, which revealed a 13-fold higher expression of miR-155 in ALK− tissues as compared with ALK+ (P = 0.007) (Fig. 2D).
Hence, we have not only identified a miRNA signature typical for ALCL but miRNAs that are differentially expressed between ALK+ and ALK− ALCL entities. Whether those deregulated in ALK+ ALCL are a direct consequence of aberrant ALK expression remains to be shown.
Expression of miRNA-101 in Primary ALCL Samples.
A miRNA that was commonly down-regulated in both ALK+ (>16-fold) and ALK− (>10-fold) ALCL cell lines as well as in the murine ALCL model (>4-fold) was miR-101, which directly targets the mTOR protein (31). Hyperactivation of mTOR has previously been described in ALK+ ALCL (7). We therefore studied the expression of miR-101 in nine primary cases of ALK+ ALCL by qPCR in comparison to lymph node tissue isolated from healthy individuals. As expected, down-regulation in the range of 2- to 20-fold was observed in all patient samples (Fig. 3), suggesting that a lack of miR-101 may play a role in the initiation and/or maintenance of mTOR pathway activation in ALCL.
Fig. 3.

Expression of miR-101 in primary ALK+ ALCL tissue. Using qPCR, we tested the expression of miR-101 in tumors isolated from nine different patients. As reference tissue, we used paraffin tissue specimens of nonpathological lymph node tissue and purified T cells from healthy donors. Compared with the lymph node, control miR-101 was down-regulated in primary ALCL tissue from 2- to 20-fold. Three replicate qPCR assays were performed for each tested tumor specimen (mean value ± SD).
miR-101 Attenuates the Proliferation of ALCL Cell Lines.
To establish the role of the deregulated miRNAs in the pathogenesis of ALCL, we sought to examine the effects of miRNA restoration on tumor cell growth. We chose initially to examine the effects of restoration of miR-101, miR-29a, miR-26a, and let-7e. The latter was not deregulated in our ALCL model systems, and was therefore used as a control. Overexpression of miR-101 in both ALK+ ALCL cell lines (SR-786 and Karpas-299) using synthetic oligonucleotides that mimic the mature miRNA molecule (miRNA mimics) led to a 50% decrease (P < 0.01) in cell number at 120 h as compared with cells expressing a nontargeting control oligonucleotide (Fig. 4A). The three other miRNA mimics had no influence on cell proliferation. However, when we tested the effect of miR-101 overexpression in the ALK− cell lines Mac2a and FE-PD, no significant reduction in cell number was seen (Fig. 4A). These data suggest that NPM-ALK–driven cell proliferation is at least partially dependent on miR-101 target protein(s). However, this remains to be formally tested with the use of ALK inhibitors. To determine whether the observed effects on cell growth were attributable to cell cycle arrest and/or apoptosis, we stained cells with propidium iodide and annexin-V/7-aminoactinomycin D (7-AAD) and analyzed fluorescence by flow cytometry. A modest yet significant increase in apoptosis and G1 arrest was observed in miR-101 as compared with nontargeting control (NTC) transfected Karpas-299 and SR-786 but not in the ALK− ALCL cell lines (Fig. S2).
Fig. 4.

miR-101 reintroduction and rapamycin analogue CCI-779 reduce proliferation in ALCL cell lines. Two ALK+ (SR-786 and K299) and two ALK− (Mac2a and FE-PD) cell lines were transfected with miRNA mimics of miR-101 and a nontargeting control oligonucleotide (A) or supplemented with 1, 5, and 10 nM CCI-779 (B) (●, SR-786; ▲, Karpas-299; ○, Mac2a; △, FE-PD). Cells were counted after the times indicated. Three independent experiments were performed.
CCI-779 Reduces ALCL Tumor Growth in Murine Models.
The rapamycin analogue CCI-779 inhibits mTOR; as such, it would be predicted to counteract the effects of miR-101 down-regulation in ALCL. We observed an antiproliferative effect of CCI-779 on both ALK+ and ALK− cell lines; however, the impact on the ALK+ ALCL cell lines was significantly stronger (P < 0.01; Fig. 4B), suggesting a higher dependence on an active mTOR pathway in ALK+ cell lines. This may explain, at least in part, the absent effect of miR-101 transfection of ALK− cell lines. Because miR-101 has been shown to bind directly to the 3′-UTR of mTOR (31), we next examined the phosphorylation status of the mTOR downstream target 4EBP1 following miR-101 reintroduction in ALK+ as well as ALK− cell lines. Phosphorylation of the mTOR target was reduced by miR-101 in the SR-786 and Mac2a cell lines. In the Karpas-299 and FE-PD cell lines, this effect was less clear (Fig. S3). Moreover, we assessed the effect of CCI-779 treatment in a murine ALCL xenograft model. SCID mice were engrafted with the ALK+ murine ALCL cell line CD4-417 (n = 14) or CD4-4 (n = 16); 3 wk later, when tumors were clearly visible, half of each cohort was treated with i.p. administration of CCI-779 (1.5 mg·kg·d) or PBS. After 10 d, mice were killed, tumors were excised, and the weight and size of the tumors were assessed. In the relatively slow-growing CD4-4 tumors, we found a mean reduction of tumor weight following CCI-779 treatment from 4.1 ± 1.6 g to 2.8 ± 0.7 g (P = 0.052), and in the fast-growing CD4-417 tumors, the weight was reduced from 10.4 ± 1.7 g to 5.3 ± 2.3 g (P < 0.001). Assessment of the tumor volume gave comparable results, indicating a robust negative effect of mTOR inhibition on ALK+ ALCL tumor growth (Fig. 5).
Fig. 5.

Treatment of murine NPM-ALK tumor xenografts with the rapamycin analogue CCI-779 leads to reduced tumor growth. The murine tumor cell lines NPMALK_4 and NPMALK_417 were established as tumors in 16 and 14 immunodeficient mice, respectively. Half of the mice were treated with CCI-779 (1.5 mg·kg·d) or PBS as a control, and tumor size was monitored over 10 d. Data represent the tumor size at the end of the treatment period. vol., volume.
Discussion
We set out to determine whether deregulation of miRNAs is a defining feature of ALCL and, furthermore, whether distinct miRNA profiles can distinguish ALK− from ALK+ disease categories. We have analyzed the miRNA expression profile of three ALK+ and two ALK− ALCL cell lines as well as that of tumor tissues isolated from NPM-ALK transgenic mice and could confirm the relevance of our findings in 14 primary ALCL tissue samples. We defined a set of 14 miRNAs that are down-regulated in all ALK+ ALCL tissue specimens. Of these 14, 11 are also deregulated in all three ALK+ ALCL cell lines, suggesting a common ALK+ ALCL signature (Table S3). In addition, we could show that miR-155 is more than 10-fold overexpressed in ALK− ALCL as compared with ALK+ ALCL and, conversely, that three members of the miR-17–92 cluster are significantly overexpressed in ALK+ ALCL, together constituting a four-miRNA classifier. Previous studies have attempted to distinguish ALK+ and ALK− ALCL at the genetic level, with limited success. One study describes gains in the chromosomal regions 1q and 6p21 as characteristic of ALK− ALCL and gains in 17q24-qter and 17p as characteristic of ALK+ ALCL (32). Furthermore, several groups have demonstrated that unsupervised clustering of gene expression profiles is not able to separate ALK+ from ALK− ALCL (33–35). However, using supervised analysis, genes were identified that are differentially expressed, many of which are regulated by STAT3 (33–35). In the study by Piva et al. (35), a five-gene classifier (IL1RAP, GAS1, PRF1, IL2RA, and TMEM158) with a specificity and selectivity of more than 95% separates ALK+ from ALK− ALCL. However, the genes within this signature are not exclusively expressed in either of the two disease entities, and besides the ALK gene, only IL1RAP reaches statistical significance when mRNA expression levels of ALK+ and ALK− cases are compared. Hence, our data demonstrate that miRNA profiles may provide further genetic markers to distinguish these disease subsets at the genetic level and may provide insight into the processes driving tumorigenesis, particularly in the case of ALK− ALCL. miR-155 is overexpressed in many B-cell lymphomas, has been described to be essential for immune function, and is strongly induced in activated T and B cells (27, 36). Thus, high miR-155 expression may link ALK− ALCL to a deregulated immune response and/or may reflect the presumed activated T-cell origin of ALCL. Likewise, expression of the miR-17–92 cluster in ALK+ ALCL may reflect the pathogenesis of this disease; miR-17–92 has been associated with inhibition of apoptosis, promotion of proliferation, and induction of tumor angiogenesis through repression of its target proteins, including E2F1, and the tumor suppressors PTEN and p21 (28, 37). Interestingly, a STAT3 binding site has been identified in the promoter region of the miR-17–92 cluster (38).
We selected three miRNAs for functional testing based on their described roles in apoptosis and cell proliferation; miR-101, miR-29c, and miR-26a were down-regulated in human ALK+ and ALK− ALCL cell lines as well as in primary human tumor tissue. Reintroduction of miR-101 but not miR-29c or miR-26a in ALK+ ALCL cell lines attenuated cell proliferation. Described and validated targets for miR-101 include mTOR (31), the antiapoptotic protein Mcl1 (39), and the histone methyltransferase EZH2 (40, 41). In support of our data, Mcl1 and EZH2 have been reported as overexpressed in ALK+ ALCL as well as in ALK− ALCL (8, 33, 42). Also, activity of the mTOR pathway is enhanced in ALK+ ALCL but not in ALK− ALCL (7, 8). When we treated ALK+ and ALK− ALCL cell lines with the mTOR inhibitor CCI-779, we found that ALK− cell lines were significantly more resistant, suggesting reduced dependence on the mTOR pathway in comparison with ALK+ cells. Accordingly, forced expression of miR-101 had no effect on the growth of the ALK− ALCL cell lines, despite attenuation of mTOR signaling (Fig. S3). To test the importance of the mTOR pathway to ALK-expressing tumors in vivo, we used engrafted murine ALK+ ALCL tumors in mice to demonstrate that inhibition of mTOR activity leads to reduced tumor growth. These data suggest that mTOR inhibitors may constitute a viable therapeutical strategy.
In conclusion, we have identified deregulated miRNAs specific for ALCL and show that many of them target pathways that are highly activated in this disease. Furthermore, we demonstrate that members of the miR-17–92 cluster are more highly expressed in ALK+ ALCL compared with ALK− ALCL and, conversely, that miR-155 is expressed to a higher level in ALK− ALCL. These findings corroborate previous data suggesting that ALK+ ALCL and ALK− ALCL are two distinct diseases entities and open the path to future research elucidating the specific roles of these miRNAs in the ALCL subtypes.
Materials and Methods
Cell Lines and Mice.
The NPM-ALK+ ALCL cell lines SUDHL-1, Karpas 299, and SR786 and the NPM-ALK− cell line MAC-2a were kindly provided by Gerald Hoefler as a gift (Institute of Pathology, Graz, Austria). The ALK− FE-PD cell line was kindly provided by Annarosa del Mistro as a gift (Veneto Oncology Institute, Padua, Italy). CD4/NPM-ALK transgenic mice (18) and cell lines derived from these mice (CD4-417, CD4-4) were generously provided by Giorgio Inghirami as a gift (Department of Pathology and CeRMS, University of Torino, Turin, Italy). Cells were cultured in RPMI medium 1640 containing 10% (vol/vol) FCS and 2 mM l-glutamine (PAA Laboratories). Mice were killed, thymic tumors were excised, and tissue was stored at −80 °C, as were spleens isolated from healthy littermates. Tissue was homogenized in liquid nitrogen, and RNA was extracted using the miRNeasy Mini Kit (Qiagen).
Primary ALCL Tissue Specimens.
FFPE tumors (8 ALK+ and 5 ALK−) were kindly provided by the Institute of Clinical Pathology at the Medical University of Vienna after receipt of informed patient consent and in accordance with the declaration of Helsinki. miRNAs were isolated from 3- to 5-μm-thick sections using the RNeasy Mini Kit (Qiagen) according to the manufacturer's instructions. RNA from FFPE lymph nodes from nine healthy age-matched controls was used as reference material.
miRNA Arrays.
miRNA chips were produced by spotting the LNA-modified miRCURY LNA miRNA Array ready-to-spot probe set no. 208010-A (Exiqon), which consists of 2,056 capture probes designed to have a uniform temperature of 72 °C and covers all miRNAs of miRBase version 9.2 (http://www.mirbase.org/) in eight replicates on Hisens epoxy-coated glass slides (Nexterion) using the MicroGrid II Microarrayer (Zinsser Analytic). Microarrays with immobilized LNA-modified capture probes were hybridized for 16 h at 65 °C on a Slide Booster (Advalytix) in hybridization buffer, followed by three washes in buffers of increasing stringency according to the manufacturer's instructions (Exiqon). RNA (∼1 μg) was isolated from the respective cell lines/murine tumors and CD3+ peripheral T cells of seven healthy donors using the MiRNeasy kit (Qiagen). The RNA was processed using a mercury LNA miRNA Array Power Labeling kit (Exiqon), which contains the fluorescent dyes Oyster656 and Oyster556. Arrays were scanned with a GenePix Personal 4100A (Axon Instruments) and evaluated with Genepix Personal 4100A and Acuity 4.0 software (both Molecular Devices). Each miRNA has eight replicate spots on the array; in addition, a dye swap experiment was performed.
miRNA Transfection.
Cells (2.5 × 10⁵) were transfected with miRNA mimics (miRNA-26a, miRNA-29c, miRNA-101, or miRNA-let-7e; Qiagen) or negative control oligonucleotides using Hiperfect reagent (Qiagen) according to the manufacturer's instructions. Transfection efficiency was validated by qPCR, and overexpression of the respective miRNA in all cases was >25-fold.
miRNA qPCR.
Total RNA was isolated using the miRNeasy Mini Kit. For each miRNA, the specific reverse transcription and real-time PCR Assay Kit (Applied Biosystems) was used following the manufacturer's protocol. Real-time PCR was performed using the 7500 Real-Time PCR system (Applied Biosystems); endogenous snRNU-48 and miR-92 were assessed in human samples, and SNO-202 was assessed in murine specimens. miR-92 was chosen because it was not differentially expressed in any of the samples tested.
Murine Experiments.
A murine xenograft model was established by injecting 5 × 10⁶ CD4-417 or CD4-4 cells into the right flank of BALB/c SCID mice aged 6 wk (43). On average, 3 wk after injection, when solid tumors of ≈0.5 cm were detectable, mice were treated daily for 9 d with i.p. administration of 1.5 mg/kg CCI-779 or sterile PBS. Control mice received i.p. injections with sterile PBS. At day 10, mice were killed, tumors were excised, and the size and weight of the tumors were determined. Xenograft studies and inhibitor treatment were performed following approval by the local ethics committee.
Statistics.
For in vitro tests, a two-tailed unpaired Student's t test was used if not indicated otherwise. For miRNA array evaluation, the following criteria were applied to identify differentially expressed miRNAs: (i) miRNA present in either the control sample and/or in all experimental samples, (ii) the dye swap experiment had to corroborate up- or down-regulation, (iii) a mean ratio of green-to-red fluorescence intensity (including dye swap 16-features) of ≥2 or ≤0.5, and (iv) significant deregulation with P < 0.01 using a two-tailed unpaired Student's t test.
Supplementary Material
Acknowledgments
We thank Elisabeth Gurnhofer for the excellent technical assistance. We are grateful to Giorgio Inghirami for critical discussion of the manuscript. This work was supported by Klinische Malignom und Zytokinforschung Salzburg-Innsbruck GmbH, the “Jubiläumsfond der Österreichischen Nationalbank” (Grant 12170 to R.G.), Spezialforschungsbereich Program P021 (R.G.), Elise Richter Fellowship Fonds zur Förderung der wissenschaftlichen Forschung V102-B12 (to G.E.), Fonds zur Förderung der wissenschaftlichen Forschung Grant P-18478-B12 (to L.K.), and Genome Research-Austria projects “ncRNA” (M.S.), “genomics of lipid associated disorders” (Z.T.), and “Inflammobiota” (L.K.). We are grateful for the support of the Novus-Sanguis Consortium (L.K.). S.D.T. is a Bennett Fellow of Leukemia and Lymphoma Research.
Footnotes
The authors declare no conflict of interest.
*This Direct Submission article had a prearranged editor.
This article contains supporting information online at www.pnas.org/lookup/suppl/doi:10.1073/pnas.1009719107/-/DCSupplemental.
References
- 1.Benz-Lemoine E, et al. Malignant histiocytosis: A specific t(2;5)(p23;q35) translocation? Review of the literature. Blood. 1988;72:1045–1047. [PubMed] [Google Scholar]
- 2.Fischer P, et al. A Ki-1 (CD30)-positive human cell line (Karpas 299) established from a high-grade non-Hodgkin's lymphoma, showing a 2;5 translocation and rearrangement of the T-cell receptor beta-chain gene. Blood. 1988;72:234–240. [PubMed] [Google Scholar]
- 3.Mason DY, et al. CD30-positive large cell lymphomas (‘Ki-1 lymphoma’) are associated with a chromosomal translocation involving 5q35. Br J Haematol. 1990;74:161–168. doi: 10.1111/j.1365-2141.1990.tb02560.x. [DOI] [PubMed] [Google Scholar]
- 4.Morris SW, et al. Fusion of a kinase gene, ALK, to a nucleolar protein gene, NPM, in non-Hodgkin's lymphoma. Science. 1994;263:1281–1284. doi: 10.1126/science.8122112. [DOI] [PubMed] [Google Scholar]
- 5.Lim MS, et al. The proteomic signature of NPM/ALK reveals deregulation of multiple cellular pathways. Blood. 2009;114:1585–1595. doi: 10.1182/blood-2009-02-204735. [DOI] [PubMed] [Google Scholar]
- 6.Marzec M, et al. Oncogenic tyrosine kinase NPM/ALK induces activation of the rapamycin-sensitive mTOR signaling pathway. Oncogene. 2007;26:5606–5614. doi: 10.1038/sj.onc.1210346. [DOI] [PubMed] [Google Scholar]
- 7.Staber PB, et al. The oncoprotein NPM-ALK of anaplastic large-cell lymphoma induces JUNB transcription via ERK1/2 and JunB translation via mTOR signaling. Blood. 2007;110:3374–3383. doi: 10.1182/blood-2007-02-071258. [DOI] [PubMed] [Google Scholar]
- 8.Vega F, et al. Activation of mammalian target of rapamycin signaling pathway contributes to tumor cell survival in anaplastic lymphoma kinase-positive anaplastic large cell lymphoma. Cancer Res. 2006;66:6589–6597. doi: 10.1158/0008-5472.CAN-05-3018. [DOI] [PMC free article] [PubMed] [Google Scholar]
- 9.Chiarle R, et al. Stat3 is required for ALK-mediated lymphomagenesis and provides a possible therapeutic target. Nat Med. 2005;11:623–629. doi: 10.1038/nm1249. [DOI] [PubMed] [Google Scholar]
- 10.Inghirami G, et al. New and old functions of STAT3: A pivotal target for individualized treatment of cancer. Cell Cycle. 2005;4:1131–1133. doi: 10.4161/cc.4.9.1985. [DOI] [PubMed] [Google Scholar]
- 11.Zamo A, et al. Anaplastic lymphoma kinase (ALK) activates Stat3 and protects hematopoietic cells from cell death. Oncogene. 2002;21:1038–1047. doi: 10.1038/sj.onc.1205152. [DOI] [PubMed] [Google Scholar]
- 12.Wellmann A, et al. The activated anaplastic lymphoma kinase increases cellular proliferation and oncogene up-regulation in rat 1a fibroblasts. FASEB J. 1997;11:965–972. doi: 10.1096/fasebj.11.12.9337149. [DOI] [PubMed] [Google Scholar]
- 13.Leventaki V, et al. NPM-ALK oncogenic kinase promotes cell-cycle progression through activation of JNK/cJun signaling in anaplastic large-cell lymphoma. Blood. 2007;110:1621–1630. doi: 10.1182/blood-2006-11-059451. [DOI] [PubMed] [Google Scholar]
- 14.Turner SD, Tooze R, Maclennan K, Alexander DR. Vav-promoter regulated oncogenic fusion protein NPM-ALK in transgenic mice causes B-cell lymphomas with hyperactive Jun kinase. Oncogene. 2003;22:7750–7761. doi: 10.1038/sj.onc.1207048. [DOI] [PubMed] [Google Scholar]
- 15.Raetz EA, et al. The nucleophosmin-anaplastic lymphoma kinase fusion protein induces c-Myc expression in pediatric anaplastic large cell lymphomas. Am J Pathol. 2002;161:875–883. doi: 10.1016/S0002-9440(10)64248-4. [DOI] [PMC free article] [PubMed] [Google Scholar]
- 16.Kuefer MU, et al. Retrovirus-mediated gene transfer of NPM-ALK causes lymphoid malignancy in mice. Blood. 1997;90:2901–2910. [PubMed] [Google Scholar]
- 17.Lange K, et al. Overexpression of NPM-ALK induces different types of malignant lymphomas in IL-9 transgenic mice. Oncogene. 2003;22:517–527. doi: 10.1038/sj.onc.1206076. [DOI] [PubMed] [Google Scholar]
- 18.Chiarle R, et al. NPM-ALK transgenic mice spontaneously develop T-cell lymphomas and plasma cell tumors. Blood. 2003;101:1919–1927. doi: 10.1182/blood-2002-05-1343. [DOI] [PubMed] [Google Scholar]
- 19.Turner SD, Merz H, Yeung D, Alexander DR. CD2 promoter regulated nucleophosmin-anaplastic lymphoma kinase in transgenic mice causes B lymphoid malignancy. Anticancer Res. 2006;26(5A):3275–3279. [PubMed] [Google Scholar]
- 20.Chen Y, et al. Oncogenic mutations of ALK kinase in neuroblastoma. Nature. 2008;455:971–974. doi: 10.1038/nature07399. [DOI] [PubMed] [Google Scholar]
- 21.Horn L, Pao W. EML4-ALK: Honing in on a new target in non-small-cell lung cancer. J Clin Oncol. 2009;27:4232–4235. doi: 10.1200/JCO.2009.23.6661. [DOI] [PMC free article] [PubMed] [Google Scholar]
- 22.Lin E, et al. Exon array profiling detects EML4-ALK fusion in breast, colorectal, and non-small cell lung cancers. Mol Cancer Res. 2009;7:1466–1476. doi: 10.1158/1541-7786.MCR-08-0522. [DOI] [PubMed] [Google Scholar]
- 23.Bartel DP. MicroRNAs: Genomics, biogenesis, mechanism, and function. Cell. 2004;116:281–297. doi: 10.1016/s0092-8674(04)00045-5. [DOI] [PubMed] [Google Scholar]
- 24.Bartel DP. MicroRNAs: Target recognition and regulatory functions. Cell. 2009;136:215–233. doi: 10.1016/j.cell.2009.01.002. [DOI] [PMC free article] [PubMed] [Google Scholar]
- 25.Asslaber D, et al. microRNA-34a expression correlates with MDM2 SNP309 polymorphism and treatment-free survival in chronic lymphocytic leukemia. Blood. 2010;115:4191–4197. doi: 10.1182/blood-2009-07-234823. [DOI] [PubMed] [Google Scholar]
- 26.Kota J, et al. Therapeutic microRNA delivery suppresses tumorigenesis in a murine liver cancer model. Cell. 2009;137:1005–1017. doi: 10.1016/j.cell.2009.04.021. [DOI] [PMC free article] [PubMed] [Google Scholar]
- 27.Costinean S, et al. Pre-B cell proliferation and lymphoblastic leukemia/high-grade lymphoma in E(mu)-miR155 transgenic mice. Proc Natl Acad Sci USA. 2006;103:7024–7029. doi: 10.1073/pnas.0602266103. [DOI] [PMC free article] [PubMed] [Google Scholar]
- 28.He L, et al. A microRNA polycistron as a potential human oncogene. Nature. 2005;435:828–833. doi: 10.1038/nature03552. [DOI] [PMC free article] [PubMed] [Google Scholar]
- 29.O'Donnell KA, Wentzel EA, Zeller KI, Dang CV, Mendell JT. c-Myc-regulated microRNAs modulate E2F1 expression. Nature. 2005;435:839–843. doi: 10.1038/nature03677. [DOI] [PubMed] [Google Scholar]
- 30.Swerdlow SH, et al. WHO Classification of Tumours of Haematopoietic and Lymphoid Tissues. Lyon, France: IARC Press; 2008. [Google Scholar]
- 31.Wang FZ, et al. Human cytomegalovirus infection alters the expression of cellular microRNA species that affect its replication. J Virol. 2008;82:9065–9074. doi: 10.1128/JVI.00961-08. [DOI] [PMC free article] [PubMed] [Google Scholar]
- 32.Salaverria I, et al. Genomic profiling reveals different genetic aberrations in systemic ALK-positive and ALK-negative anaplastic large cell lymphomas. Br J Haematol. 2008;140:516–526. doi: 10.1111/j.1365-2141.2007.06924.x. [DOI] [PubMed] [Google Scholar]
- 33.Eckerle S, et al. Gene expression profiling of isolated tumour cells from anaplastic large cell lymphomas: Insights into its cellular origin, pathogenesis and relation to Hodgkin lymphoma. Leukemia. 2009;23:2129–2138. doi: 10.1038/leu.2009.161. [DOI] [PubMed] [Google Scholar]
- 34.Lamant L, et al. Gene-expression profiling of systemic anaplastic large-cell lymphoma reveals differences based on ALK status and two distinct morphologic ALK+ subtypes. Blood. 2007;109:2156–2164. doi: 10.1182/blood-2006-06-028969. [DOI] [PubMed] [Google Scholar]
- 35.Piva R, et al. Gene expression profiling uncovers molecular classifiers for the recognition of anaplastic large-cell lymphoma within peripheral T-cell neoplasms. J Clin Oncol. 2010;28:1583–1590. doi: 10.1200/JCO.2008.20.9759. [DOI] [PubMed] [Google Scholar]
- 36.Rodriguez A, et al. Requirement of bic/microRNA-155 for normal immune function. Science. 2007;316:608–611. doi: 10.1126/science.1139253. [DOI] [PMC free article] [PubMed] [Google Scholar]
- 37.Mendell JT. miRiad roles for the miR-17-92 cluster in development and disease. Cell. 2008;133:217–222. doi: 10.1016/j.cell.2008.04.001. [DOI] [PMC free article] [PubMed] [Google Scholar]
- 38.Brock M, et al. Interleukin-6 modulates the expression of the bone morphogenic protein receptor type II through a novel STAT3-microRNA cluster 17/92 pathway. Circ Res. 2009;104:1184–1191. doi: 10.1161/CIRCRESAHA.109.197491. [DOI] [PubMed] [Google Scholar]
- 39.Su H, et al. MicroRNA-101, down-regulated in hepatocellular carcinoma, promotes apoptosis and suppresses tumorigenicity. Cancer Res. 2009;69:1135–1142. doi: 10.1158/0008-5472.CAN-08-2886. [DOI] [PubMed] [Google Scholar]
- 40.Friedman JM, et al. The putative tumor suppressor microRNA-101 modulates the cancer epigenome by repressing the polycomb group protein EZH2. Cancer Res. 2009;69:2623–2629. doi: 10.1158/0008-5472.CAN-08-3114. [DOI] [PubMed] [Google Scholar]
- 41.Varambally S, et al. Genomic loss of microRNA-101 leads to overexpression of histone methyltransferase EZH2 in cancer. Science. 2008;322:1695–1699. doi: 10.1126/science.1165395. [DOI] [PMC free article] [PubMed] [Google Scholar]
- 42.Rassidakis GZ, et al. Overexpression of Mcl-1 in anaplastic large cell lymphoma cell lines and tumors. Am J Pathol. 2002;160:2309–2310. doi: 10.1016/S0002-9440(10)61178-9. [DOI] [PMC free article] [PubMed] [Google Scholar]
- 43.Bosma GC, et al. Concentration of IgG1 and IgG2a allotypes in serum of nude and normal allotype-congenic mice. J Immunol. 1980;124:879–884. [PubMed] [Google Scholar]
Associated Data
This section collects any data citations, data availability statements, or supplementary materials included in this article.