Abstract
We report on label-free imaging, detection, and mass/size measurement of single viral particles in solution by high-resolution surface plasmon resonance microscopy. Diffraction of propagating plasmon waves along a metal surface by the viral particles creates images of the individual particles, which allow us to detect the binding of the viral particles to surfaces functionalized with and without antibodies. We show that the intensity of the particle image is related to the mass of the particle, from which we determine the mass and mass distribution of influenza viral particles with a mass detection limit of approximately 1 ag (or 0.2 fg/mm2). This work demonstrates a multiplexed method to measure the masses of individual viral particles and to study the binding activity of the viral particles.
Keywords: influenza virus, human cytomegalovirus, silica nanoparticles, real time detection, solution phase measurement
Understanding, detecting, and identifying viruses are vital for disease prevention, diagnosis, and control. Further advances will benefit from new enabling tools that can study the physical characteristics and biological activity of single viruses. Dynamic light scattering and nanoparticle tracking analysis provide the size information of viral particles by measuring Brownian motion or performing statistical analysis of many particles (1, 2). They are not suitable for binding affinity study of viruses. Other emerging techniques, such as whispering gallery resonators (3–5), mechanical oscillators (6–8), and nanoscale field effect transistors (9) have shown remarkable detection limit using micro- and nano-fabricated structures. The reduced device dimensions not only lead to the detection of single viral particles but also lower the chance for analytes in a dilute solution to reach the small sensing areas (10).
Compared to these nonimaging techniques, imaging techniques resolve individual viruses spatially, allowing for detailed study of each virus and multiplexed detection of different viruses using high throughput microarray technologies, without compromising the sensing areas. A widely used imaging technique is based on fluorescence detection, which can image individual viruses labeled with dye molecules (11). However, label-free techniques are highly desired because they remove possible effects of the labels on the functions of viruses. More importantly, unlike the label-based methods that measure the labels, label-free techniques directly measure the intrinsic physical characteristics of the viruses, providing additional information, such as the mass and size of each virus. Surface plasmon resonance imaging (SPRi) is a label-free technique for in situ detection and study of molecular bindings (12–15), but single virus detection has not yet been reported.
In the present work, we demonstrate label-free detection and imaging of single viruses, using high-resolution SPR microscopy (SPRM). The individual viruses are imaged as they scatter surface plasmon waves. The capability of detecting single viruses allows us to monitor virus–surface interactions and to determine the size and mass, as well as the size and mass distributions, of the viral particles. We have achieved a mass detection limit of approximately 1 ag, and the corresponding mass detection limit per unit area is 0.2 fg/mm2, three to four orders magnitude better than that of the conventional SPR detection methods (15).
Results and Discussions
SPRM Imaging of Influenza A Virus and Silica Nanoparticles.
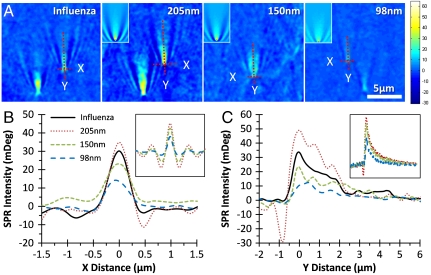
Fig. 2A shows SPRM images of different sized silica nanoparticles and H1N1 influenza A virus. Because the SPR image is surface sensitive, only particles that are on or very close to the surface are visible. The influenza A viral particles have a size range from 90 to 110 nm, according to literature (4). The silica nanoparticles are also smaller than the diffraction limit of the microscope and not visible in transmission image. The SPR images of both viral and silica nanoparticles are shown as bright spots with an interesting V-shaped diffraction pattern. This pattern is due to the scattering of surface plasmon waves by the nanoparticles, which will be discussed in detail later.
Fig. 2.
(A) SPRM images of H1N1 influenza A virus and three different sized silica nanoparticles in PBS buffer. (Insets) Nanoparticle images generated by numerical simulation. (B and C) The SPR intensity profiles of selected particles along X and Y directions (indicated by dashed lines in A, respectively. (Insets) Corresponding profiles from simulated images.
Spatial Resolution.
Fig. 2 B and C shows the image intensity profiles of selected viral and silica nanoparticles, along (Y) and perpendicular to (X) the surface Plasmon propagation direction, respectively (marked by dashed lines in Fig. 2A). Regardless of the size of the particles, the perpendicular direction profiles show a full width at half maximum (FWHM) of about 0.5 μm, which is due to the optical diffraction limit. The theoretical diffraction limit of the microscope with 632 nm laser and NA 1.65 objective is 0.23 μm, and the difference between the two numbers is because the incident laser beam does not fully cover the entire aperture of the objective in our setup, resulting in a smaller effective numerical aperture (Fig. 1). The intensity profile along the surface plasmon propagation direction reveals that the intensity decays with a decay length of approximately 3 μm. The intensity decay measures the finite propagation length of surface plasmon waves (Fig. 2C), which depends on the type of the metal and wavelength of incident light. For example, if using 532 nm light, the propagation length is reduced to approximately 0.2 μm for gold in water, close to the diffraction limit (16). Oscillations in the intensity caused by the interference patterns of the optical system are often observed, but they do not move with the microscope x or y translation and can be easily separated from the real sample features.
Fig. 1.
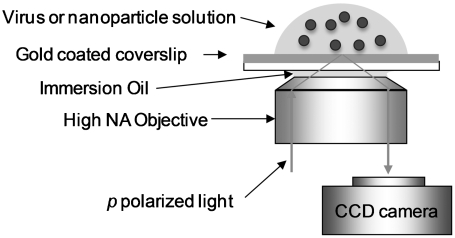
Schematic of the SPRM experiment setup (drawing not to scale). A detailed description of the setup can be found in Materials and Methods.
Diffraction Pattern.
The diffraction patterns associated with the individual particles are helpful for us to identify the nanoparticles from background noises and interference patterns. Numerically simulated SPRM images of nanoparticles (Fig. 2A Insets) confirm that the patterns are due to the nanoparticle-induced scattering of surface plasmon waves. The calculated line profiles (Fig. 2 B and C Insets) match well with the measured profiles. Furthermore, the calculated peak intensity of the diffraction pattern increases with particle size, which is also in agreement with the experimental data.
Virus–Surface Interactions.
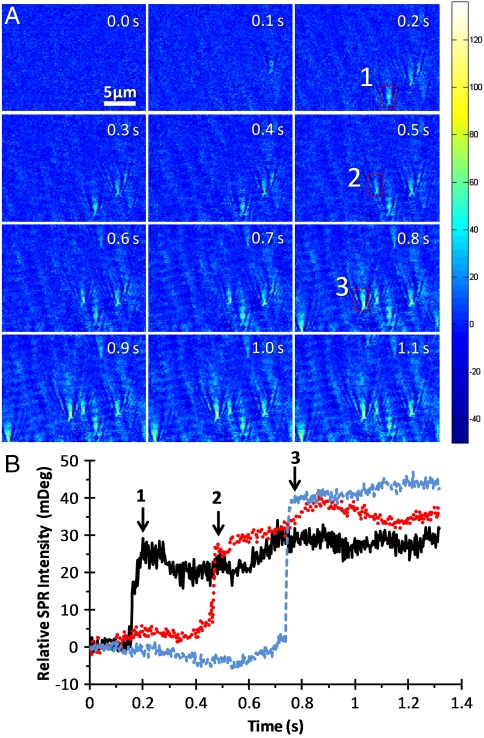
By tracking the particle images over time, we can differentiate different types of virus–surface interactions. We obtained SPRM images of influenza virus on three different surfaces: bare gold, PEG-functionalized surface, and antiinfluenza functionalized surface. Fig. 3A shows a time sequence of SPRM images of influenza A particles on gold. A video (Movie S1) of this sequence is available. Adhesion of the viral particles to the gold surface is observable right after spiking the viral solution into the buffer solution. In contrast, silica nanoparticles do not stick to the surface, and they appear and disappear from the image due to Brownian motion (see Movie S2).
Fig. 3.
SPRM images of influenza A virus on bare gold. (A) SPRM image sequence of Influenza Virus. The color map shows the relative SPR image intensity in mDeg. (B) SPR intensity shifts over time at regions (indicated by rectangles) where individual viral particle adsorb onto the gold surface.
Fig. 3B shows the averaged intensities of three representative viral particles (shown as dashed line rectangles in Fig. 3A) over time on a bare gold surface. The moments at which the viral particles appear in the SPRM image are indicated with arrows. Once a viral particle hits the surface, it stays on the surface, which indicates strong and irreversible nonspecific adsorption of the viral particles on gold.
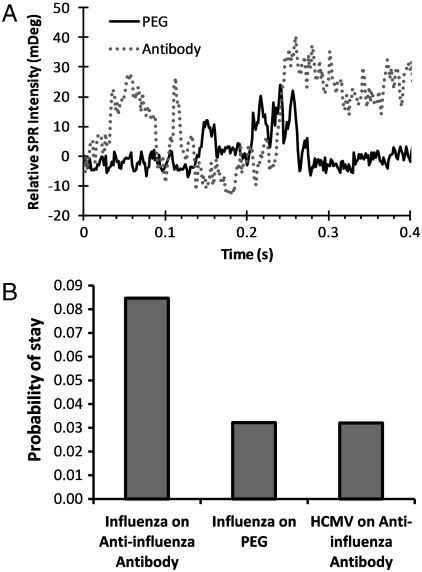
In contrast, the virus behaves quite differently on the PEG and antibody-coated surfaces. Fig. 4A shows typical SPRM intensity profiles over time for individual influenza A viral particles on the two surfaces. On the PEG-functionalized surface, the individual viral particles are imaged only as transient events—they appear and disappear rapidly, which is completely different from the behavior on the bare gold surface. This observation is expected because PEG coating is well known for its capability to block nonspecific binding of biomolecules to surfaces. The transient appearance and disappearance of the viral particles on the PEG-coated surface is due to Brownian motion. On the antibody-functionalized surface, the behavior of the viral particles is in between the two limits described above. We observed that individual viral particles tended to stay on the surface for much longer time than on the PEG-coated surface, but they eventually leave the surface. This observation can be attributed to a reversible binding of the viral particles to the antibody-coated surface.
Fig. 4.
(A) SPR intensity vs. time profiles for influenza A viral particles on PEG and antiinfluenza A antibody-functionalized surfaces. (B) Histogram showing relative binding probabilities of influenza A on PEG and antiinfluenza A antibody-functionalized surfaces. The analysis of control experiment, HCMV on antiinfluenza A antibody-functionalized surfaces, is also shown for comparison. Note the vertical axis of the histogram is the probability of a particle stays on the surface (determined from the time profiles similar to A).
By tracking the individual viral particles in the SPRM image over time, we obtain the probabilities of individual influenza particles staying on the PEG and antiinfluenza-coated surfaces (Fig. 4B). For comparison, the statistical analysis of human cytomegalovirus (HCMV) on the antiinfluenza antibody-coated surface is also plotted in Fig. 4B. The histogram clearly shows that the specific binding of influenza A on the antibody-coated surface is significantly higher than the nonspecific bindings in the two control experiments, influenza A on the control PEG surface and the control virus, HCMV, on the antibody surface.
The single virus detection with our SPRM was carried out in a static solution, but the findings are consistent with those obtained with the conventional flow-through SPR measurement using samples with the same concentrations (Fig. S1). For example, the injection of 0.1 ml of 0.05 mg/ml influenza A solutions at a flow rate of 30 μl/ min resulted in a large irreversible binding of the virus on the bare gold chip, which is due to strong nonspecific interactions between influenza A and gold surface. On a PEG-functionalized chip, no virus binding was detected by the flow-through SPR. On an antibody-coated chip, approximately 45 mDeg SPR angular shift was observed, which is in between the two extremes. Finally, the flow-through SPR detected no significant binding of HCMV (0.25 mg/ml) onto the antiinfluenza A-coated chip.
Quantitative Analysis of Influenza A Size and Mass.
Mass is a fundamental physical parameter of substances, and precise measurement of mass is one of the most important analytical methods, such as mass spectroscopy (17). A widely used method to measure virus mass is based on ultracentrifugation, which determines the averaged mass of virus in a sample from density gradient sedimentation (18, 19). SPR measures the optical mass of each viral particle, which is directly related to the inertia mass of the particle. To determine the mass of influenza virus, we used silica nanoparticles with a refractive index of 1.46 as calibration standard. The refractive index of influenza based on its protein and lipid contents is approximately 1.48, close to that of the silica nanoparticles. Dry influenza consists of 70 to 75% proteins and 20 to 24% lipids (20), and the mass density of hydrated influenza virus is 1.19 g/ml (20, 21). At such a mass density, the refractive index of a protein solution is 1.48 (22), and the refractive index of lipids is similar (23). Based on these considerations, the refractive index of influenza virus was taken to be 1.48.
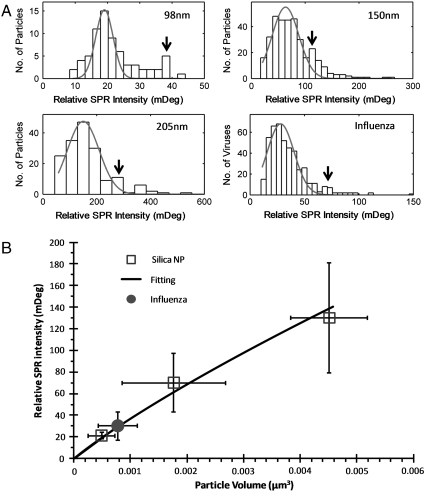
We measured the intensities of the individual nanoparticles from the SPRM images and constructed histograms for silica nanoparticles and influenza viral particles (Fig. 5A). The histograms of the silica nanoparticles can be approximately fit with Gaussian distributions, but a small peak appears at an intensity twice of the main peak in each histogram (arrows in Fig. 5A). We attributed it to the formation of nanoparticle dimers. Fig. 5B plots the relative SPRM intensity at the peak of each histogram vs. silica nanoparticle volume determined from the size and density provided by the manufacturers for each particle sample (Table S1). The intensity of a nanoparticle is expected to be proportional to the volume of the particle exposed in the evanescent field associated with the propagating surface plamsons. By considering that the evanescent field decays exponentially with distance from the surface, we express the intensity with
 |
[1] |
where k is a constant (fitting parameter), z is distance above the gold surface, r is radius of the particle, and l is the decay constant of the evanescent field, which is approximately 200 nm. Eq. 1 provides a good fit to the experimental data shown in Fig. 5B (solid line).
Fig. 5.
(A) Histograms of relative SPR intensity distributions of individual silica nanoparticles and influenza A viral particles. The solid red lines are Gaussian fittings of the distributions. Arrows indicate peaks that are likely due to the formation of dimmers. (B) Calibration curve of SPR intensity plotted vs. particle volumes. The average volume of an influenza particle is obtained from the calibration curve and the average SPR intensity in the histogram plotted in A. The vertical error bars are standard deviations of the Gaussian fittings of the histograms of the SPR intensities. The horizontal error bars for the silica nanoparticles are standard deviations calculated from the coefficient of variation of particle diameter given by the manufacturers, and the horizontal error bars for the influenza are estimated from the standard deviation of the volume extracted from the SPR intensity.
From the calibration curve shown in Fig. 5B and the histogram in Fig. 5A, the volume and diameter of influenza A were found to be 6.8 ± 3.0 × 10⁻⁴ μm3 and 109 ± 13 nm, respectively. Given that the mass density of influenza A is 1.19 g/ml (19), the mass of influenza A virus was determined to be 0.80 ± 0.35 fg, which is in good agreement with the literature values (4, 20, 21) (see SI Appendix for details).
Using the same method, we also obtained the histogram of SPRM image intensity for HCMV viral particles (Fig. S2). Using the calibration curve in Fig. 5B, we find that the average volume and diameter of a HCMV viron are 5.4 ± 0.7 × 10⁻³ μm3 and 218 ± 10 nm (assuming the refractive index of HCMV is 1.48), respectively, which are in consistent with the literature (approximately 230 nm diameter) (24). Using a reported density of 1.219 g/ml (25), we calculated that the mass of each HCMV viron is 6.5 ± 0.8 fg.
Detection Limit.
Fig. S3 shows the noise level of current setup. The noise level for an area covering a single particle image (∼3 × 5 μm) is 0.3 mDeg. Most SPR detections have time resolution of about one second. Using a one-second moving average, we can reduce the noise to 0.04 mDeg. This noise level, according to the calibration curve in Fig. 5, can detect 13 nm nanoparticles, corresponding to a detectable mass of approximately 1 × 10-18 g (1 ag).
A more useful way to define the detection limit is detectable mass per unit sensing area, because it is directly related to the detectable analyte concentration in solution, an important quantity for most applications. This detection limit definition also allows one to compare sensors with different sensing areas. For instance, a small sensor may have a lower total mass detection limit, but its small sensing area makes it less likely to detect the analyte molecules. For our current SPRM setup, the entire image area is the sensing area, which is 0.08 × 0.06 mm2, so the binding of a single particle with mass as small as 1 ag on the sensing area can be detected. In terms of mass per unit area, the achieved detection limit is 0.2 fg/mm2, which is nearly four orders of magnitude better than the typical detection limit of the conventional SPR (15). This improved detection limit is provided by our capability of imaging single viral particles, which allows us to average signals in the regions of viral particles only so that noises in all other regions do not affect the signals of the particles. We note that further improvement in the detection limit may be achieved by using less noisy light source and CCD and by reducing mechanical vibrations of the system.
Conclusion
We have demonstrated label-free imaging, detection, and size and mass measurements of single viral particles with a surface plasmon resonance imaging technique. The individual viral particles are resolved as distinct diffraction patterns generated from the scattering of the propagating surface plasmon waves. In addition, different interactions of the virus with bare gold, PEG-, and antibody-coated surfaces are distinguished by the SPRM images. Finally, the imaging intensities of the viral particles are used to determine the size and mass and their distributions of the individual viral particles. For the two viruses studied in this work, the diameter and mass are found to be 109 ± 13 nm and 0.80 ± 0.35 fg for H1N1 Influenza A/PR/8/34, and 218 ± 10 nm and 6.5 ± 0.8 fg for HCMV, respectively. The mass detection limit achieved in this work is approximately 1 ag, and the mass detection limit per unit area is approximately 0.2 fg/mm2. Further improvement could be made by improving the system stability and reducing noises.
Materials and Methods
Materials.
Silica nanoparticles (98 and 205 nm) were purchased from Microspheres-Nanospheres (Cold Spring, NY), and 150 nm silica nanoparticles were from Bangs Laboratories (Fishers, IN). Purified beta-propiolactone inactivated human influenza A/PR/8/34 (H1N1) and human cytomegalovirus AD 169 viral particles were from Advanced Biotechnologies Inc. (Columbia, MD). Mouse monoclonal antiinfluenza A (H1N1 antigen, clone 9B3.2) IgG2a antibody was purchased from Millipore (Billerica, MA). (1-Mercapto-11-undecyl) hexa(ethylene glycol) (PEG) was purchased from Asemblon Inc. (Redmond, WA). Carboxyl-terminated hexa(ethylene glycol) undecane thiol (PEG-COOH) was purchased from Nanoscience Instruments (Phoenix). Other chemicals were purchased from Sigma-Aldrich (www.sigma-aldrich.com).
Surface Functionalization.
Coating PEG self-assembled monolayer on gold surface.
The SPR chips were BK7 (from VWR, www.vwr.com) or SF11 (from V-A Optical Labs, San Anselmo, CA) glass cover slips coated with 2 nm chromium and then 47 nm gold. Each chip was rinsed with Di-water and ethanol and blown dry with nitrogen gas. The chip was then further cleaned with hydrogen flame and immediately submerged in 1 mM PEG/PEG-COOH (20∶1) ethanol solution. After left in the solution for 24 h in the dark, the chip was taken out of the solution and rinsed with deionized water and ethanol and then blown dry with nitrogen gas.
Immobilization of antiinfluenza antibody.
Each PEG/PEG-COOH coated gold chip was first activated with 0.6 ml freshly prepared 100 mM NHS and 400 mM EDC mixed solution in 50 mM pH 6 MES buffer) for 10 min. Then the chip was cleaned with Di-water and blown dry with nitrogen gas, and 100 μg/ml antiinfluenza A antibody (diluted in 10 mM Na-acetate pH 5.5) was immediately applied to the activated surfaces and kept for 30 to 60 min. Finally, the reaction was terminated with 1 M pH 8.5 ethanolamine.
SPRM Setup.
The SPRM was based on the Kretschmann configuration (26) using a high numerical aperture objective (NA1.65) and inverted microscope (Olympus IX81), an approach by Huang et al. (16) (Fig. 1). A SPR chip was placed on the objective with index-matching liquid. A polarizer was inserted in the optical path to deliver p-polarized light for surface plasmon excitation. A 632.8 nm 10 mW He-Ne laser with the IX81 or a 680 nm 1 mW super luminescence diode (from Qphotonics, Ann Arbor, MI) was used as the light source. The incident angle of the light was adjustable by a motorized translation stage (Thorlabs, Newton, NJ). A custom-made pellicle membrane (2 μm thick) beam splitter (from National Photocolor Corp., Mamaroneck, NY) was used in the beam splitting cube to minimize interference. Two CCD cameras (ORCAR2 C10600 from Hamamatsu, Japan; and Pike F-032B from Allied Vision Technologies, Newburyport, MA) were used with the system for recording the SPRM image. The system can obtain high-resolution distortion-free images with diffraction-limited spatial resolution in the transverse direction and near diffraction-limited spatial resolution along the Plasmon wave propagation direction. A commercial flow-through BI-2000 SPR Instrument (Biosensing Instrument, www.biosensingUSA.com, Tempe, AZ) was used to verify the virus-surface interactions.
SPRM Imaging.
Deionized water (10 μl) or PBS buffer (pH 7.4) was placed on top of the SPR chip, and the incident angle of the laser beam was adjusted to the SPR resonance angle at which the reflection imaged by the camera reached a minimum intensity. A given volume of virus or nanoparticle solution was then added to the liquid drop to a final concentration between 1010–1011 particles/ml, which is sufficient for us to observe many particles in the image within a short time frame (1–30 s). Each SPRM video was recorded at 100 to 640 frames per second (fps) at pixel resolution of 320 × 240 or 320 × 120 (2 × 2 binning) using the Pike camera, or 27 fps at 336 × 256 (4 × 4 binning) with the Hamamatsu camera. Exposure time was chosen to maximize the image intensity and to avoid overexposure.
Data Processing.
The raw SPR images recorded from the camera were converted to 16-bit tiff format files with a Matlab program. After subtracting out background noises, the images were converted into indexed color for easy visualization. The intensity of each particle was determined by calculating the averaged intensity of a small rectangle region of interest selected to include the particle and was normalized and converted to milli-degree (mDeg) of SPR angular shift. The intensity and profile measurements were performed using Image J. Video files were also generated from image sequences using Image J.
Probabilities of particles’ stay on different surfaces presented in Fig. 4B were calculated by the following steps: (i) extract multiple traces of the single nanoparticle SPR intensity data from the SPRM image sequences at selected area; (ii) apply a threshold value above the noise level for each trace to obtain the total on-time for each trace; (iii) divide the total on-time to the total trace time to obtain probability of on-times of the particle; and (iv) average the results from data obtained from 15 to 20 different traces.
Gaussian fittings of histograms of particle SPR intensities were carried out with Matlab or Origin software, and the error bars were obtained from the widths of the Gaussian distributions.
Numerical Simulation.
Numerical simulations of SPRM images of different sized nanoparticles were performed with the RF module of COMSOL multiphysics software. A two-dimensional electromagnetic wave with wavelength of 632 nm was used to simulate the surface plasmon wave propagating along the chip surface, and a circular region with refractive index of 1.46 was used to simulate the nanoparticle. The permittivity of the medium surrounding the nanoparticle was set to be 1.77 + 0.15i, which created a surface plasmon wave with a decay length of approximately 3 μm. This decay length was observed experimentally. Each image was determined from the spatial intensity distribution of normalized scattered waves. A full three-dimensional calculation will be needed for a more quantitative analysis, but the simple model captures the essential physics, nanoparticle-induced scattering of surface plasmon waves, and provides semiquantitatively explanation of the measured images and intensity profiles.
Supplementary Material
Acknowledgments.
We thank the National Science Foundation (CHM-0554786) and the National Center for Research Resources of National Institutes of Health (1R21RR026235) for financial support.
Footnotes
The authors declare no conflict of interest.
This article is a PNAS Direct Submission.
This article contains supporting information online at www.pnas.org/lookup/suppl/doi:10.1073/pnas.1005264107/-/DCSupplemental.
References
- 1.Henk MG. Particle size measurements: fundamentals, practice, quality. 1st Ed. New York: Springer; 2009. [Google Scholar]
- 2.Le TT, Saveyn P, Hoa HD, Van der Meeren P. Determination of heat-induced effects on the particle size distribution of casein micelles by dynamic light scattering and nanoparticle tracking analysis. Int Dairy J. 2008;18(12):1090–1096. [Google Scholar]
- 3.Armani AM, Kulkarni RP, Fraser SE, Flagan RC, Vahala KJ. Label-free, single-molecule detection with optical microcavities. Science. 2007;317(5839):783–787. doi: 10.1126/science.1145002. [DOI] [PubMed] [Google Scholar]
- 4.Vollmer F, Arnold S, Keng D. Single virus detection from the reactive shift of a whispering-gallery mode. Proc Natl Acad Sci USA. 2008;105(52):20701–20704. doi: 10.1073/pnas.0808988106. [DOI] [PMC free article] [PubMed] [Google Scholar]
- 5.Zhu JG, et al. On-chip single nanoparticle detection and sizing by mode splitting in an ultrahigh-Q microresonator. Nat Photonics. 2010;4(1):46–49. [Google Scholar]
- 6.Cipriany BR, et al. Single molecule epigenetic analysis in a nanofluidic channel. Anal Chem. 2010;82(6):2480–2487. doi: 10.1021/ac9028642. [DOI] [PMC free article] [PubMed] [Google Scholar]
- 7.Yang YT, Callegari C, Feng XL, Ekinci KL, Roukes ML. Zeptogram-scale nanomechanical mass sensing. Nano Lett. 2006;6(4):583–586. doi: 10.1021/nl052134m. [DOI] [PubMed] [Google Scholar]
- 8.Naik AK, Hanay MS, Hiebert WK, Feng XL, Roukes ML. Towards single-molecule nanomechanical mass spectrometry. Nat Nanotechnol. 2009;4(7):445–450. doi: 10.1038/nnano.2009.152. [DOI] [PMC free article] [PubMed] [Google Scholar]
- 9.Patolsky F, et al. Electrical detection of single viruses. Proc Natl Acad Sci USA. 2004;101(39):14017–14022. doi: 10.1073/pnas.0406159101. [DOI] [PMC free article] [PubMed] [Google Scholar]
- 10.Sheehan PE, Whitman LJ. Detection limits for nanoscale biosensors. Nano Lett. 2005;5(4):803–807. doi: 10.1021/nl050298x. [DOI] [PubMed] [Google Scholar]
- 11.Brandenburg B, et al. Imaging poliovirus entry in live cells. PLoS Biol. 2007;5(7):e183. doi: 10.1371/journal.pbio.0050183. [DOI] [PMC free article] [PubMed] [Google Scholar]
- 12.Schasfoort RBM, Tudos AJ. Handbook of surface plasmon resonance. Cambridge, UK: RSC Pub; 2008. pp. xxi–403. [Google Scholar]
- 13.Campbell CT, Kim G. SPR microscopy and its applications to high-throughput analyses of biomolecular binding events and their kinetics. Biomaterials. 2007;28(15):2380–2392. doi: 10.1016/j.biomaterials.2007.01.047. [DOI] [PubMed] [Google Scholar]
- 14.Yao JM, et al. Seeing molecules by eye: Surface plasmon resonance imaging at visible wavelengths with high spatial resolution and submonolayer sensitivity. Angew Chem Int Edit. 2008;47:5013–5017. doi: 10.1002/anie.200800501. [DOI] [PubMed] [Google Scholar]
- 15.Homola J. Surface plasmon resonance sensors for detection of chemical and biological species. Chem Rev. 2008;108:462–493. doi: 10.1021/cr068107d. [DOI] [PubMed] [Google Scholar]
- 16.Huang B, Yu F, Zare RN. Surface plasmon resonance imaging using a high numerical aperture microscope objective. Anal Chem. 2007;79(7):2979–2983. doi: 10.1021/ac062284x. [DOI] [PubMed] [Google Scholar]
- 17.Hoffmann Ed, Stroobant V. Mass spectrometry: Principles and applications. 3rd Ed. Chichester, West Sussex, England; Hoboken, NJ: J. Wiley; 2007. [Google Scholar]
- 18.Mazzone HM. CRC handbook of viruses: Mass-molecular weight values and related properties. Boca Raton, FL: CRC Press; 1998. pp. xiii–206. [Google Scholar]
- 19.Reimer CB, Baker RS, Newlin TE, Havens ML. Influenza virus purification with the zonal ultracentrifuge. Science. 1966;152(3727):1379–1381. doi: 10.1126/science.152.3727.1379. [DOI] [PubMed] [Google Scholar]
- 20.Maramorosch Karl, Lauffer MA., editors. Advances in Virus Research. Academic; 1974. p. 18. [Google Scholar]
- 21.Van Regenmortel MHV. International Committee on Taxonomy of Viruses. Virus taxonomy: Classification and nomenclature of viruses: seventh report of the International Committee on Taxonomy of Viruses. San Diego: Academic; 2000. International Union of Microbiological Societies. Virology Division; pp. xii–1162. [Google Scholar]
- 22.Voros J. The density and refractive index of adsorbing protein layers. Biophys J. 2004;87(1):553–561. doi: 10.1529/biophysj.103.030072. [DOI] [PMC free article] [PubMed] [Google Scholar]
- 23.Jin YL, Chen JY, Xu L, Wang PN. Refractive index measurement for biomaterial samples by total internal reflection. Phys Med Biol. 2006;51(20):N371–379. doi: 10.1088/0031-9155/51/20/N02. [DOI] [PubMed] [Google Scholar]
- 24.Shenk T, Stinski M. Human cytomegalovirus. Berlin: Springer; 2008. pp. xiii–475. [Google Scholar]
- 25.Hart H, Norval M. Association of human cytomegalovirus (HCMV) with mink and rabbit lung cells. Arch Virol. 1981;67(3):203–215. doi: 10.1007/BF01318131. [DOI] [PubMed] [Google Scholar]
- 26.Kretschmann E. Die Bestimmung optischer konstanten von metallen durch anregung von oberflachenplasmaschwingungen. Z Phys. 1971;241:313–324. [Google Scholar]
Associated Data
This section collects any data citations, data availability statements, or supplementary materials included in this article.


